
(T2108 measures the percentage of stocks trading above their respective 40-day moving averages [DMAs]. It helps to identify extremes in market sentiment that are likely to reverse. To learn more about it, see my T2108 Resource Page. You can follow real-time T2108 commentary on twitter using the #T2108 hashtag. T2108-related trades and other trades are occasionally posted on twitter using the #120trade hashtag. T2107 measures the percentage of stocks trading above their respective 200DMAs)
T2108 Status: 64.9% (was as high as 69.0% on Black Friday)
T2107 Status: 63.0%
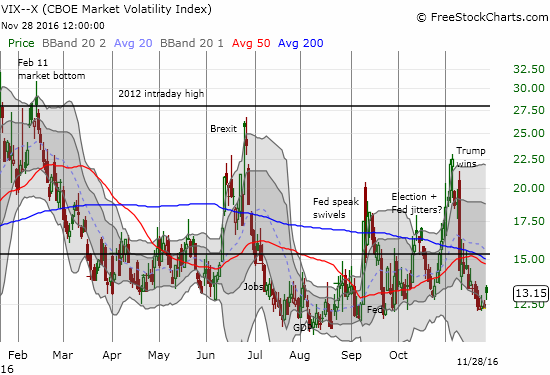
VIX Status: 13.2 (6.6% gain on the day)
General (Short-term) Trading Call: bullish
Active T2108 periods: Day #194 over 20%, Day #14 over 30%, Day #13 over 40%, Day #11 over 50%, Day #5 over 60% (overperiod), Day #84 under 70%
Commentary
The day after Thanksgiving, aka Black Friday, pushed T2108, the percentage of stocks trading above their respective 40-day moving averages (DMAs), to its closest approach to overbought status since August 15, 2016. At that time, T2108 was in the process of falling from overbought conditions. From the week before the U.S. Presidential election to now, the stock market propelled my favorite technical indicator through a rapid journey between the border of oversold (20%) and overbought (70%). The last two similar moves managed to push T2108 over the overbought threshold so the next question is whether the timing of today’s overdue pullback signals the end of the run-up. A break into overbought territory would likely launch a whole new phase of the bull run given the S&P 500 is making fresh all-time highs again.
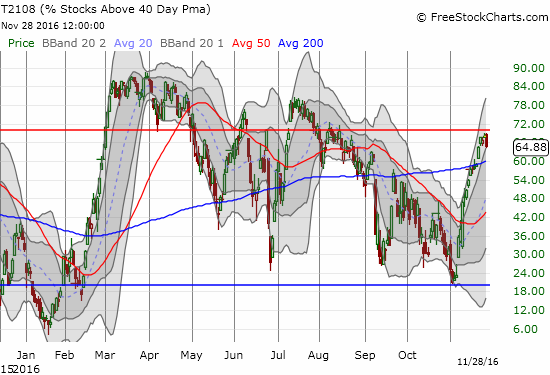
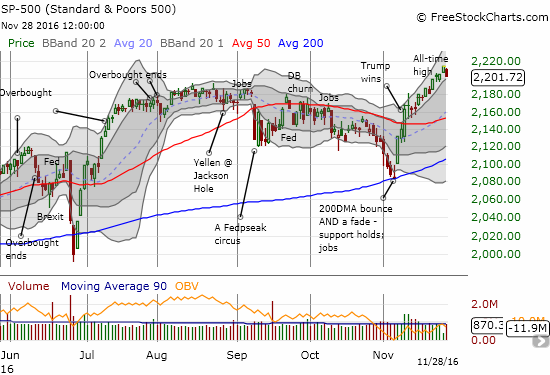
I find it very fitting that the largest pullback of this run-up occurred just before T2108 could cross into overbought territory. Breaking that barrier with the S&P 500 (SPY) making new all-time highs would mark another level of bullishness. Instead, now I must wonder whether the pullback from the border represents long overdue buyer’s exhaustion. Typically, I would flag this kind of move as a potentially bearish move. However, I am not in a rush to wave that flag because nothing has happened to change my now weeks-long assessment that indicated this is a time to be bullish and buy the dips. Moreover, the S&P 500 still sits comfortably within an uptrend defined by the upper-Bollinger Bands (BBs). I will start to reassess if (once?) the index breaks below this bullish uptrend.
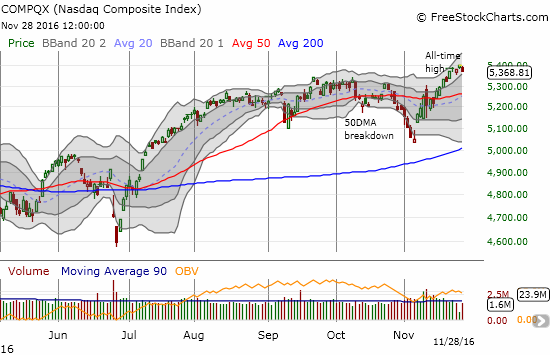
The NASDAQ (QQQ) joined the S&P 500 in the pullback from all-time highs. The NADSAQ is also still within a bullish uptrending channel.
The mild selling on the day was enough to wake up the volatility index, the VIX, from its latest slumber. Today’s 6.6% gain is the largest since November 3rd.
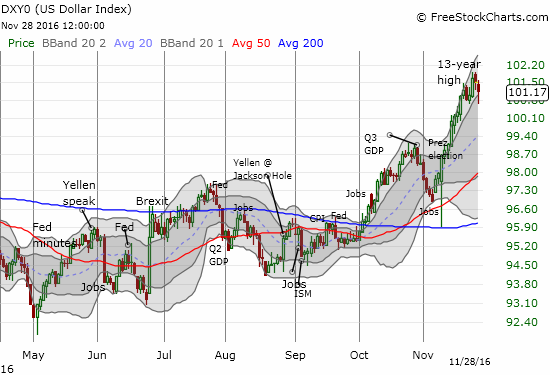
Today’s pause corresponds well with other important and related pauses. The U.S. dollar index (DXY0) notched its last 13-year high on the day before the Thanksgiving holiday. The index looks like it is starting to churn. It dipped briefly below the uptrend channel before recovering. I am assuming that the U.S. dollar index will soon break its uptrend and begin a period of some kind of consolidation.
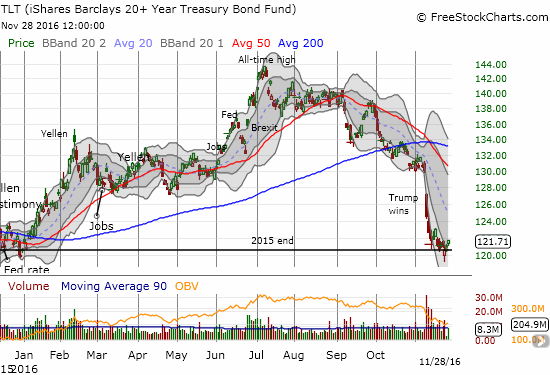
The yield on U.S. government bonds is the main reason I think consolidation is on its way for the U.S. dollar. The iShares 20+ Year Treasury Bond (TLT) looks like it is making a run for a bottom. On the same day the U.S. dollar index notched its last 13-year high, TLT printed a near hammer-like pattern right at flatline with 2015’s close. TLT has erased all its gains for 2016 and this seems like a natural point for buyers to take interest again. TLT has dropped precipitously since its all-time high in July – a 15.2% loss since then.
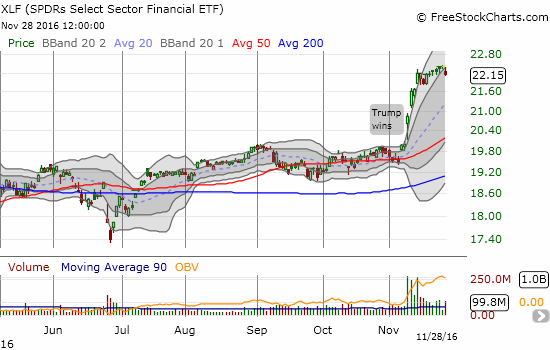
An end to the rise in yields could slap the pause button the dollar and also put an end to the streak for financials. In my last T2108 Update, I noted that I was “chomping at the bit” to buy a dip in financials through the Financial Select Sector SPDR ETF (XLF). Seven trading days later, my standing lowball offer on a handfull of December call options finally triggered. I am duly noting the timing of the buy may prove a bit off. XLF lost 1.2% on the day but is just one day off from an 8 1/2 year high. I would have preferred a first entry at the launch of the last breakout around $21.85. It will be interesting to see whether financials can continue their momentum even with an end to upward momentum on rates (when rates go up, TLT goes down).
— – —
FOLLOW Dr. Duru’s commentary on financial markets via email, StockTwits, Twitter, and even Instagram!
Daily T2108 vs the S&P 500
")
Black line: T2108 (measured on the right); Green line: S&P 500 (for comparative purposes)
Red line: T2108 Overbought (70%); Blue line: T2108 Oversold (20%)
Weekly T2108

*All charts created using freestockcharts.com unless otherwise stated
The charts above are the my LATEST updates independent of the date of this given T2108 post. For my latest T2108 post click here.
Related links:
The T2108 Resource Page
Be careful out there!
Full disclosure: long UVXY shares and long UVXY puts, long XLF call options, net long the U.S. dollar index