
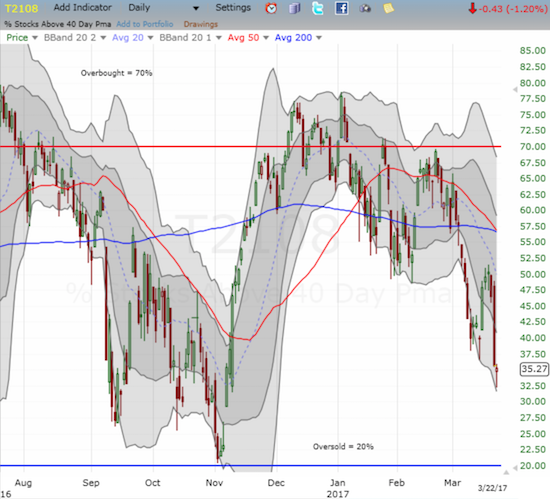
AT40 = 35.3% of stocks are trading above their respective 40-day moving averages (DMAs)
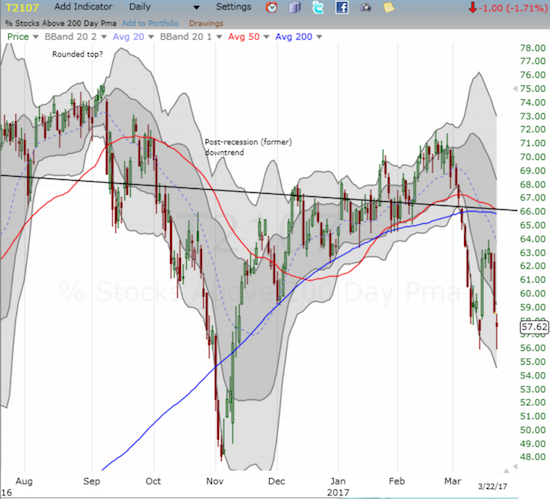
AT200 = 57.6% of stocks are trading above their respective 200DMAs
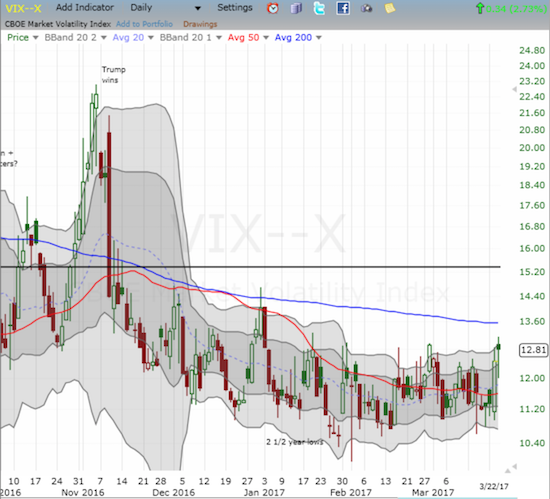
VIX = 12.8 (volatility index)
Short-term Trading Call: bearish
Commentary
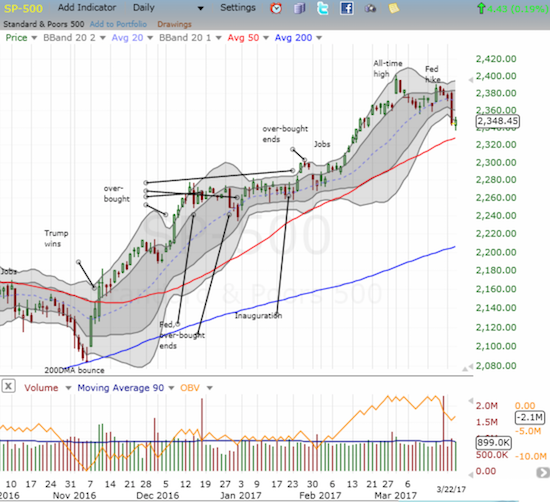
The sellers did their best to create follow-through selling to the previous day’s bearish breakdown. As has been the case so often in this ebullient market, the sellers failed to deliver a convincing strike. Yet, reminders of the bearish breakdown linger.
The S&P 500 (SPY) managed to eke out a marginal gain after printing a marginal loss at the index’s low on the day. This small bounce snapped the index from a loss that was over-extended below the lower-Bollinger Band (BB).
The job of bearish follow-through fell to other indicators.
AT40 (T2108), the percentage of stocks trading above their respective 40DMAs, dropped as low as 32.2% before rebounding to 35.3%. This small bearish divergence from the S&P 500 should now be quite familiar to readers. AT200 (T2107), the percentage of stocks trading above their respective 200DMAs, also closed with a loss, but it rebounded form the low of last week. This successful test is a small ray of light for the bulls even as momentum is turning against them.
The volatility index, the VIX, continued its awakening. The VIX gained marginally, but it closed near a 1-month high. I was hoping for a dip to buy back into a long volatility position. Absent that gift, I am now on watch for a volatility implosion in case Thursday’s political headlines bring fresh life to the market.
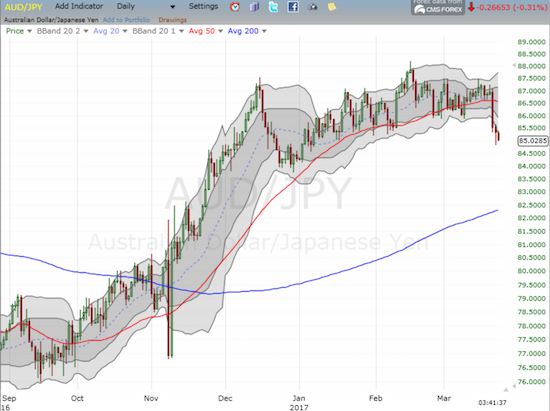
The Australian dollar versus the Japanese yen, AUD/JPY, continued its breakdown from 50DMA support and thus brightened its red warning flag.
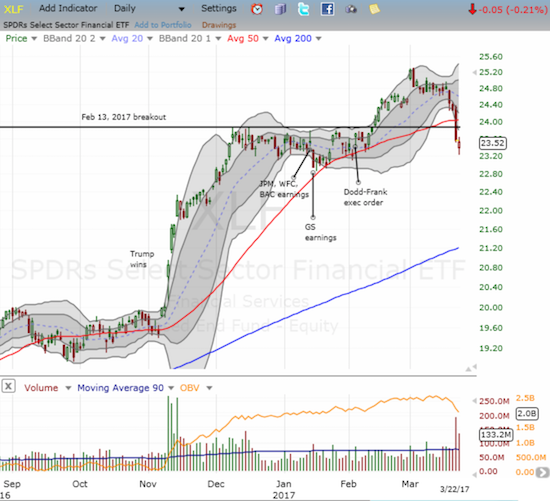
And then there are the financials, the (now sentimental) leaders of the stock market. Financial Select Sector SPDR ETF (XLF) gapped down at the open but quickly recovered to a near flat close. XLF still closed below its lower-Bollinger Band in a confirmation of intense selling pressure. The former breakout line and the 50DMA both loom overhead as stronger sources of upcoming resistance to any attempted rallies.
These signs are running head on into likely political drama from from Washington D.C. as the House of Representatives prepares to vote on “Trump Care.” Apparently, the outcome of this vote could play a significant role in twisting the market’s mood: it could serve as a referendum on Trump’s pro-market, pro-business agenda that added more fuel to the market’s rockets. Here is a key quote from a Reuters piece analyzing the market’s sentiment (emphasis mine):
“Strategists have been cautioning for weeks that markets are pricing in a scenario where nothing goes wrong with Trump’s agenda. Investors are paying $18.10 for every dollar in earnings expected on the S&P 500 over the next 12 months, near the most expensive U.S. stocks have been since 2004.
‘This is really about the fact that the market is pricing in too much certainty on a number of accounts,’ said Julian Emanuel, executive director of U.S. equity and derivatives strategy at UBS Securities. ‘Even if you got the positive vote, there’s still the residual knowledge that the agenda will be difficult to get through the Senate.'”
I am less concerned with the political analysis and much more interested in the market’s reaction to the headlines. Thursday could be a key tell…is the market’s on-going technical deterioration an early warning sign that something is a amiss in the general headlines of strident confidence in financial markets? Will the strongest stocks step into the breach and help move the major indices higher despite protests from the rest of the market? Will something catalyze a realignment to the upside and leave the low 30s on AT40 as the latest case of “close enough” to oversold? Amid these questions, my short-term trading call stays at bearish as the S&P 500 remains below the low of the last breakout point around 2359.
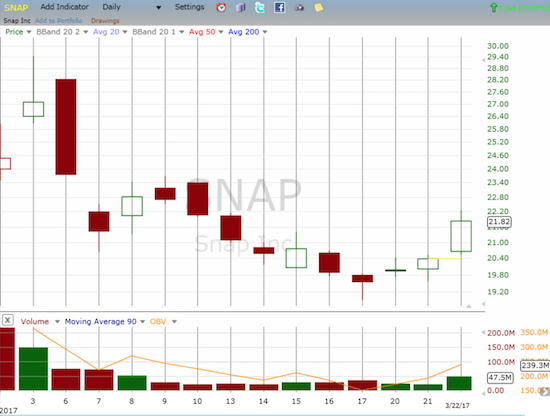
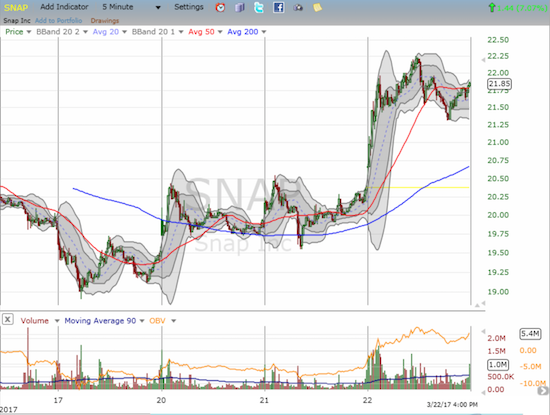
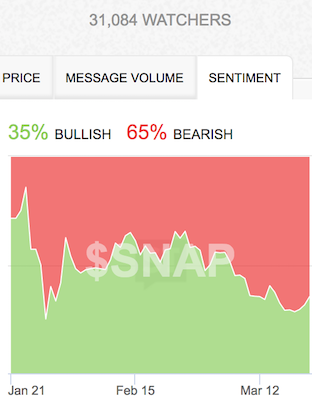
Interestingly, in the middle of this swoon, irony of ironies, Snap, Inc. (SNAP) is enjoying a mini-rally off its all-time low. After an analyst finally gave SNAP a positive grade, I noted that SNAP looked like it may have finally bottomed. I provided a condition for confirming the bottom with cushion, and SNAP made the grade today. It figures that while the rest of the stock market struggles, SNAP enjoys its best three days (on a relative basis) as a young stock.
The day’s positive news came from brave analyst #2. This one outdid the first with a $30 price target. From Barron’s:
“Given the extremely low interest rate environment, and Snap’s growth trajectory with millennials, mobile advertising and AR, we believe the stock is not overvalued. Moreover, we believe the Snapchat platform is valuable and thus this opens the company up as an acquisition target by leading tech players.”
This is just a small snippet of an extended evaluation that Drexel Hamilton drenches with aspiration, optimism, and flexible relativism. I think the stage is being set for SNAP’s underwriters to initiate coverage next month with guns ablazing. While I am riding out this current run, I am looking for one more good short setup before the underwriters get to work.
— – —
FOLLOW Dr. Duru’s commentary on financial markets via email, StockTwits, Twitter, and even Instagram!
“Above the 40” uses the percentage of stocks trading above their respective 40-day moving averages (DMAs) to assess the technical health of the stock market and to identify extremes in market sentiment that are likely to reverse. Abbreviated as AT40, Above the 40 is an alternative label for “T2108” which was created by Worden. Learn more about T2108 on my T2108 Resource Page. AT200, or T2107, measures the percentage of stocks trading above their respective 200DMAs.
Active AT40 (T2108) periods: Day #274 over 20%, Day #94 over 30% (overperiod), Day #2 under 40% (underperiod, ending 4 days over 40%), Day #3 under 50%, Day #15 under 60%, Day #46 under 70%
Daily AT40 (T2108)
")
Black line: AT40 (T2108) (% measured on the right)
Red line: Overbought threshold (70%); Blue line: Oversold threshold (20%)
Weekly AT40 (T2108)

*All charts created using freestockcharts.com unless otherwise stated
The charts above are my LATEST updates independent of the date of this given AT40 post. For my latest AT40 post click here.
Related links:
The T2108 Resource Page
You can follow real-time T2108 commentary on twitter using the #T2108 or #AT40 hashtags. T2108-related trades and other trades are occasionally posted on twitter using the #120trade hashtag.
Be careful out there!
Full disclosure: long SDS, long SNAP