
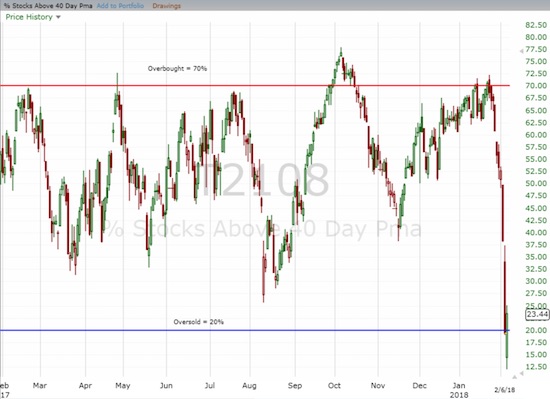
AT40 = 23.4% of stocks are trading above their respective 40-day moving averages (DMAs)
AT200 = 47.8% of stocks are trading above their respective 200DMAs
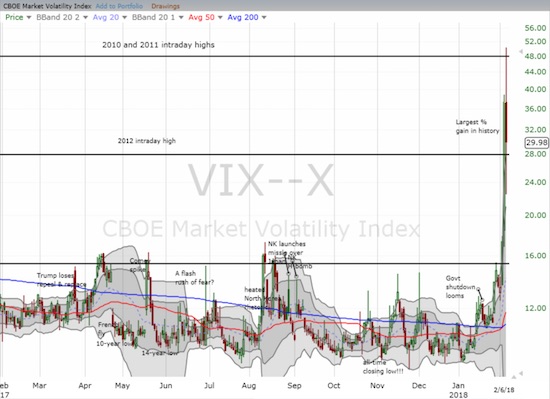
VIX = 30.0 (19.7% decrease, intraday high of 50.3)
Short-term Trading Call: neutral
Commentary
The first oversold period in about two years ended after just one day. As a reminder, AT40 (T2108), the percentage of stocks trading above their respective 40-day moving averages (DMAs), typically only spends 1 or 2 days below 20%. So the market just cycled through a typical oversold period from an historical perspective. Adding to the sense of a bottoming process, AT40 traded as low as 12.0 before soaring to a 23.4% close.
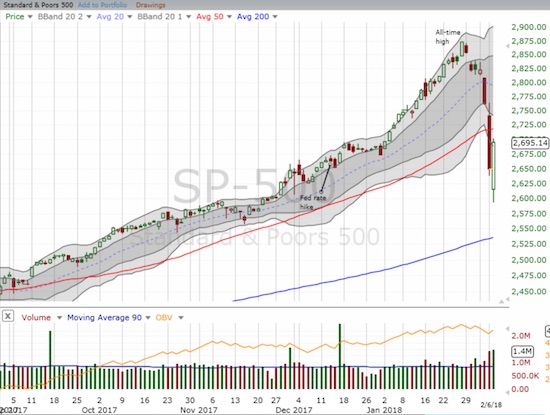
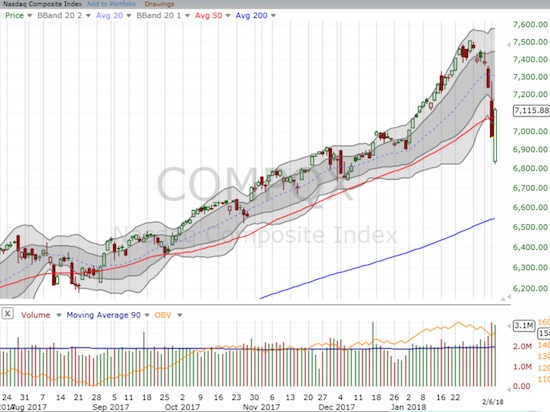
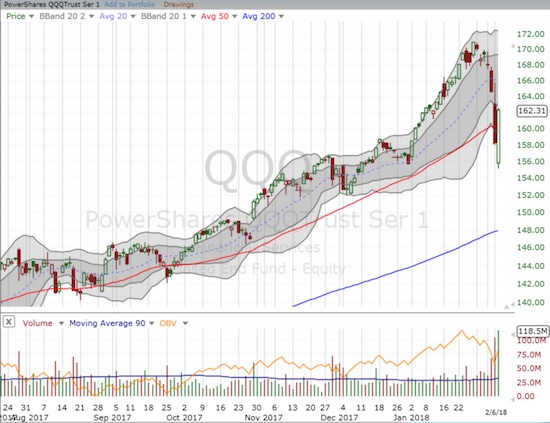
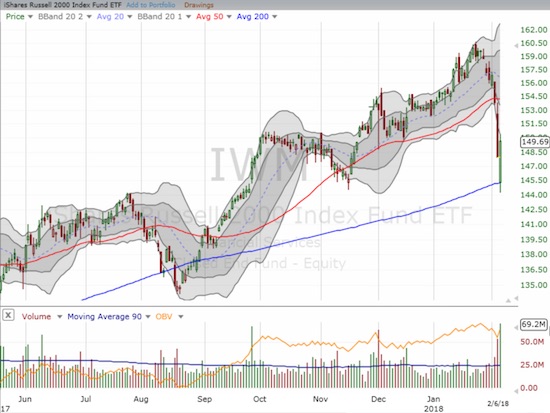
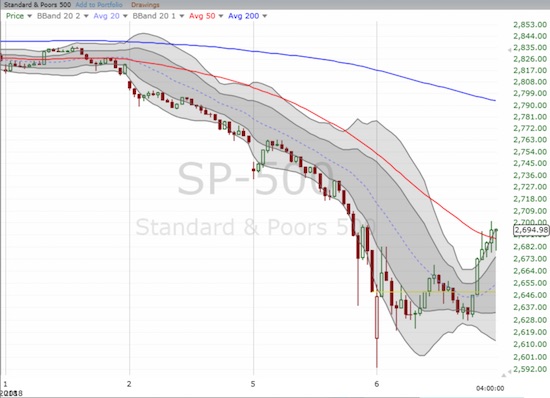
As I noted in the last Above the 40 post, waiting to buy until the oversold period ended would face an immediate test of the S&P 500 staring at resistance from its 50DMA. The index closed with a 1.7% gain after an initial drop further below its lower-Bollinger Band (BB). The GOOD news is that tech stocks led the way such that both the NASDAQ (up 2.1%) and the PowerShares QQQ ETF (QQQ) (up 2.7%) closed ABOVE their 50DMAs. The iShares Russell 2000 ETF (IWM) delivered a relatively convincing bounce of 200DMA support.
Despite the general good cheer on the day, I am sticking to the current short-term trading strategy. I flipped the trading call to neutral in deference to 50DMA resistance for the S&P 500. At the close, I bought a put option on Caterpillar (CAT) as another partial hedge on my recent longs.
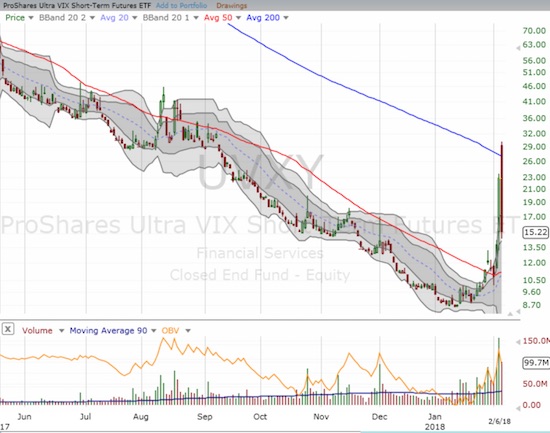
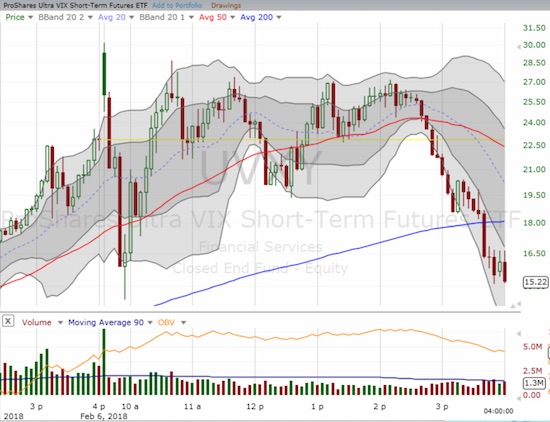
During the day, I focused on trading the oversold conditions. As the VIX soared toward 50, AT40 sank toward 12, and the S&P 500 stretched further below its lower-BB, I felt compelled to buy call options on SPY. A double came quickly as the rubber band of the market snapped back. I also furiously sold my put options on ProShares Ultra VIX Short-Term Futures (UVXY). Over the past week+ I accumulated three tranches. Amazingly, UVXY plunged fast enough to enable me to profit on all my positions. I closed the first two positions during the market’s rapid bounce off the lows. The market’s run-up into the close of trading allowed me to take profits on my last tranche of UVXY put options. I effectively hit the reset button on my volatility bets. Given the blow-up in the short volatility products, I will proceed ever more carefully.
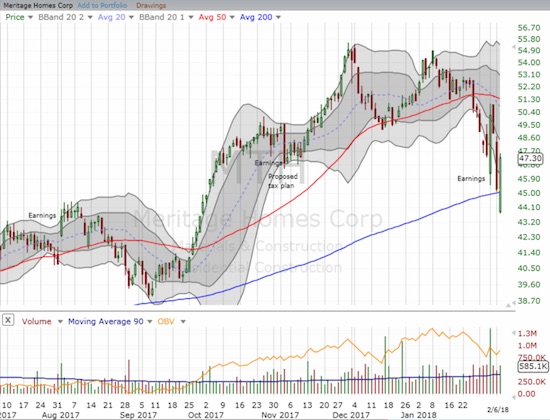
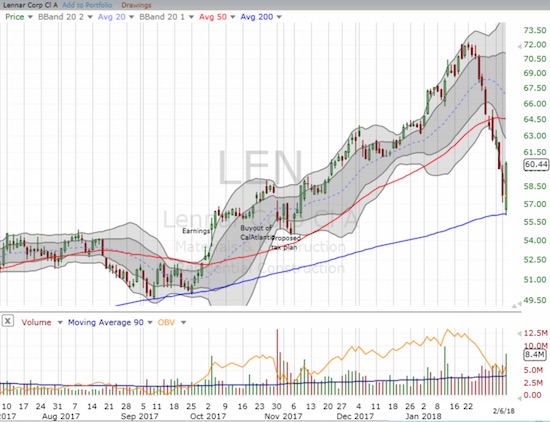
After the early morning success, I rolled out my shopping list again. It was telling that the market filled NONE of my low ball offers. I only got fills where I decided to pay the current asking price. I focused particularly on home builders as I have a specific seasonal strategy in play that extends out over several more months. As a reminder, this sell-off delivered the prices that I believed I would not see again for this seasonally strong period. I made first tranche buys in Meritage Homes (MTH) shares and call options, and I bought call options in Lennar (LEN). MTH gapped down below its 200DMA but surged above it for a 4.7% gain on the day. LEN bounced in picture-perfect style off its 200DMA support.
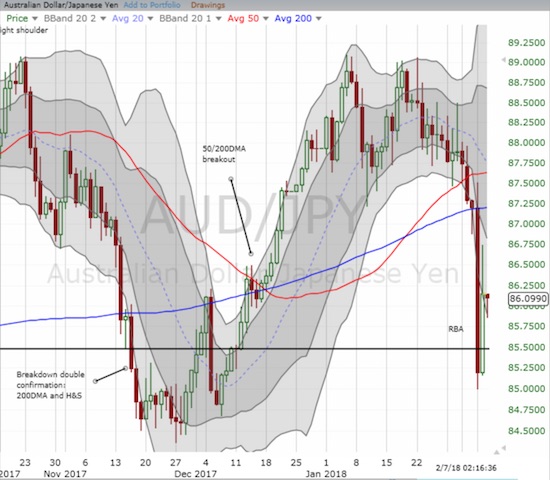
I strongly suspect sellers are not done. Anyone who has soured on this suddenly agitated market and got caught flat-footed by the recent sell-off will likely sell into higher prices. That selling could then easily motivate copycat selling which produces at least one more trip to oversold territory. In other words, the recent lows could easily get retested before the bottoming process comes to an end. In the currency markets, traders seem to be bracing for more selling: the Australian dollar versus the Japanese yen (AUD/JPY) completed an impressive bounce during U.S. trading hours but at the time of typing this indicative currency is fading.
Stay tuned and continue to brace for anything.
CHART REVIEWS
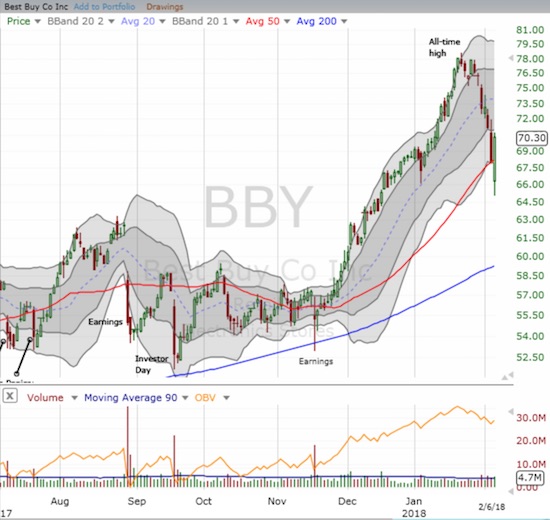
Best Buy (BBY)
BBY is one of the strongest retailers from a trading perspective, and it now has my eye again. The stock gapped down below its 50DMA – no doubt took out a lot of stops – and proceeded to rally above its 50DMA for a 3.4% gain. Much larger trading volume would have given me more confidence in this bounce.
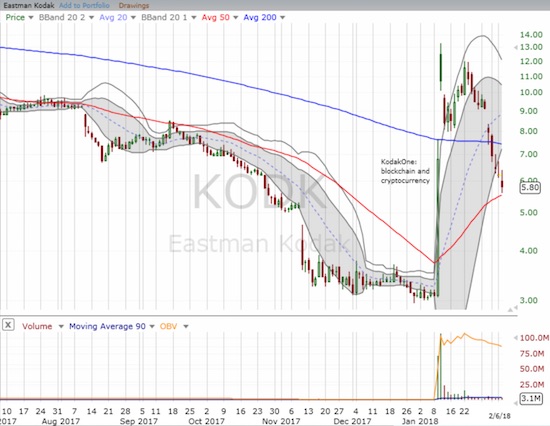
Kodak (KODK)
KODK successfully tested 50DMA support but still closed with a 6.5% loss. The stock is now below where I first speculated on it, and I am ready for a new round. Investors must be getting tired of waiting around for the Initial Coin Offering (ICO). The ICO was supposed to happen at the end of January. I got the following explanation on Monday from a KODK email distribution:
“The ICO is moving full-speed ahead. We expect to close the pre-sale rounds in short order and move to closing the ICO soon after that.
In light of the increased worldwide regulatory interest in ICOs, we are taking the necessary measures to ensure that the KodakCoin ICO complies with all applicable securities and other laws. As a result, the first step in the process is to ensure that all investors satisfy the investor qualification requirements of the applicable jurisdictions in which offers and sales will be made. This phase will last for a few weeks, after which we intend to sell KodakCoins to eligible investors.
We look forward to completing the ICO and moving forward to build an innovative solution to protect the work of photographers.”
— – —
FOLLOW Dr. Duru’s commentary on financial markets via email, StockTwits, Twitter, and even Instagram!
“Above the 40” uses the percentage of stocks trading above their respective 40-day moving averages (DMAs) to assess the technical health of the stock market and to identify extremes in market sentiment that are likely to reverse. Abbreviated as AT40, Above the 40 is an alternative label for “T2108” which was created by Worden. Learn more about T2108 on my T2108 Resource Page. AT200, or T2107, measures the percentage of stocks trading above their respective 200DMAs.
Active AT40 (T2108) periods: Day #1 over 20% (ending 1 day oversold), Day #2 under 30%, Day #3 under 40%, Day #3 under 50%, Day #4 under 60%, Day #10 under 70%
Daily AT40 (T2108)
")
Black line: AT40 (T2108) (% measured on the right)
Red line: Overbought threshold (70%); Blue line: Oversold threshold (20%)
Weekly AT40 (T2108)

*All charts created using freestockcharts.com unless otherwise stated
The charts above are my LATEST updates independent of the date of this given AT40 post. For my latest AT40 post click here.
Related links:
The T2108 Resource Page
You can follow real-time T2108 commentary on twitter using the #T2108 or #AT40 hashtags. T2108-related trades and other trades are occasionally posted on twitter using the #120trade hashtag.
Be careful out there!
Full disclosure: long CAT calls and puts, long MTH calls, long LEN calls, short AUD/JPY
*Charting notes: FreeStockCharts.com uses midnight U.S. Eastern time as the close for currencies. Stock prices are not adjusted for dividends.