
(T2108 measures the percentage of stocks trading above their respective 40-day moving averages [DMAs]. It helps to identify extremes in market sentiment that are likely to reverse. To learn more about it, see my T2108 Resource Page. You can follow real-time T2108 commentary on twitter using the #T2108 hashtag. T2108-related trades and other trades are occasionally posted on twitter using the #120trade hashtag. T2107 measures the percentage of stocks trading above their respective 200DMAs)
T2108 Status: 67.0% (ends a 1-day overbought period that followed a 12-day overbought period)
T2107 Status: 70.2%
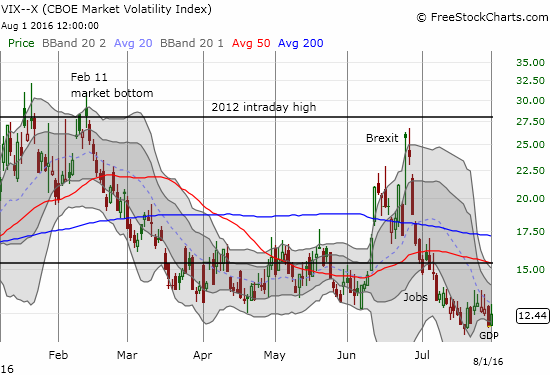
VIX Status: 12.4
General (Short-term) Trading Call: cautiously bearish
Active T2108 periods: Day #118 over 20%, Day #24 over 30%, Day #23 over 40%, Day #22 over 50%, Day #17 over 60% (overperiod), Day #1 under 70% (ends 1-day overbought period) (underperiod)
Commentary
It happened too quickly – T2108 dropped from overbought conditions and triggered a change in my short-term trading call from “cautiously bullish” to “cautiously bearish.” I am not outright bearish only because the S&P 500 (SPY) has yet to break down from its current tight range of consolidation; moreover, the index remains just a hair below its all-time high.
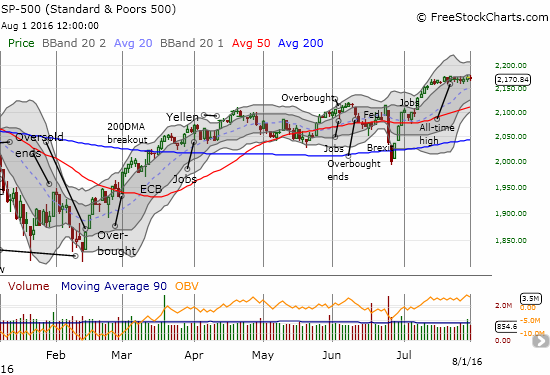
This divergence is the second bearish divergence in three trading days. The first bearish divergence was relatively weak with T2108 closing just under the overbought threshold at 69.9% while the S&P 500 barely budged within its trading range. Today’s bearish divergence is much more definitive with T2108 closing at 67.0%. T2108 has lost almost 12 percentage points from its last high while the S&P 500 has blissfully managed to GAIN 4 points. This divergence now awaits follow-through.
A bearish breakdown would be particularly ominous at this juncture. First, the bulk of earnings season just ended, so selling would imply a net bearish assessment of corporate health. Second, August and September are two of the roughest months of the year for the stock market in terms of potential drawdowns. So I would interpret a confirmed bearish signal as a harbinger of a larger sell-off.
The volatility index, the VIX, perked up of course. Yet, as long as the VIX sits below the 15.35 pivot, it cannot confirm a bearish change in the tone for trading.
Oil (USO) is now of greater and greater interest. Oil (West Texas crude or WTI) closed at $40.08. Oil is now 20% below the last high of $50.
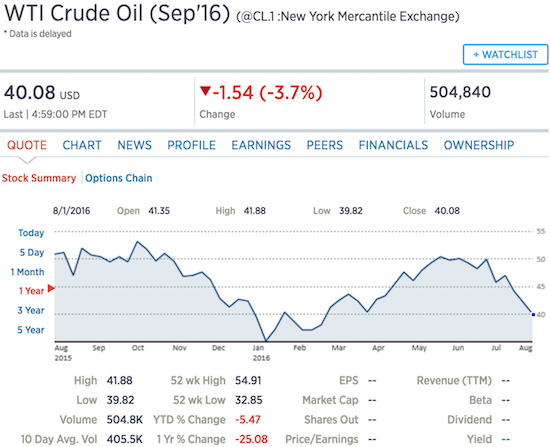
Source: CNBC
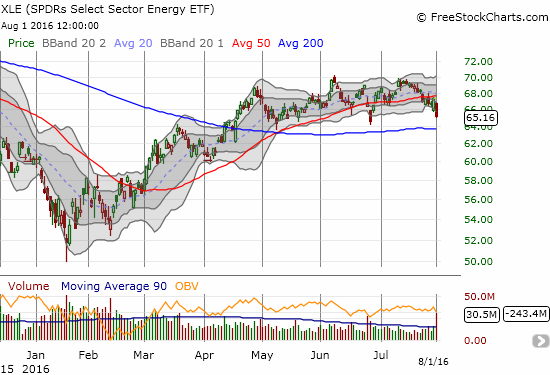
Technically, oil has entered a bear market given the 20% decline from the last high. The definition is just a convention, but nervousness in the market should tick upwards with traders eyeing a clean break of $40 and momentum toward $30. You could be forgiven for thinking that oil’s decline matters little this time if you reviewed equities that were tightly correlated with oil until the last month or more. Forget about the S&P 500; I always thought the obsession with the stock market/oil correlation was misplaced. How about Energy Select Sector SPDR ETF (XLE)? XLE LOOKS like it is printing a triple top but it has yet to break the range roughly in place since April. XLE broke down below 50DMA support last week, but it still has 200DMA support waiting below.
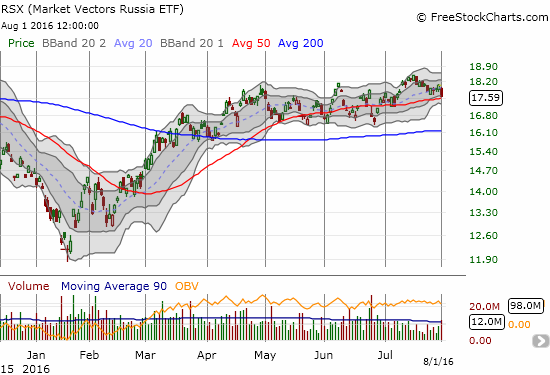
Or how about VanEck Vectors Russia ETF (RSX)? RSX is still sitting on a 5.8% post-Brexit gain. Support at the 50DMA remains in place.
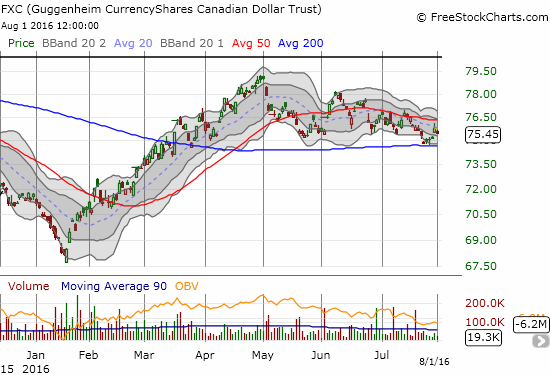
The Canadian dollar (FXC) DOES seem to confirm trouble in the oil patch. FXC peaked just as oil peaked at $50 in May. Since then, FXC has printed lower highs. Yet, FXC still holds support at its 200DMA, it barely made a lower low in late July, and it is only off 4.4% from the May high.
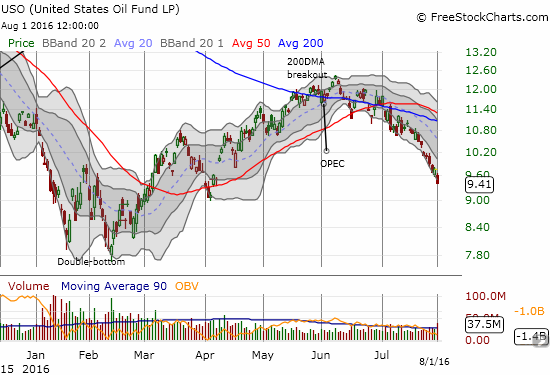
It is entirely possible that XLE, RSX and others are not registering much trouble because oil’s decline is nearing an end. Perhaps the 20% decline from the last high will trigger a big buy signal for oil bulls. In that case, this oil-related bearish divergence would be a false alarm. Still, I decided to nibble on the inverse ETFs related to XLE and RSX, ERY and RUSS respectively. I am particularly interested in these plays since I have an on-going hedged trade on USO that assumed oil hit bottom in January and that USO could maintain its rally for longer or at least stay aloft into 2017.
As these bearish divergences play out, Apple (AAPL) and Netflix (NFLX) are part of the crew making bids to ignore the brewing trouble. I covered both stocks in the last T2108 Update. Today, AAPL posted a 1.8% gain and printed a bullish follow-through to its post-earnings gap up. This move also confirms the 200DMA breakout. With my trading bias flipping to bearish, I am not going to keep these call options as long as I thought I would (they expire next week). I will lock in profits as early as Tuesday of this week. Netflix (NFLX) surged 3.4% on the day and closed right at 50DMA resistance. This move confirms the bullish response to the director’s huge insider purchase of shares. I was slow in moving on NFLX this time: I opened my latest strangle play (call and put options) around the +3% mark.
While I have flipped my trading bias from bullish to bearish, I did not rush to make bearish bets. I am treating my purchases of ERY and RUSS as my first, tentative steps in the bearish direction. I am going to let my call options on SPY play out and will wait for the S&P 500 to break down before chasing down put options on ProShares Ultra S&P500 (SSO).
— – —
Reference Charts (click for view of last 6 months from Stockcharts.com):
S&P 500 or SPY
U.S. Dollar Index (U.S. dollar)
EEM (iShares MSCI Emerging Markets)
VIX (volatility index)
VXX (iPath S&P 500 VIX Short-Term Futures ETN)
EWG (iShares MSCI Germany Index Fund)
CAT (Caterpillar).
IBB (iShares Nasdaq Biotechnology).
Daily T2108 vs the S&P 500
")
Black line: T2108 (measured on the right); Green line: S&P 500 (for comparative purposes)
Red line: T2108 Overbought (70%); Blue line: T2108 Oversold (20%)
Weekly T2108

*All charts created using freestockcharts.com unless otherwise stated
The charts above are the my LATEST updates independent of the date of this given T2108 post. For my latest T2108 post click here.
Related links:
The T2108 Resource Page
Be careful out there!
Full disclosure: long SPY call options, long UVXY shares, long AAPL call options, long NFLX calls and puts, long ERY and RUSS