
(T2108 measures the percentage of stocks trading above their respective 40-day moving averages [DMAs]. It helps to identify extremes in market sentiment that are likely to reverse. To learn more about it, see my T2108 Resource Page. You can follow real-time T2108 commentary on twitter using the #T2108 hashtag. T2108-related trades and other trades are occasionally posted on twitter using the #120trade hashtag. T2107 measures the percentage of stocks trading above their respective 200DMAs)
T2108 Status: 56.9%
T2107 Status: 56.0%
VIX Status: 13.4
General (Short-term) Trading Call: Neutral.
Active T2108 periods: Day #136 over 20%, Day #95 above 30%, Day #39 above 40% (overperiod), Day #1 under 50% (underperiod), Day #5 under 60%, Day #205 under 70%
Reference Charts (click for view of last 6 months from Stockcharts.com):
S&P 500 or SPY
SDS (ProShares UltraShort S&P500)
U.S. Dollar Index (volatility index)
EEM (iShares MSCI Emerging Markets)
VIX (volatility index)
VXX (iPath S&P 500 VIX Short-Term Futures ETN)
EWG (iShares MSCI Germany Index Fund)
CAT (Caterpillar).
Commentary
I have almost felt like a broken record since November/December whenever I note that the S&P 500 (SPY) is trading in a chopfest. Yet, “chopfest” is exactly the perfect description for this trading action even as the index steadily creeps higher along its 50DMA support.
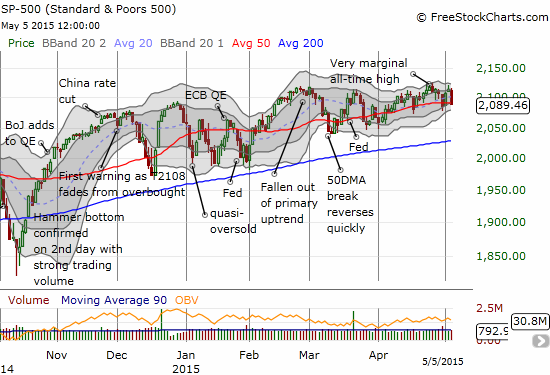
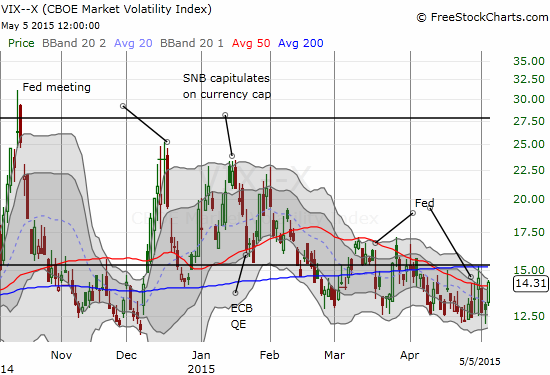
During this chopfest, volatility has made some big moves. However, for almost three months, volatility has remained relatively mute. It is very easy to get lulled asleep here, but I would say volatility is becoming a coiled spring at this point.
Although the S&P 500’s 1.2% decline just reversed Friday’s one-day surge, T2108 has moved to a fresh 5-week low. At 44.6%, I find myself thinking about oversold conditions again…and I know NOT to get too excited. Yet, the extended decline of T2108 relative to the S&P 500 has me wondering whether a bigger breakdown is finally around the corner. I have not yet acted on this suspicion.
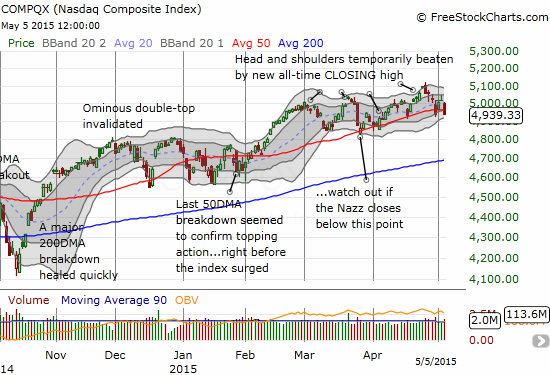
The 50DMA has also acted as support and a magnet for the NASDAQ (QQQ). The trading has been better-behaved than on the S&P 500.
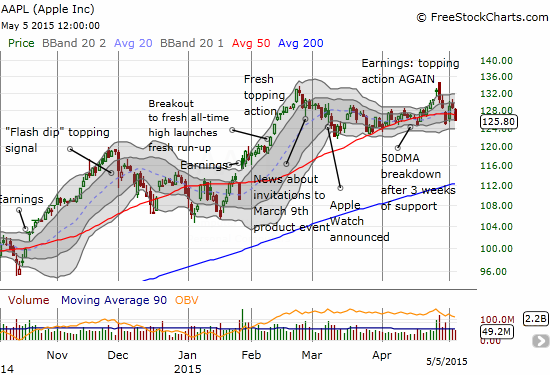
So it should not comes as a surprise to note that Apple (AAPL) continues to pivot around its 50DMA. This trading behavior has easily dominated the Apple Trading Model (ATM) for many weeks now. A potentially large caveat arrived today in the form of a DECLINE in the 50DMA. If AAPL does not pick up the pace soon, this loss of momentum could feed on itself – especially given the stock has failed to generate much post-Watch momentum and excitement. The latest topping pattern is looming ever larger at this point: the post-earnings “gap and crap” combined with a bearish engulfing pattern.
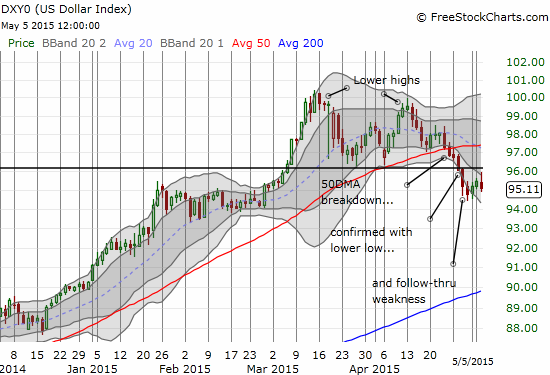
The dollar index is looming as a bigger and bigger wildcard. The primary uptrend at the 50DMA has ended and given way to a confirmed breakdown. Today (May 5) the index attempted to rally but stopped cold at resistance which was former support.
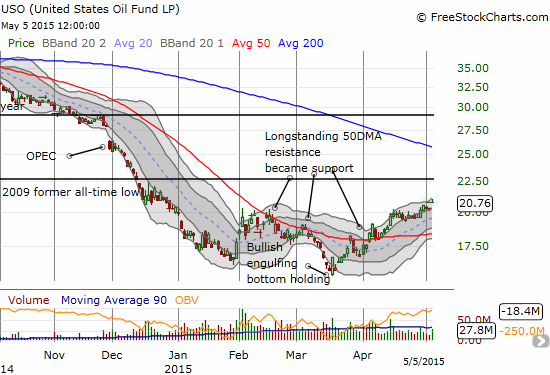
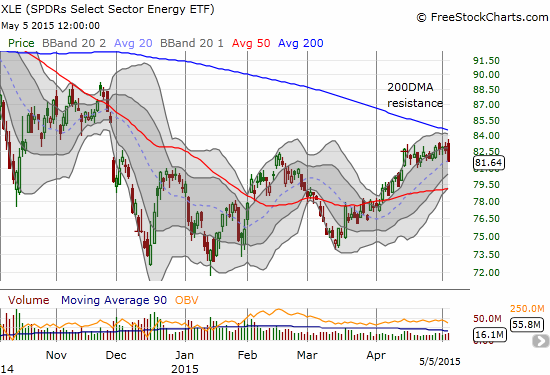
The dollar’s new weakness has potentially large implications for commodities and emerging markets. Oil in the form of United States Oil ETF (USO) is continuing its rally. However, a STRANGE thing happened today. While USO gapped up, Energy Select Sector SPDR ETF (XLE) failed to hold onto its opening gains. The volume was not high, but the price action looks like the end of a move. With oil sapping away the consumer surplus that economists have been waiting to get applied to the economy, several economic assumptions and inflation forecasts may need adjustment soon.
Which oil play will blink and lead the other one…?
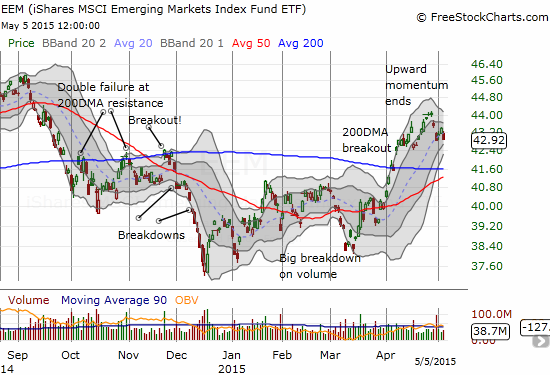
I took this divergence as a signal that dollar-related/sensitive bets could be ready for a big move. I made a big bet on my favorite hedge play: iShares MSCI Emerging Markets (EEM). I am weighted to the bearish side, and I extended out the typical trade with puts expiring in June and calls expiring in July.
Daily T2108 vs the S&P 500
")
Black line: T2108 (measured on the right); Green line: S&P 500 (for comparative purposes)
Red line: T2108 Overbought (70%); Blue line: T2108 Oversold (20%)
Weekly T2108

*All charts created using freestockcharts.com unless otherwise stated
The T2108 Resource Page
Expanded daily chart of T2108 versus the S&P 500
Expanded weekly chart of T2108
Be careful out there!
Full disclosure: long EEM calls and puts