The Fed’s Hawks Escort Stocks Right Back to A Bear Market – The Market Breadth

hawk (credit Red-tailed Hawk by Jon David Nelson on Flickr)

Stock Market Commentary: For those desperately looking for the “Fed pivot”, today’s Federal Reserve statement on monetary policy disappointed with a validation of the breakdown leading into the Fed meeting. Fed Chair Jerome Powell was almost unrelenting from start to finish with his efforts to stay on message: inflation remains too high, and the Fed … Read more

Stock Chart Reviews – Industrial Weakness

Stock Market Commentary: Fears of a recession are running high as the Federal Reserve scrambles to normalize monetary policy. The Fed is racing against an economic clock. It needs to get rates as close to the “neutral rate” as possible before a weakening economy finally forces them to reverse course. The higher the rates when … Read more

Almost Like Nothing Happened – The Market Breadth

Stock Market Commentary Last week opened with a gap down amid hand-wringing about the potential for contagion from debt problems in China’s property market. However, the week ended like nothing happened. The major indices even managed marginal gains after the dust settled. As is so often the case, the Federal Reserve, under the comforting words … Read more

A Test of the Stock Market’s Most Predictable Pattern – The Market Breadth

Stock Market Commentary The S&P 500 (SPY) is a key driver of the stock market’s most predictable pattern. The index’s relentless rise this year has held the majority of the trading action above the 20-day moving average (DMA) (the dotted line in the chart below). Brief dips below the 20DMA set up tests of the … Read more

Weakness Lingers As the Oversold Rebound Cools – The Market Breadth (July 30, 2021)

Stock Market Commentary Welcome to the new world of “The Market Breadth.” I used the switch from AT40 (T2108) to AT50 (MMFI) as my market breadth indicator to improve the name of this blog series. The Market Breadth marks a change from a technical name that sounds like a Space X rocket to an English … Read more

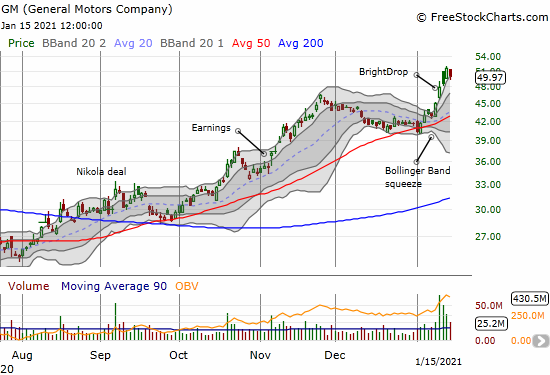
General Motors Stock: The Bollinger Bands Drop Before the BrightDrop

The General Motors Company (GM) launched sharply higher out of a Bollinger Band squeeze.

Bollinger Bands (BBs) are a powerful trading tool. They define an expected range of volatility in a stock based on recent price action. When that volatility contracts, the Bollinger Bands squeeze into a narrow channel. The resolution of that squeeze – to the upside or downside – can create a powerful continuation of or change … Read more

Overbought Period Demonstrates Freshly Bullish Sentiment for Stocks – Above the 40 (January 8, 2021)

Stock Market Commentary What a week to start the year’s trading. It started with a definitively bearish end to extended overbought conditions. Overbought conditions bullishly resumed in the middle of the week despite an insurrection in Washington D.C. The week ended with a confirmation of the freshly bullish sentiment in the market. The trading action … Read more

An Extended Overbought Rally Moves Into Historic Territory (Above the 40) – December 18, 2020

Stock Market Commentary The Federal Reserve signaled an incremental improvement in its economic outlook by making an allowance for limited stock repurchases and dividends by the country’s top financial institutions. As a result, bank stocks apparently soared in after hours trading. That fresh rally in financials should extend to a positive open on Monday and … Read more

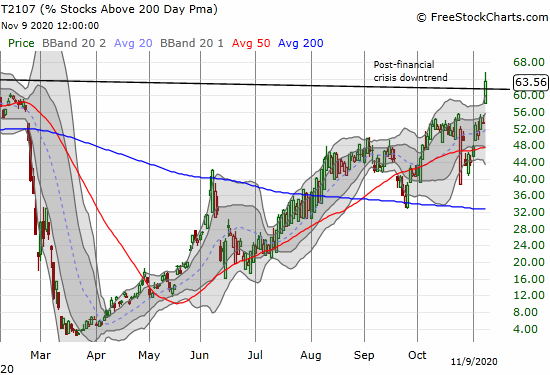
Bearish Indices and Bullish Reopen Stocks Create Abrupt Rotation – Above the 40 (November 9, 2020)

AT200 (T2107) surged 10 percentage points to close near a 3-year high and a breakout above the post financial crisis downtrend.

Stock Market Statistics AT40 = 67.8% of stocks are trading above their respective 40-day moving averages (DMAs) (high of 75.1%) AT200 = 63.6% of stocks are trading above their respective 200DMAs (near 3-year high and breakout above post financial crisis downtrend) VIX = 25.8 (as low as 22.4) Short-term Trading Call: neutral Stock Market Commentary … Read more

The Stock Market Pushes Through Its 50DMA Resistance – Above the 40 (September 28, 2020)

Stock Market Statistics AT40 = 33.6% of stocks are trading above their respective 40-day moving averages (DMAs) AT200 = 42.6% of stocks are trading above their respective 200DMAs VIX = 26.2 Short-term Trading Call: cautiously bullish Stock Market Commentary The major indices bounced out of oversold trading conditions only to face down the immediate challenge … Read more