Stock Market Commentary
“This may be the most dangerous time the world has seen in decades.” This statement from Jamie Dimon, CEO of JPMorgan Chase (JPM), concluded his commentary on the bank’s Q3 earnings report. These words on Friday morning fittingly concluded a sobering week that started with tragedy and war raging in Gaza and Israel. While it is tough to get excited about trading financial markets while trouble abounds, the faith that extremes will not outlast our hopes serves as a central tenet of the Market Breadth. Sometimes, we do not even recognize the risks that are ever present in world, risks that can seemingly come out of nowhere but were brewing all along. In this moment, risks are quite palpable. Yet, we must find a path to move forward.
So with that preamble in mind, I take a measured look at a stock market that rallied in spite of the tragic news for the first 3 days of the week. The last two days of selling came in the wake of September inflation numbers that essentially met “expectations” but still left the market dissatisfied. I suspect traders are impatient for signs that will force the Federal Reserve to transition from rates “higher for longer” to “higher for just a while longer.” Regardless, I understand the market rally in the context of an oversold bounce that leaves a default, upward path for prices. That path of least resistance exhausted itself by the time economic news came along to catalyze a fresh change in market sentiment.
The Stock Market Indices
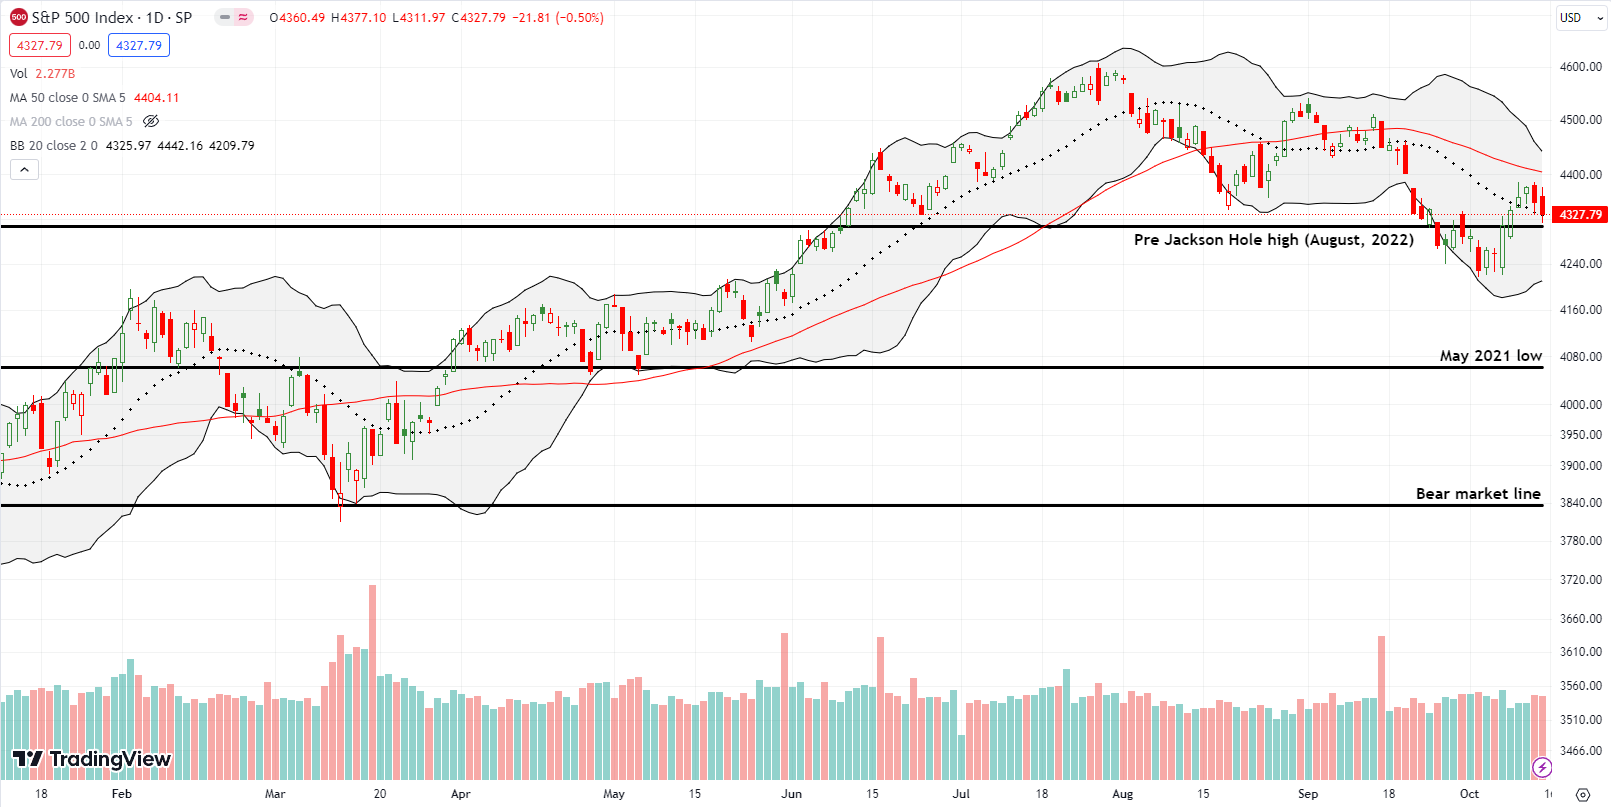
The S&P 500 (SPY) started the week breaking out above the pre Jackson Hole high from last year. The index acted like nothing happened over the weekend, and it ignored the surge in oil prices. A drop in U.S. bond yields seemed to provide a sufficient excuse for buyers to keep pressing the issue above the 20-day moving average (DMA) (the dotted line). Tuesday’s fade short of resistance at the 50DMA (DMA) printed the index’s highest price for the week even with more buying on Wednesday. Sellers stepped in and took the S&P 500 back to 20DMA support for the final two days of the week. A downtrending 50DMA still looms overhead as stiff resistance.
I go into the coming week with the long side of a SPY calendar call spread at the $440 strike.
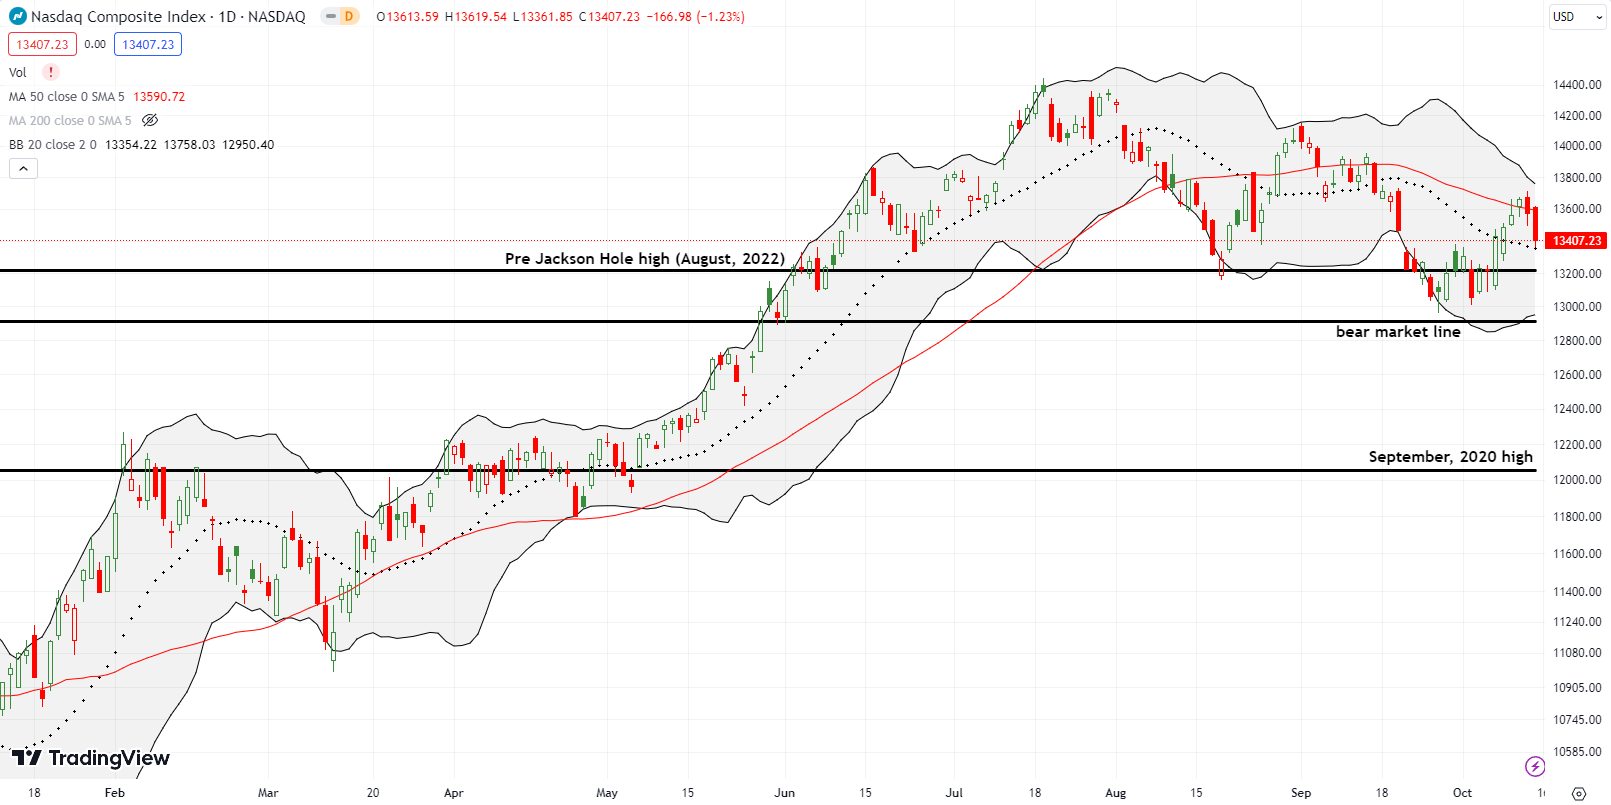
The NASDAQ (COMPQ) under-performed the S&P 500 to start the week but it managed to close above 50DMA resistance on Wednesday. The brief display of resilient bullishness faded into a fresh 50DMA breakdown and test of 20DMA support the final two days of the week. I am less sure what to make of this trading action, but much like the S&P 500, an overall downtrend from the summer highs remains intact with lower highs and lower lows.
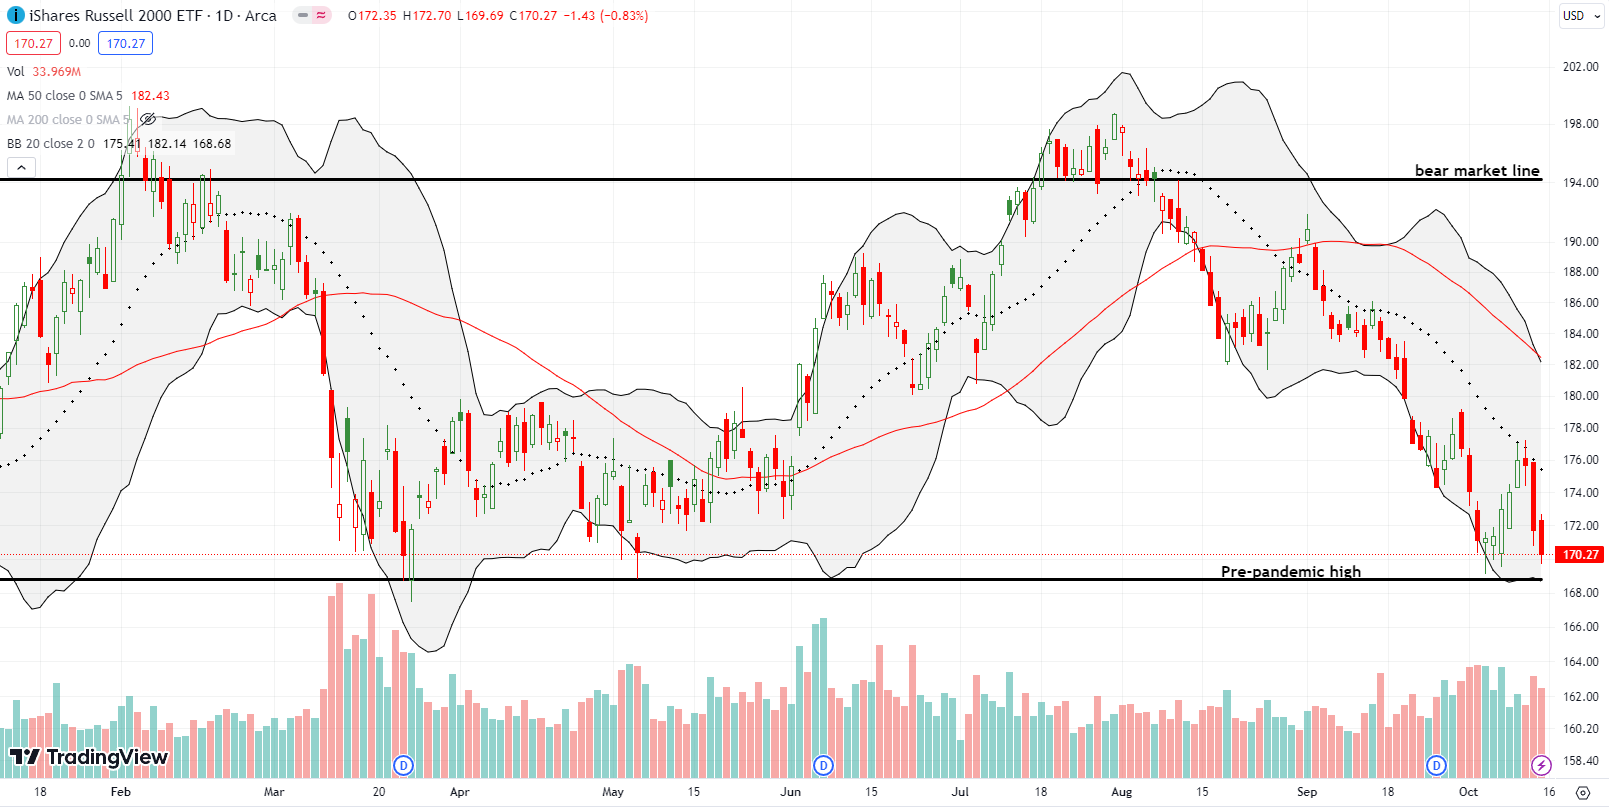
The iShares Russell 2000 ETF (IWM) only experienced two days of buying. Resistance at the downtrending 20DMA proved too stiff to overcome for buyers. The stall on Wednesday portended the swing of the pendulum back to sellers. the CPI “disappointment” slammed small caps particularly hard. IWM lost 2.3% on Thursday and almost retested the pre-pandemic high on Friday. I went ahead and jumped into IWM calls on Thursday and Friday in anticipation of a rebound by the end of the coming week.
The Short-Term Trading Call When Trouble Abounds
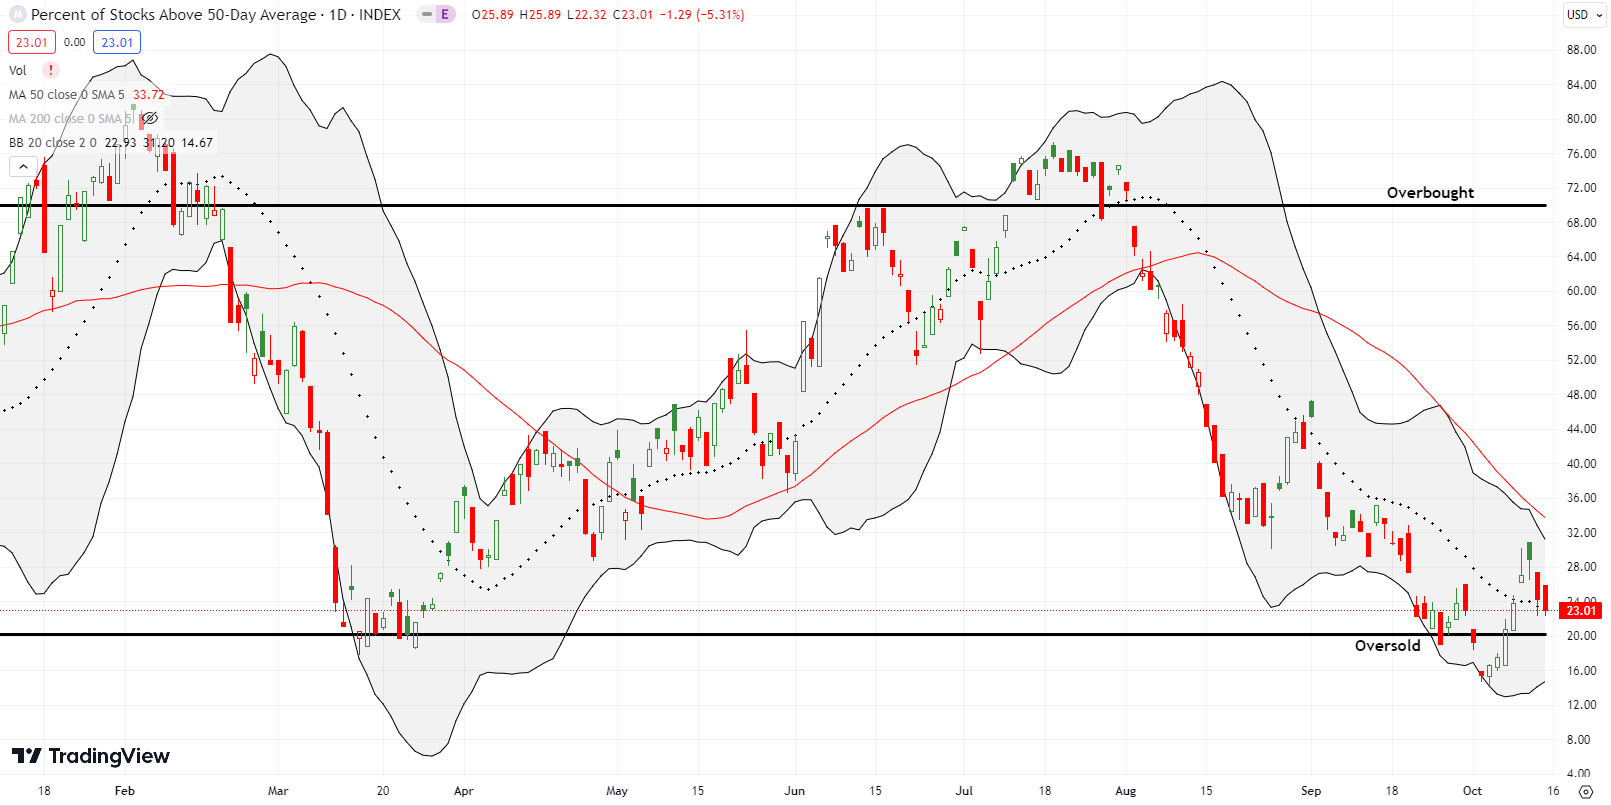
- AT50 (MMFI) = 23.0% of stocks are trading above their respective 50-day moving averages (ending a 1-day oversold period)
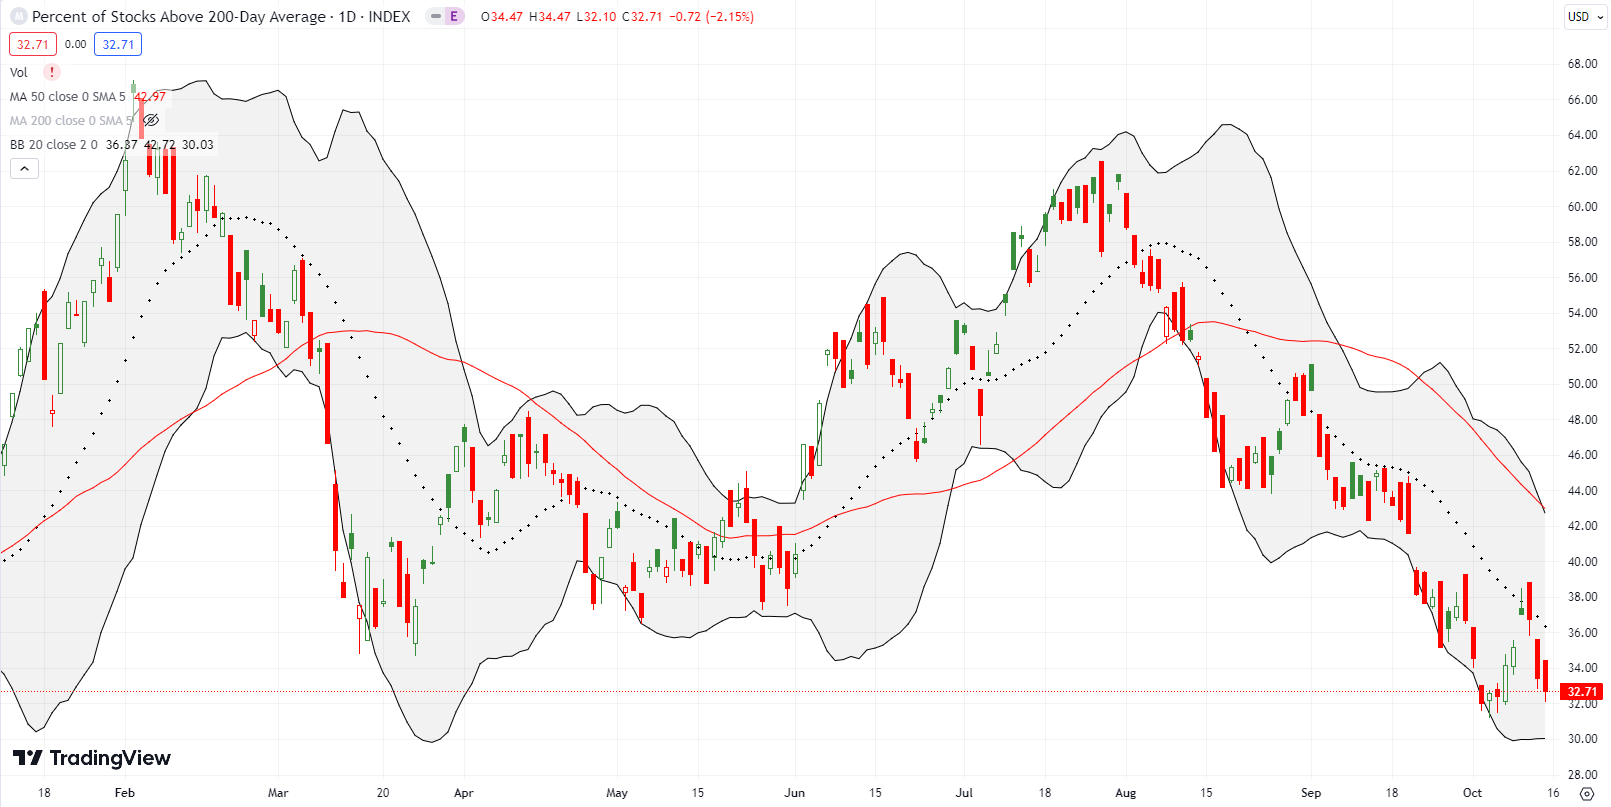
- AT200 (MMTH) = 32.7% of stocks are trading above their respective 200-day moving averages
- Short-term Trading Call: cautiously bullish
AT50 (MMFI), the percentage of stocks trading above their respective 50DMAs, had a peak close of 28.9% for the week. Market breadth shot straight up from oversold conditions for six days straight, so a cooling was overdue. My favorite technical indicator ended the week at 23.0% with enough downward momentum to reenter oversold territory in coming days. Now that trouble abounds, the weight of risk factors makes a return to oversold trading look even more likely. (Government shutdown in November anyone?). Accordingly, I downshifted my bullishness to cautiously bullish. I am content to wait for a confirmed 50DMA breakout for the S&P 500 to gear back up to fully bullish. In the meantime, I am also taking quick shots at some shorts and puts until AT50 drops below 20% again.
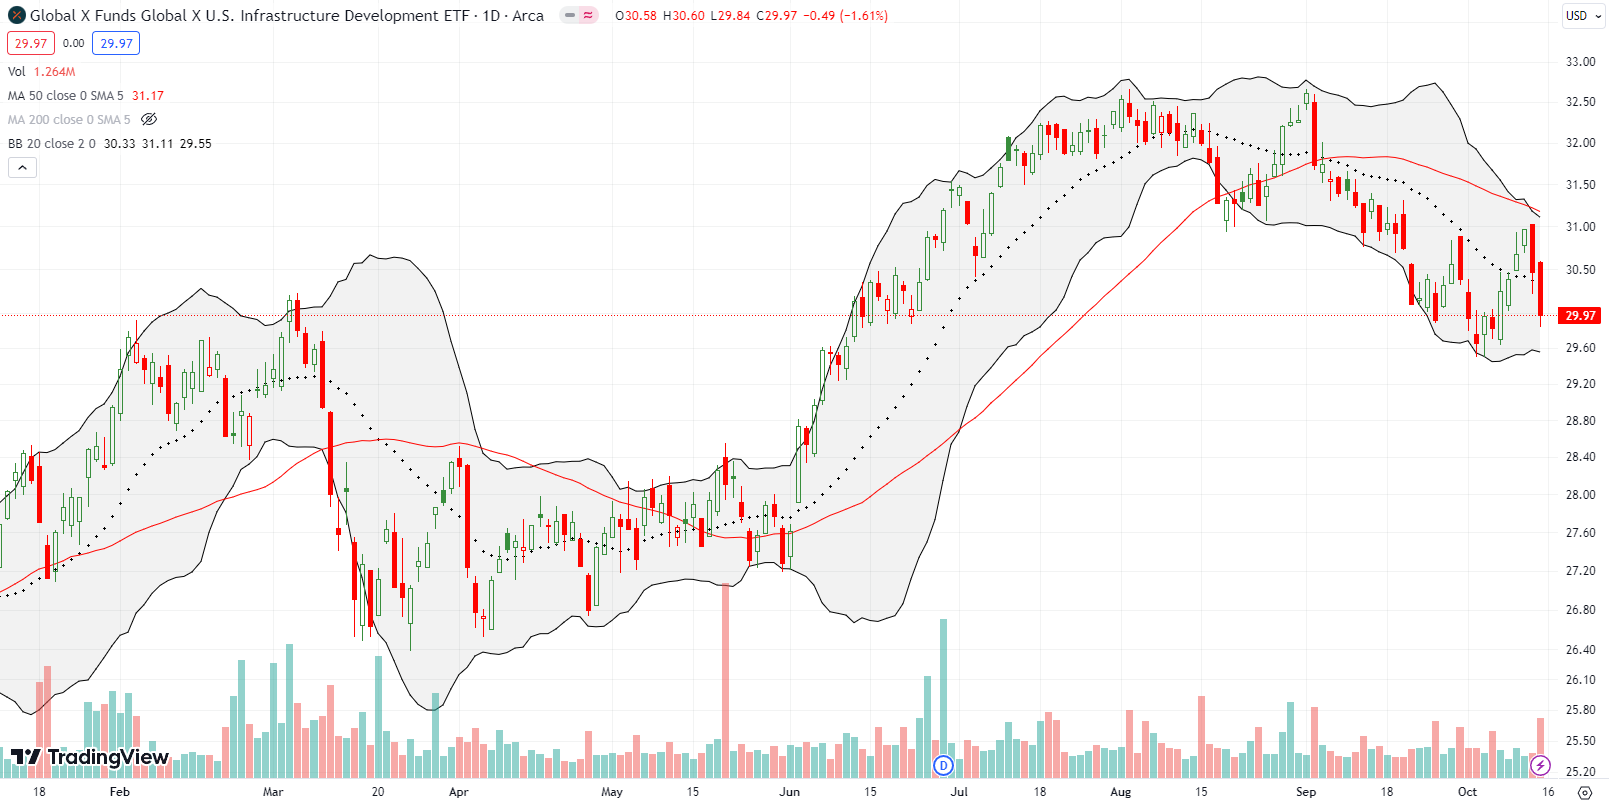
I held the Global X US Infrastructure Development ETF (PAVE) for a long time as a bet on infrastructure spending. PAVE is just barely beating the S&P 500 year-to-date 13.3% versus 12.7%, but I bailed on PAVE last week after seeing it fail right at 50DMA resistance. Moreover, the double-top across August and September looks ominous. I will definitely jump back in if PAVE somehow returns to or toward 2023 lows. Notice how PAVE reversed all the gains from the June (summer of love) breakout.
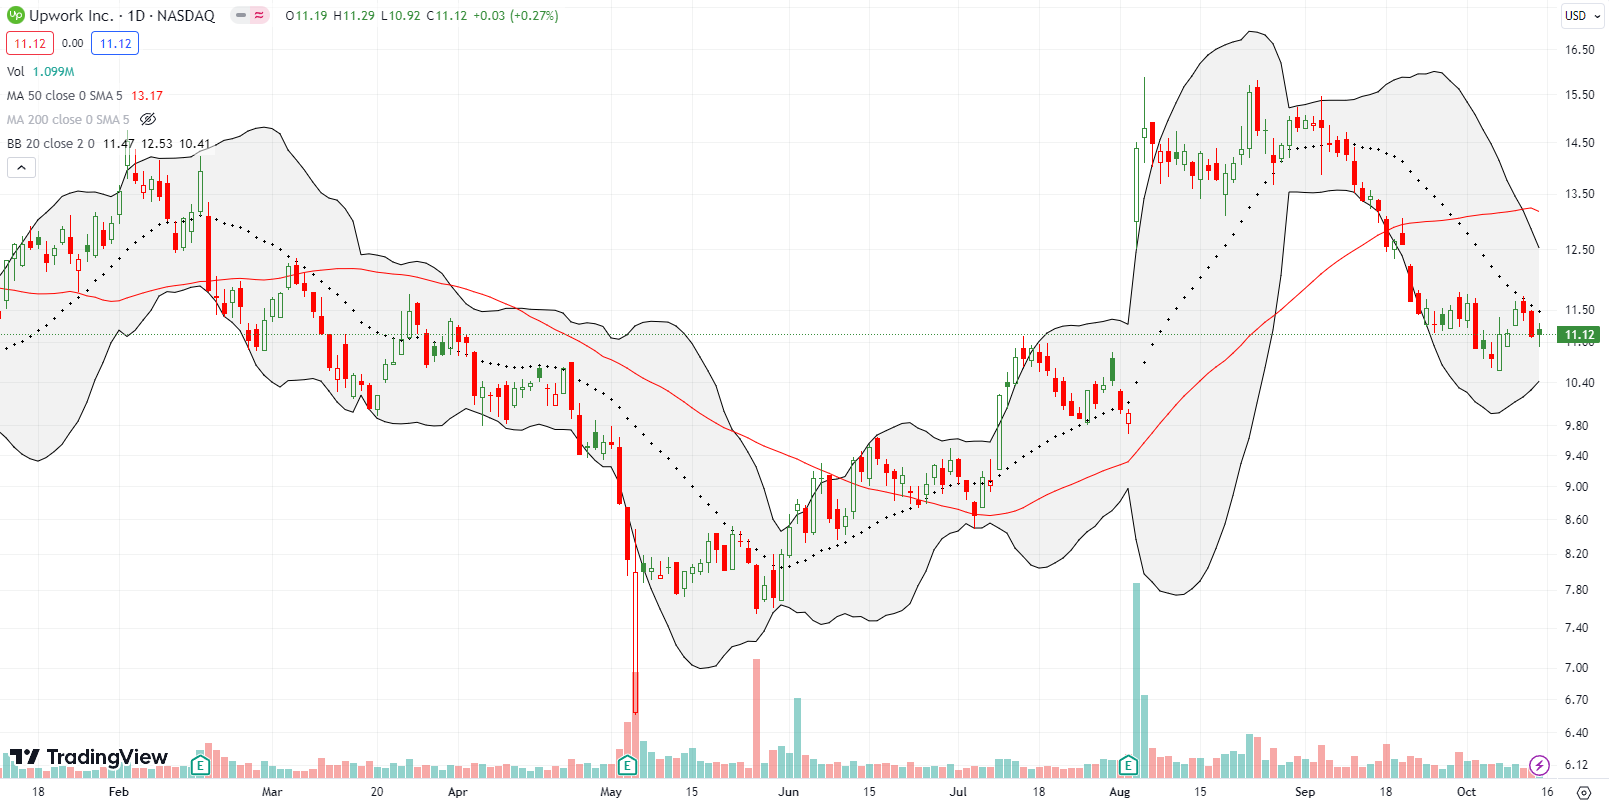
Upwork, Inc (UPWK), an online marketplace for gig workers, looked promising after a massive 44.2% post-earnings surge in August. That jump turned into fool’s gold after a last gasp of buying in mid-August. UPWK has now confirmed a 50DMA breakdown and 20DMA resistance. Since I am still a fan of Upwork, I treated this big pullback as an opportunity and bought shares at the end of September. I am prepared to hold these shares for a while and add to my holdings if all of August’s post-earnings gains disappear (depending on the news of course). Beyond that, I will assume I made a mistake!
A nascent Bollinger Band (BB) squeeze looks set to determine the next big move.
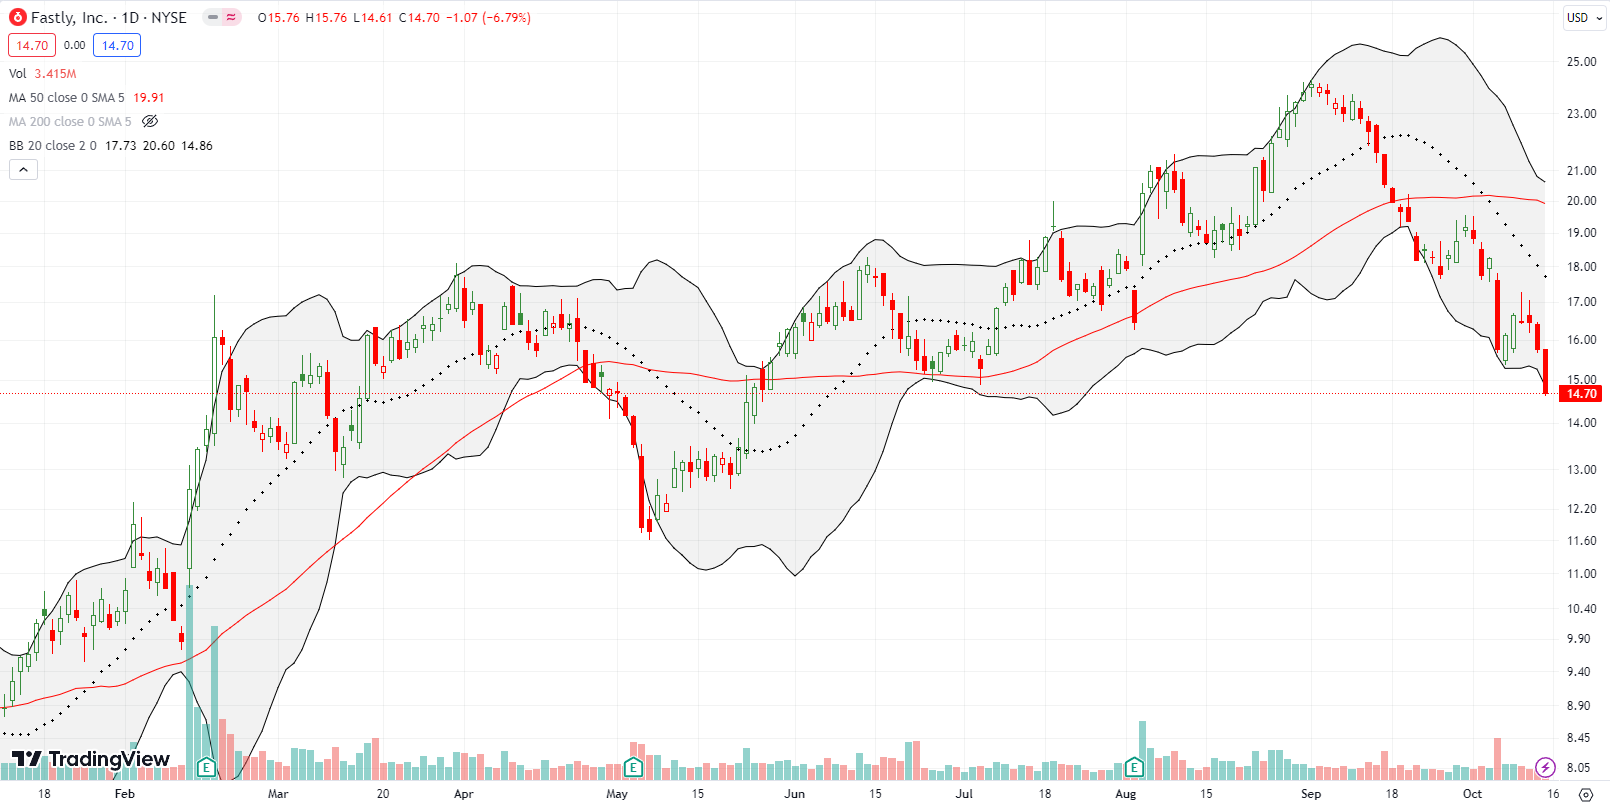
Fastly, Inc (FSLY) is another promising stock gone bad. FSLY gained 23.0% post-earnings in August, and buyers maintained the momentum for an entire month. The buyers all buy disappeared after September 1. They allowed sellers to reverse all the post-earnings gains and then some. FSLY is down 39.0% since the peak. The stock was last this low in late May and looks set to eventually retest the low from May. I guess the next earnings will reveal what has suddenly concerned investors…
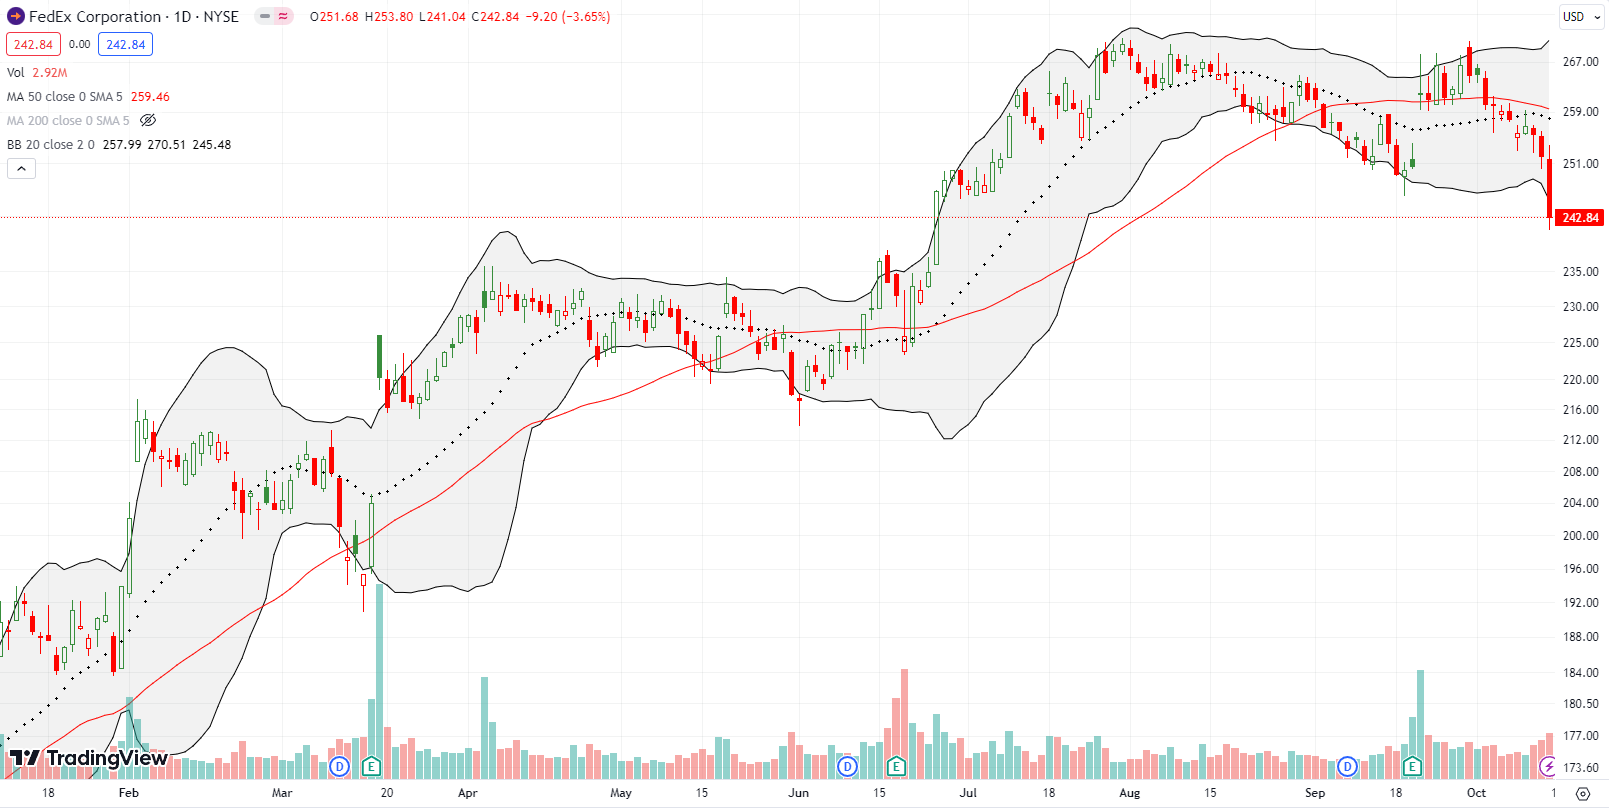
FedEx Corporation (FDX) is yet one more good-looking stock that has gone bad. This surprising slippage all but confirms for me that trouble abounds. I described my surprise at FDX’s post-earnings pop in the context of a bearish pre-earnings trade I had in place at the time. It seems the bearish technicals had a programmed delay. The post-earnings 50DMA breakout was a false signal. FDX lost 3.7% on Friday and closed at 4-month low. With its summer breakout almost entirely reversed (an all too common theme in the stock market now!), I placed a hedge bet on further big moves for FDX: a $250 strike call expiring on Friday and a $230/$240 put spread expiring in November.
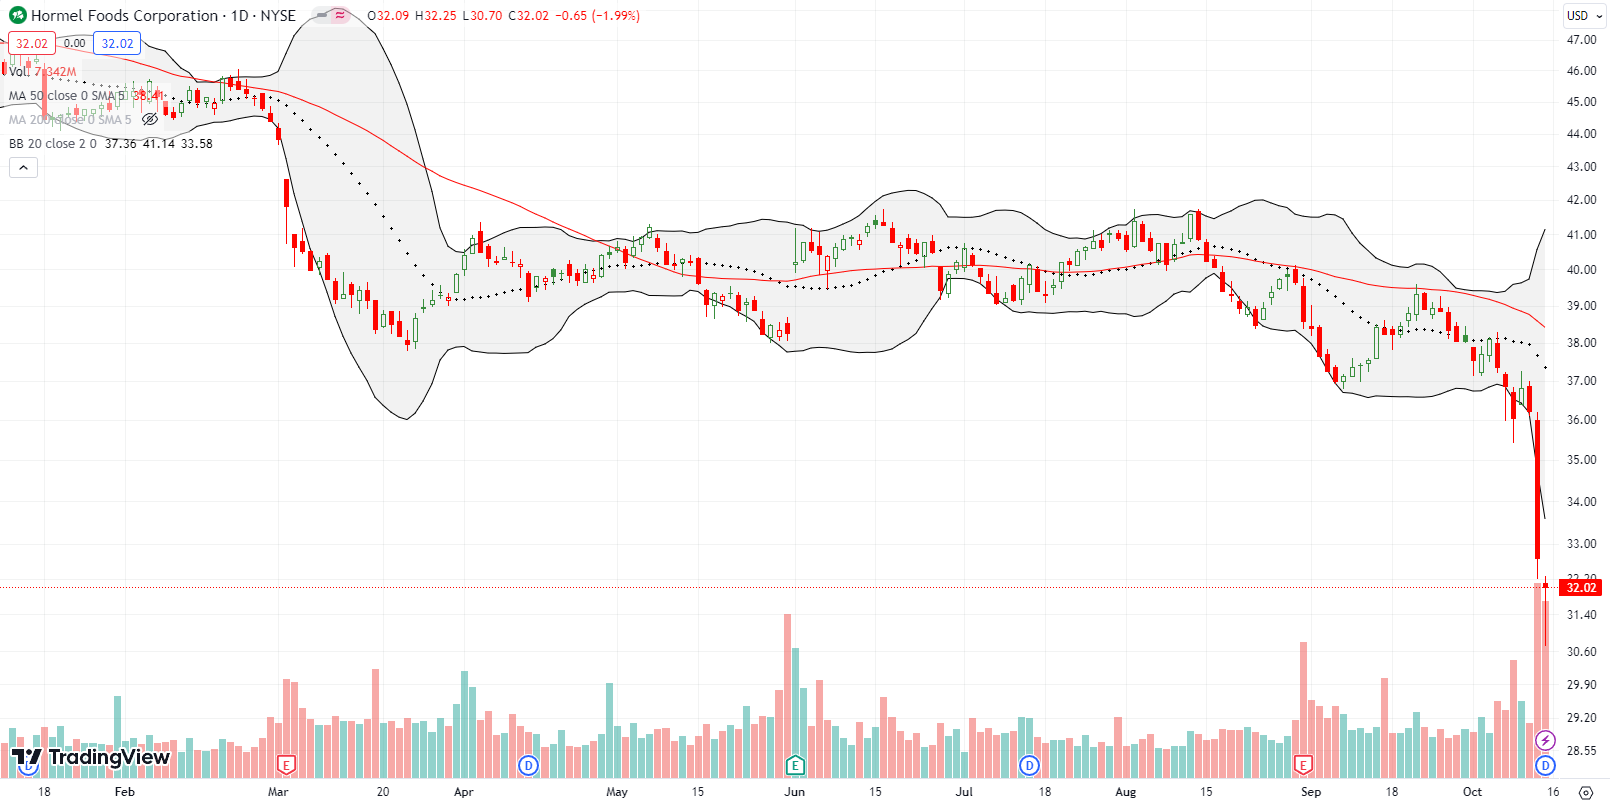
During the pandemic-drive panics about food shortages, I held out beans from Hormel Foods Corporation (HRL) as a better and more economic alternative to Beyond Meat (BYND) (see “Beans Over Beyond Meat“). Since then, BYND has completely collapsed to all-time lows and looks set to continue lower. In March, HRL finally fell out of bed as well. After 7 months of stabilization, HRL plunged last week to a near 6-year low. Wall Street swelled with angst over a union’s victory for higher wages and benefits for workers at Hormel. Needless to say I view this panic as an extreme reaction and a buying opportunity. However, there is also no need to rush with consumer-related stocks under so much pressure in recent months.
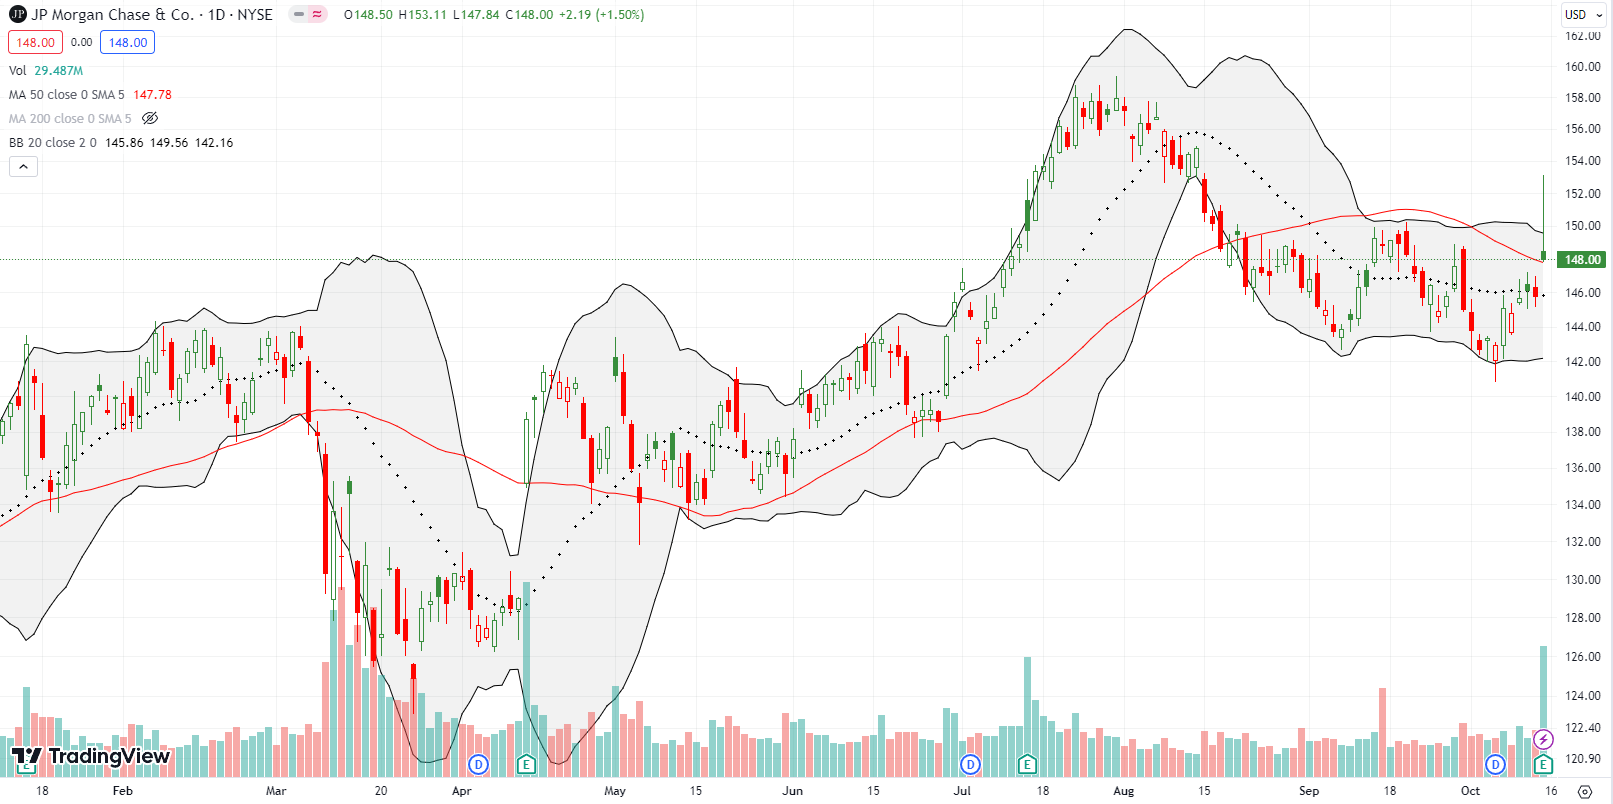
The day seemed to start with good news with a positive reaction to earnings from JP Morgan Chase & Co (JPM) despite Dimon’s dire global prognosis. The stock gap up and broke out above 50DMA resistance. Buyers quickly proceeded to take HRL well above its upper BB. Sellers promptly sold the stock back down to flat with the open. If sellers succeed in taking JPM under the 50DMA again, the alarms should turn on for financials in general. Trouble abounds!
Be careful out there!
Footnotes
Subscribe for free to get email notifications of future posts!
“Above the 50” (AT50) uses the percentage of stocks trading above their respective 50-day moving averages (DMAs) to measure breadth in the stock market. Breadth defines the distribution of participation in a rally or sell-off. As a result, AT50 identifies extremes in market sentiment that are likely to reverse. Above the 50 is my alternative name for “MMFI” which is a symbol TradingView.com and other chart vendors use for this breadth indicator. Learn more about AT50 on my Market Breadth Resource Page. AT200, or MMTH, measures the percentage of stocks trading above their respective 200DMAs.
Active AT50 (MMFI) periods: Day #6 over 20%, Day #19 under 30%, Day #29 under 40%, Day #43 under 50%, Day #48 under 60%, Day #51 under 70%
Source for charts unless otherwise noted: TradingView.com
Full disclosure: long IWM calls, long S&P 500 call, long FDX call and put spread, long UPWK
FOLLOW Dr. Duru’s commentary on financial markets via StockTwits, Twitter, and even Instagram!
*Charting notes: Stock prices are not adjusted for dividends. Candlestick charts use hollow bodies: open candles indicate a close higher than the open, filled candles indicate an open higher than the close.


