Stock Market Commentary
The Federal Reserve helped unlock the stalemate in pricing action that stalled the bearish divergence tugging the market toward oversold trading conditions. Fed Chair Jerome Powell once again told financial markets the Fed remains as hawkish as ever. Expectations contracted for rate cuts next year, interest rates soared, and stocks plunged. While stocks lost ground on the day of the Fed’s announcement, selling accelerated the next day, and the week closed out at the lows. Oversold trading awaits; I am actually surprised the selling failed to plunge the market into official oversold trading conditions.
The Stock Market Indices
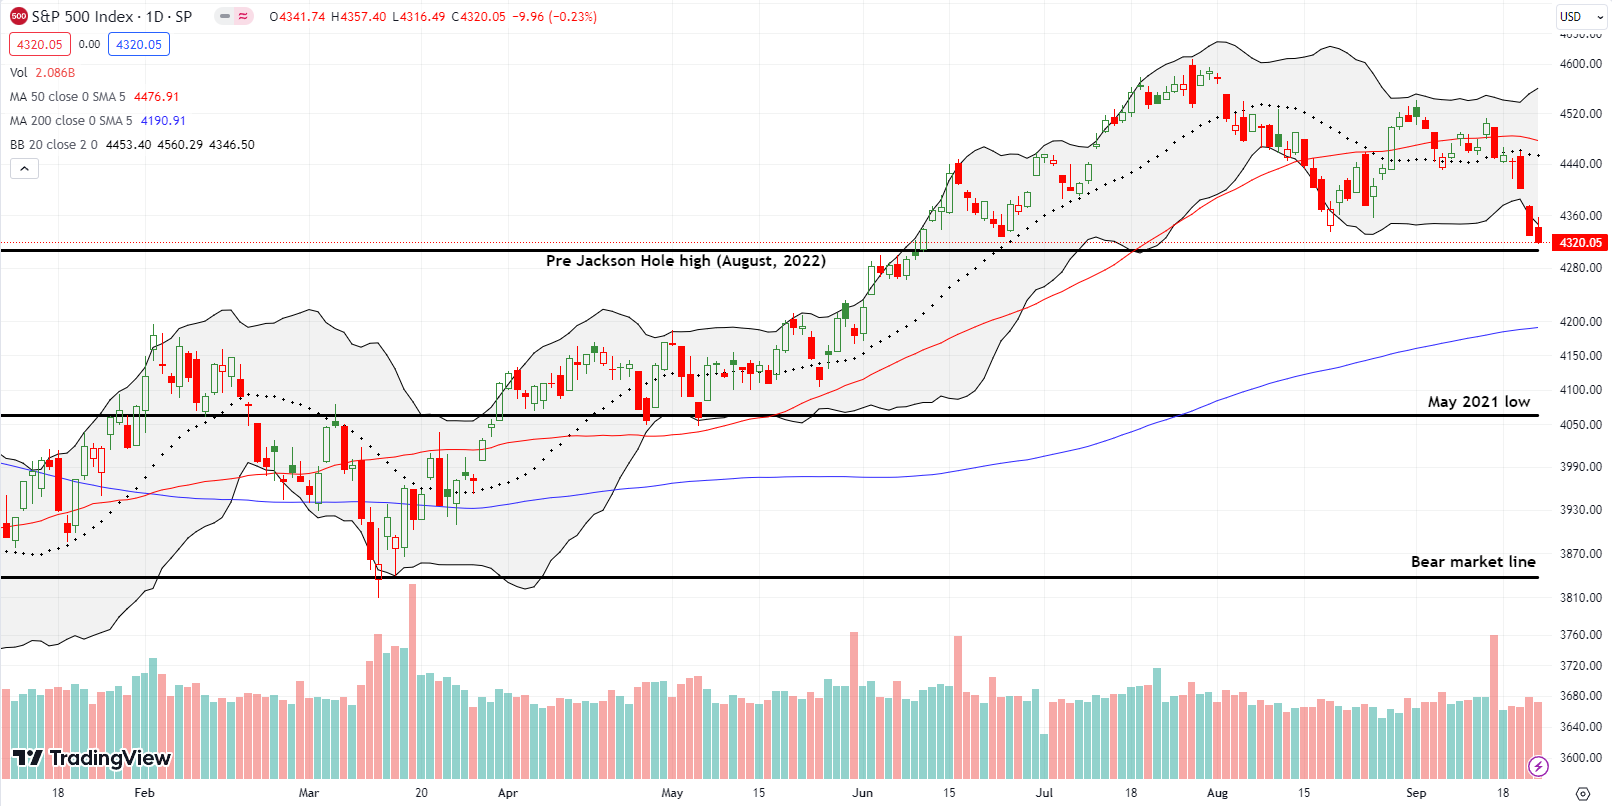
The S&P 500 (SPY) cracked the August lows (turning the late August rebound into a major fake-out) and nearly tested the pre Jackson Hole high from last year. This 3 1/2 month low has nearly reversed all the gains from the summer of love. That festive season only has a 2.7% gain left intact. The index is also down 4.2% for the month which provides a fresh reminder of the current season of the stock market’s most dangerous months of the year. This month’s drawdown is well beyond the average and median maximum drawdown for the month, so I am eager to buy as oversold trading awaits. The moment looms even larger given the convergence of so many technical signals and lines of support.
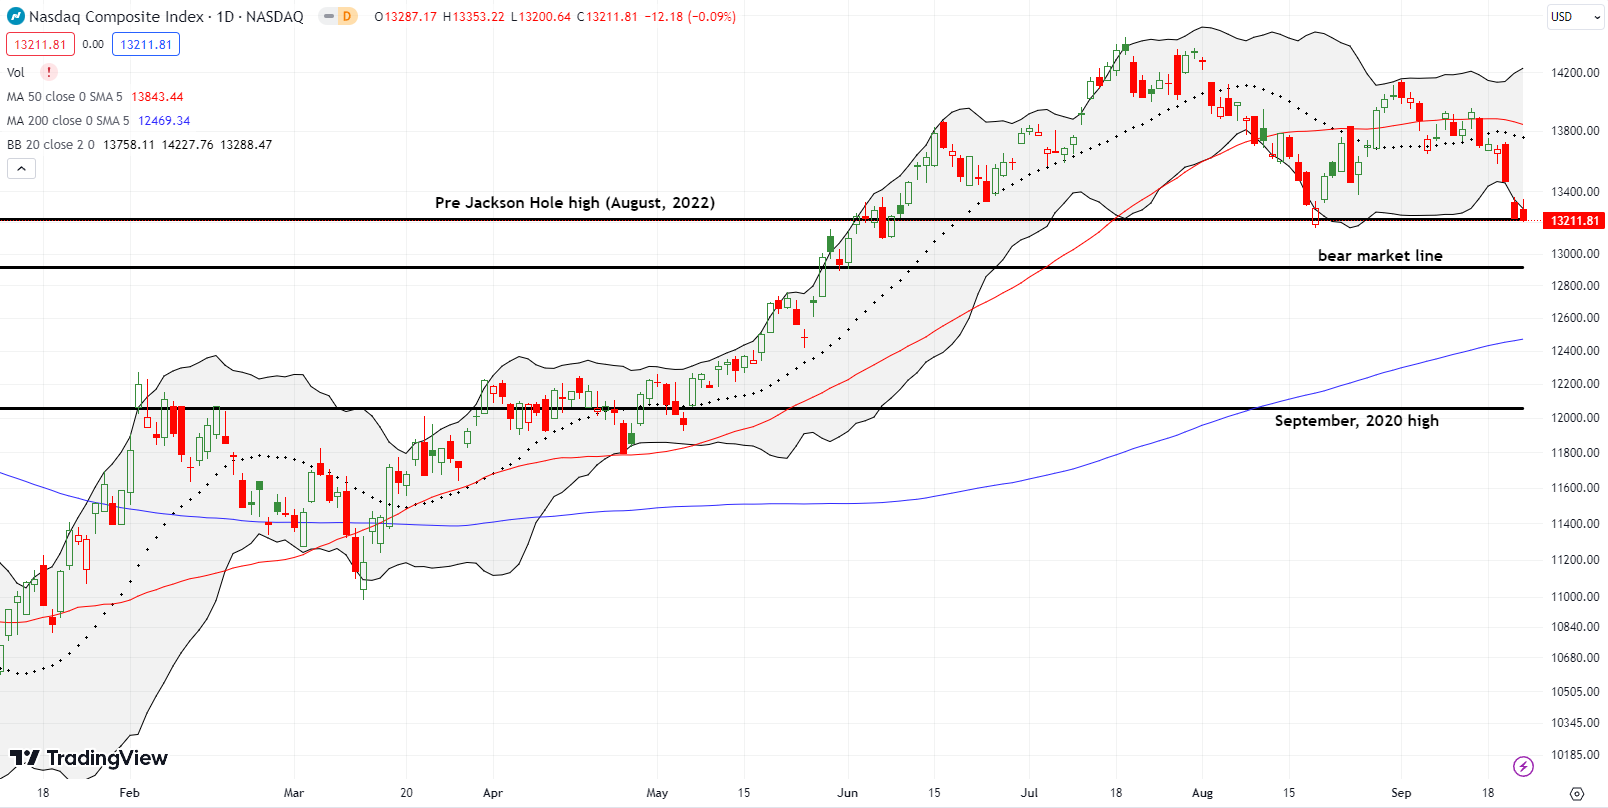
The NASDAQ (COMPQ) touched its pre Jackson Hole high from last year for the second time in two months. THIS time around, the tech laden index closed on top of this key line of support twice. The bear market line is now at stake for the NASDAQ.
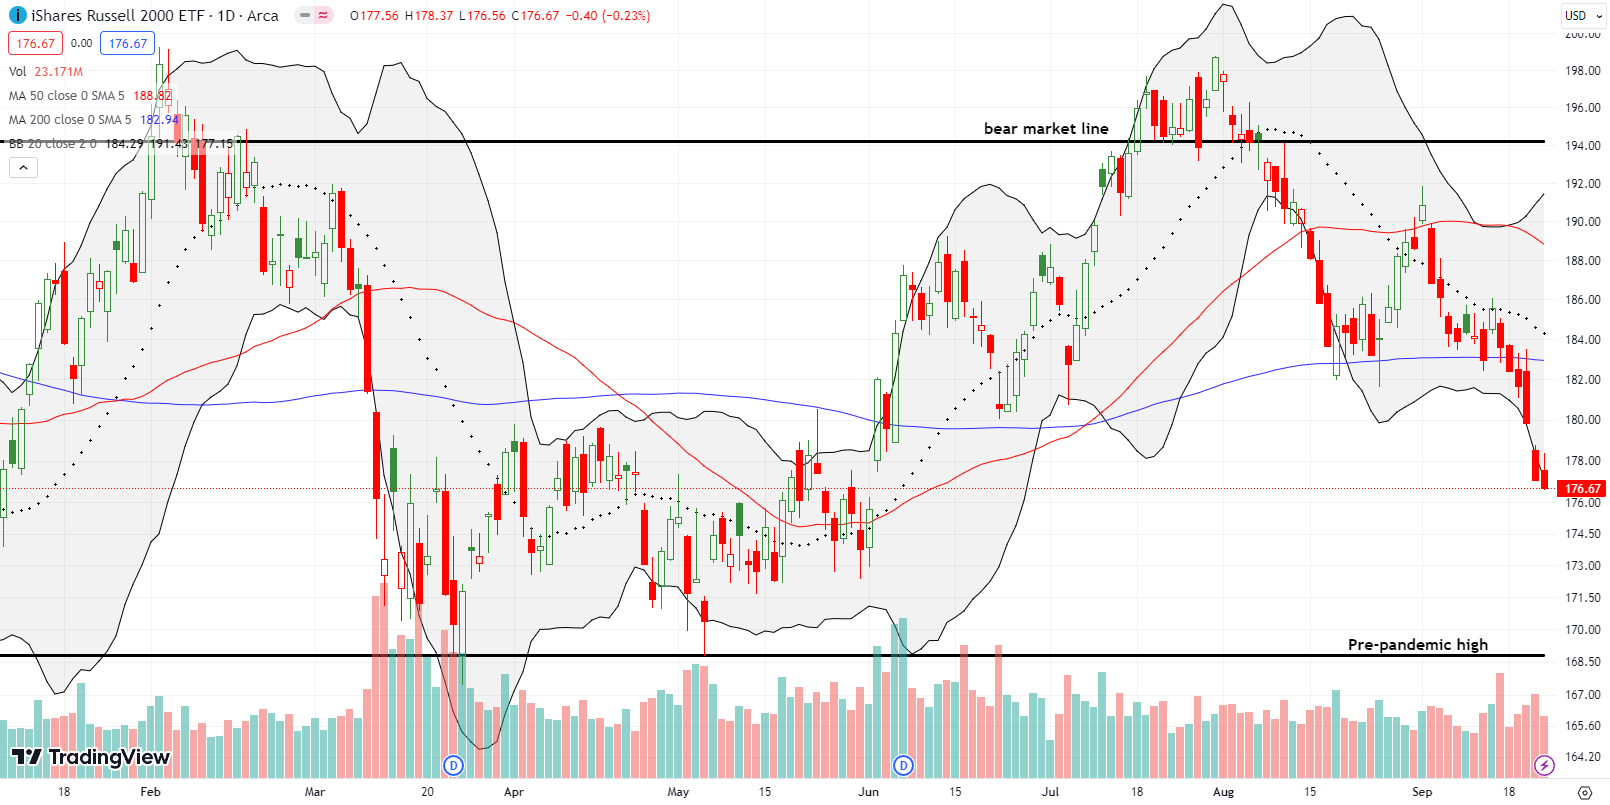
The iShares Russell 2000 ETF (IWM) continues its major underperformance. The ETF of small caps has reversed all its gains from the summer love and nearly filled a big gap up from June 2nd. IWM also confirmed a 200DMA breakdown. This ETF remains firmly entrenched in a bear market.
The Short-Term Trading Call While Oversold Trading Awaits
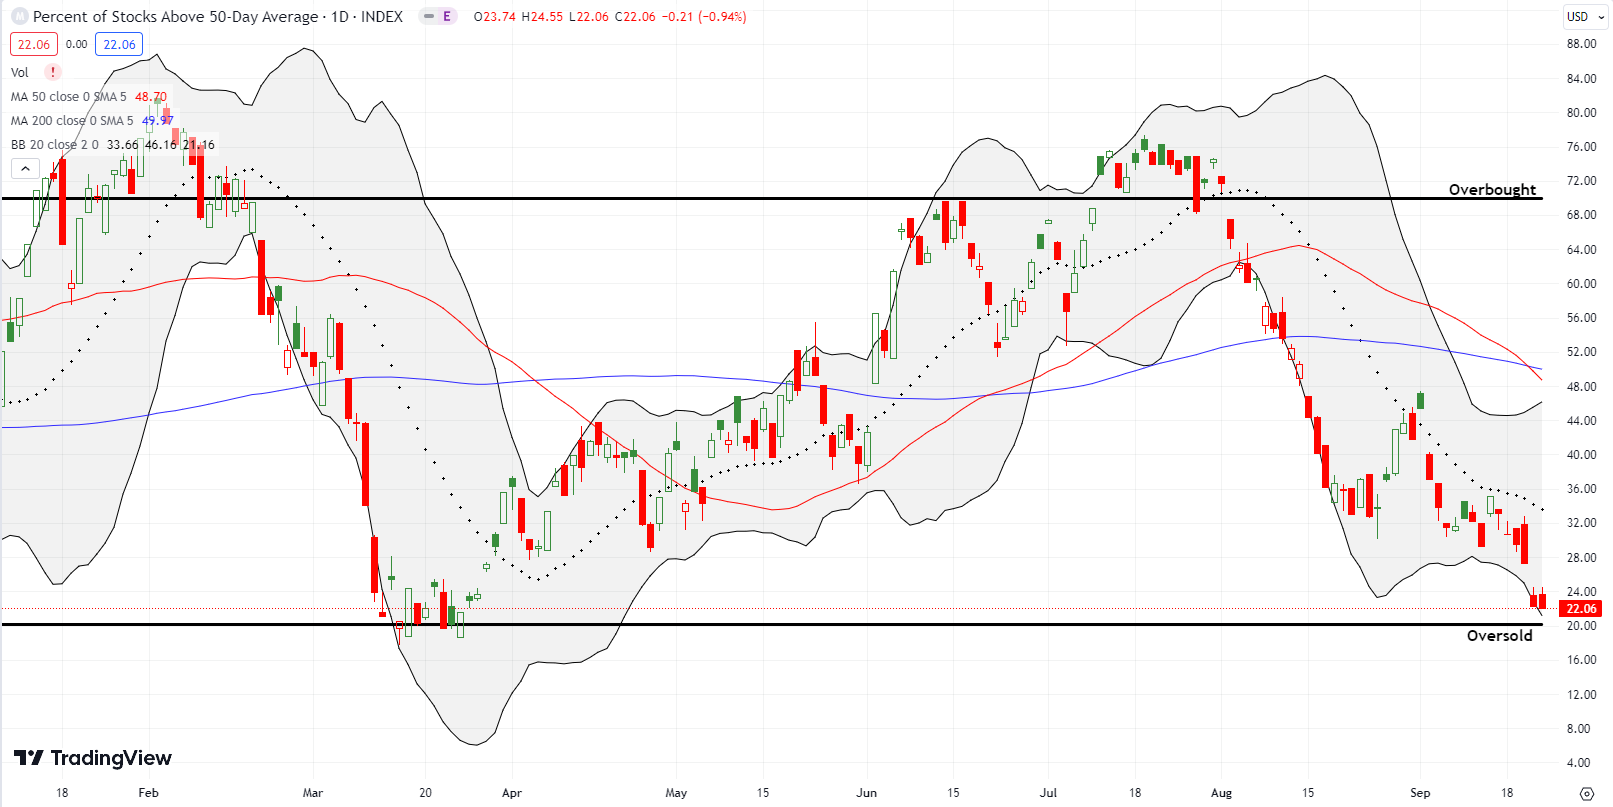
- AT50 (MMFI) = 22.1% of stocks are trading above their respective 50-day moving averages
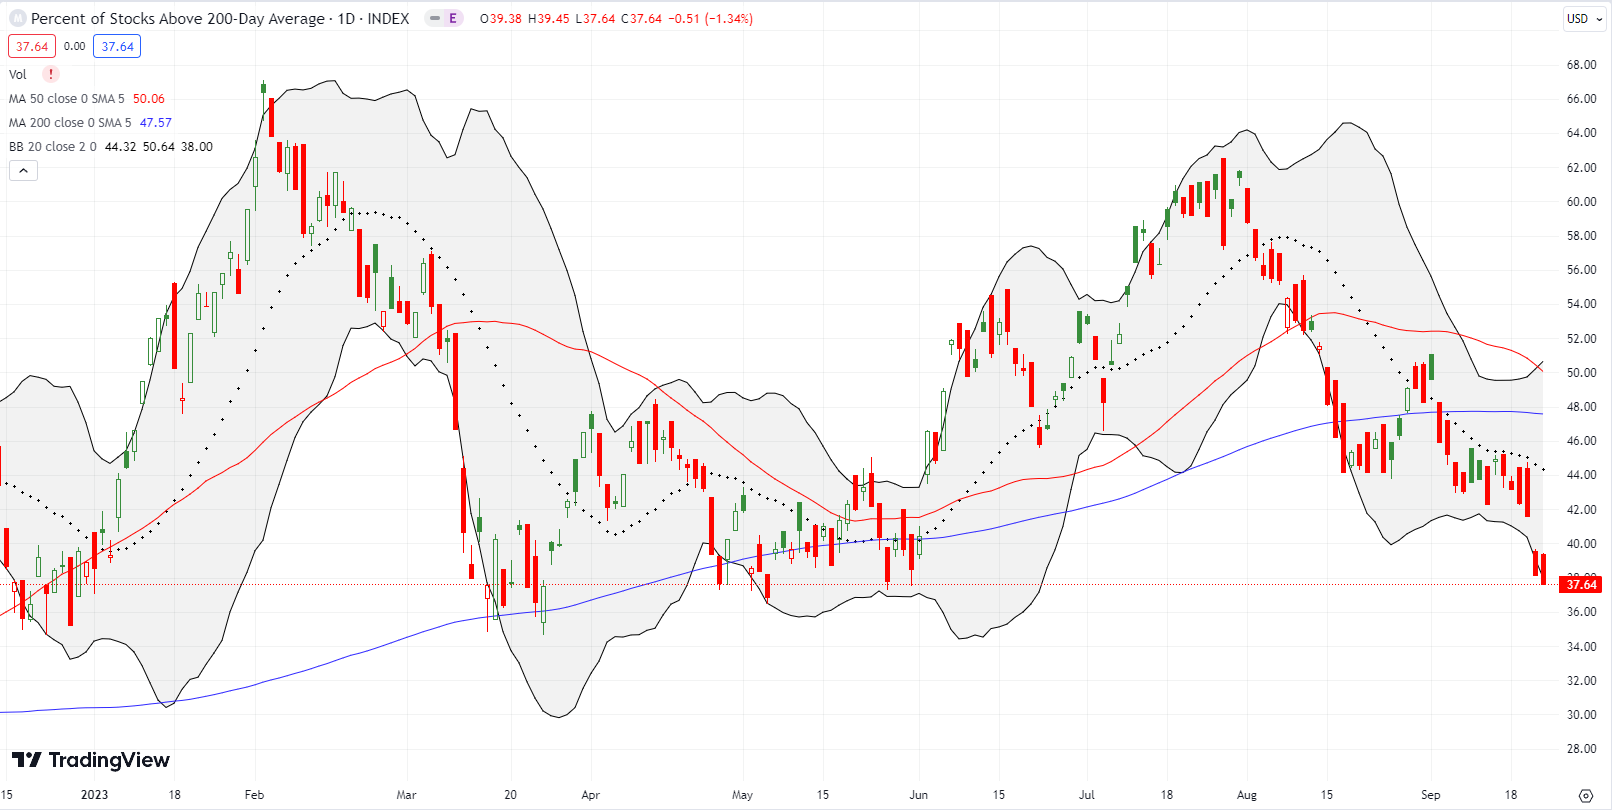
- AT200 (MMTH) = 37.6% of stocks are trading above their respective 200-day moving averages
- Short-term Trading Call: cautiously bullish
AT50 (MMFI), the percentage of stocks trading above their respective 50DMAs, closed the week just over two percentage points away from oversold trading. While oversold trading awaits, I am putting myself in the mentality of oversold trading by upgrading my short-term trading call to cautiously bullish. The trading call will go to bullish if/when my favorite technical indicator closes below the 20% oversold threshold. I am on alert for stocks holding support at their 50DMAs as potential first buys. I posted a video to explain this strategy with some “show and tell.”
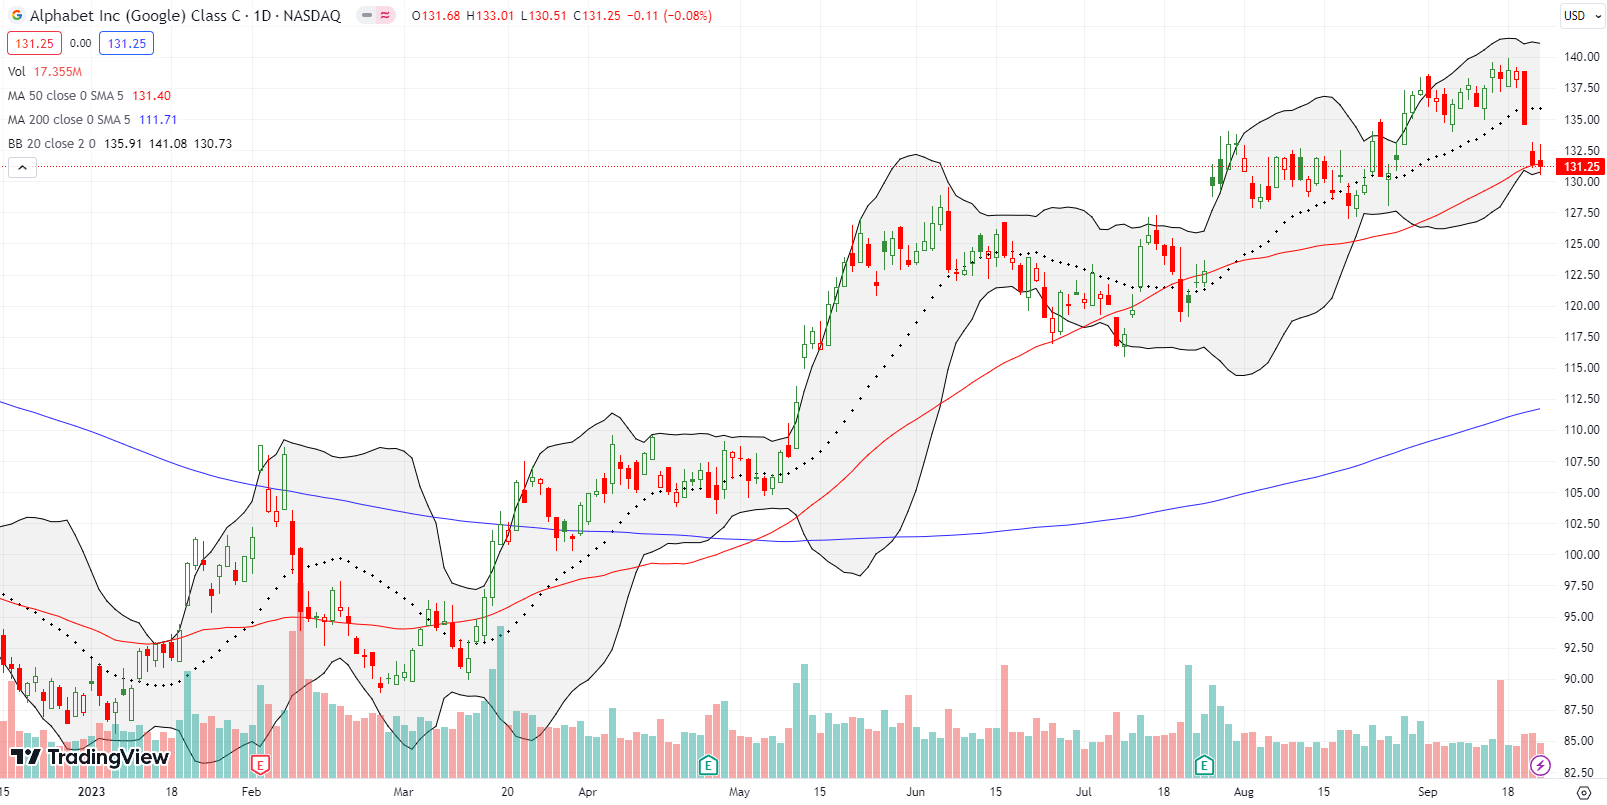
Alphabet Inc (GOOG) is of course part of my generative AI trade. I bought a weekly call spread as GOOG teetered on its 50DMA support. GOOG’s uptrend remains intact. This uptrend makes the stock an ideal candidate for playing a potential oversold bounce.
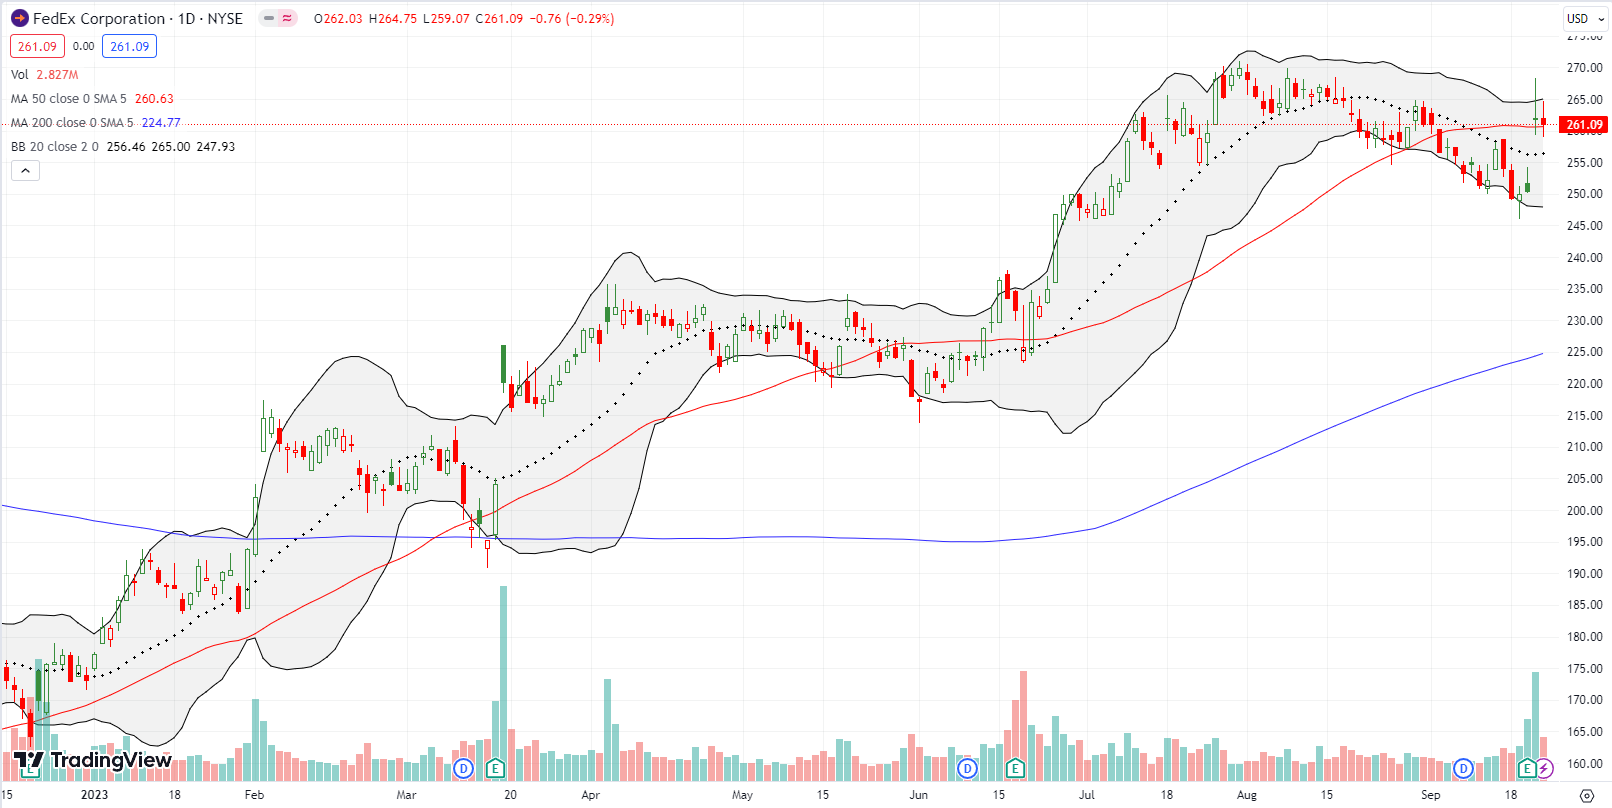
FedEx Corporation (FDX) is another candidate for a potential oversold bounce. To its advantage, FDX has a (surprising) post-earnings surge on a weak market day serving as a tailwind. I bought a calendar call spread in deference to the post-earnings intraday fade from the August highs. That fade indicates some hesitancy of buyers. FDX was actually one half of a two-part pre-earnings trade where I bet either FDX and/or Darden Restaurants (DRI) would sell off following earnings. DRI fell but not enough to compensate for the FDX loss.
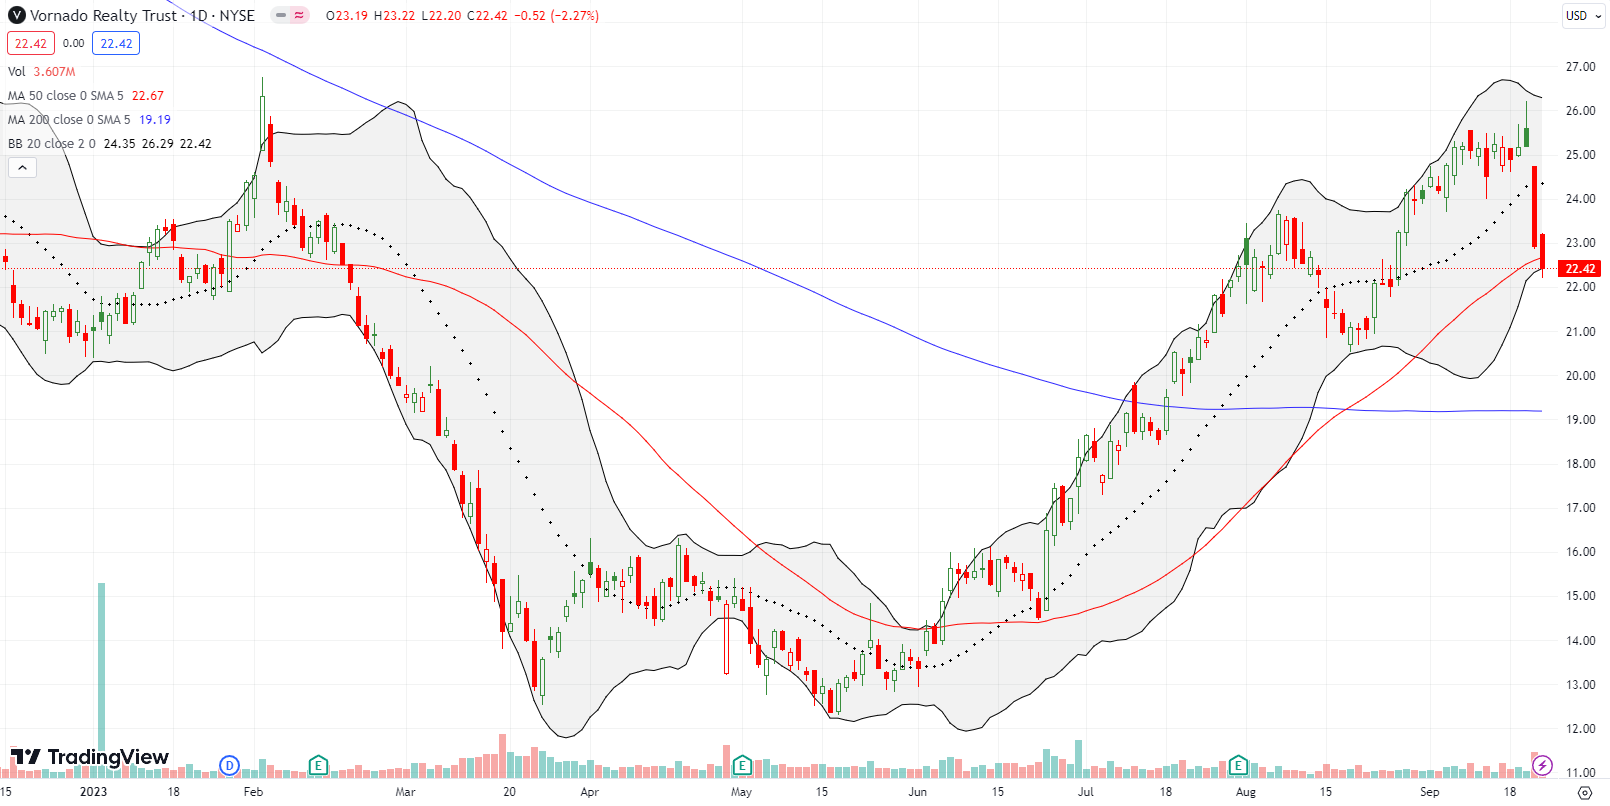
Vornado Realty Trust (VNO) ominously failed right at its 2023 high set in February. I noticed the failure too late to add to my refreshed put option position. Commercial real estate remains in a shaky position (for example, see Alexandria Real Estate Equities: The Wrong Kind of Overcrowded), so VNO is NOT a stock I am looking to buy around the 50DMA.
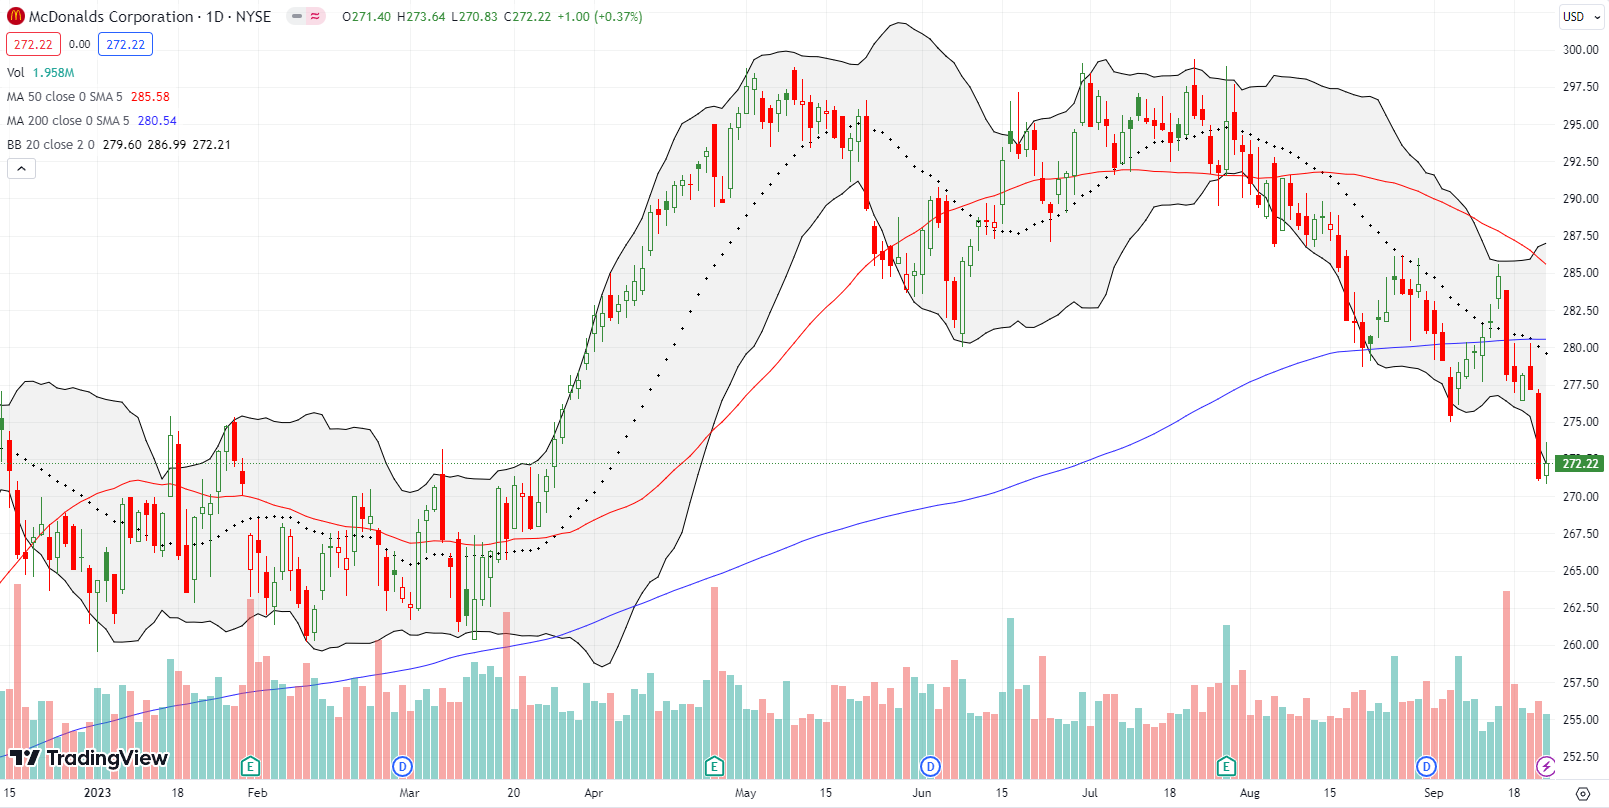
McDonalds Corporation (MCD) confirmed a 200DMA breakdown and finished reversing its March, 2023 breakout. MCD is one of the consumer discretionary stocks I bet against earlier this month. With an October put spread I was able to patiently wait out the relief rally (aka “dead cat bounce”) from the earlier confirmed 200DMA breakdown. I was expecting to close out the position on Friday with continued selling pressure. While oversold trading awaits, I will likely take profits on this position in the coming week.
Be careful out there!
Footnotes
Subscribe for free to get email notifications of future posts!
“Above the 50” (AT50) uses the percentage of stocks trading above their respective 50-day moving averages (DMAs) to measure breadth in the stock market. Breadth defines the distribution of participation in a rally or sell-off. As a result, AT50 identifies extremes in market sentiment that are likely to reverse. Above the 50 is my alternative name for “MMFI” which is a symbol TradingView.com and other chart vendors use for this breadth indicator. Learn more about AT50 on my Market Breadth Resource Page. AT200, or MMTH, measures the percentage of stocks trading above their respective 200DMAs.
Active AT50 (MMFI) periods: Day #93 over 20%, Day #4 under 30%, Day #14 under 40%, Day #28 under 50%, Day #33 under 60%, Day #36 under 70%
Source for charts unless otherwise noted: TradingView.com
Full disclosure: long IWM call, long GOOG call spread, long VNO put spread, long MCD put spread, long FDX put spread and calendar call spread
FOLLOW Dr. Duru’s commentary on financial markets via StockTwits, Twitter, and even Instagram!
*Charting notes: Stock prices are not adjusted for dividends. Candlestick charts use hollow bodies: open candles indicate a close higher than the open, filled candles indicate an open higher than the close.


