Fades Press On Market Supports Ahead of the Election – The Market Breadth

fade (Credit: Hercules Wrestling the Bull by carfull...from Wyoming on Flickr)

Stock Market Commentary Fades were on display, especially on Thursday, as the stock market showed signs of exhaustion. Bad news in and for the semiconductor industry seemed to motivate sellers. For example, earnings for Microsoft (MSFT) and Meta Platforms (META) seemed to release some steam on hyped expectations for the AI chips both companies will … Read more

Did NVIDIA’s Earnings Surge to All-Time Highs Trigger Stock Market Exhaustion? – The Market Breadth

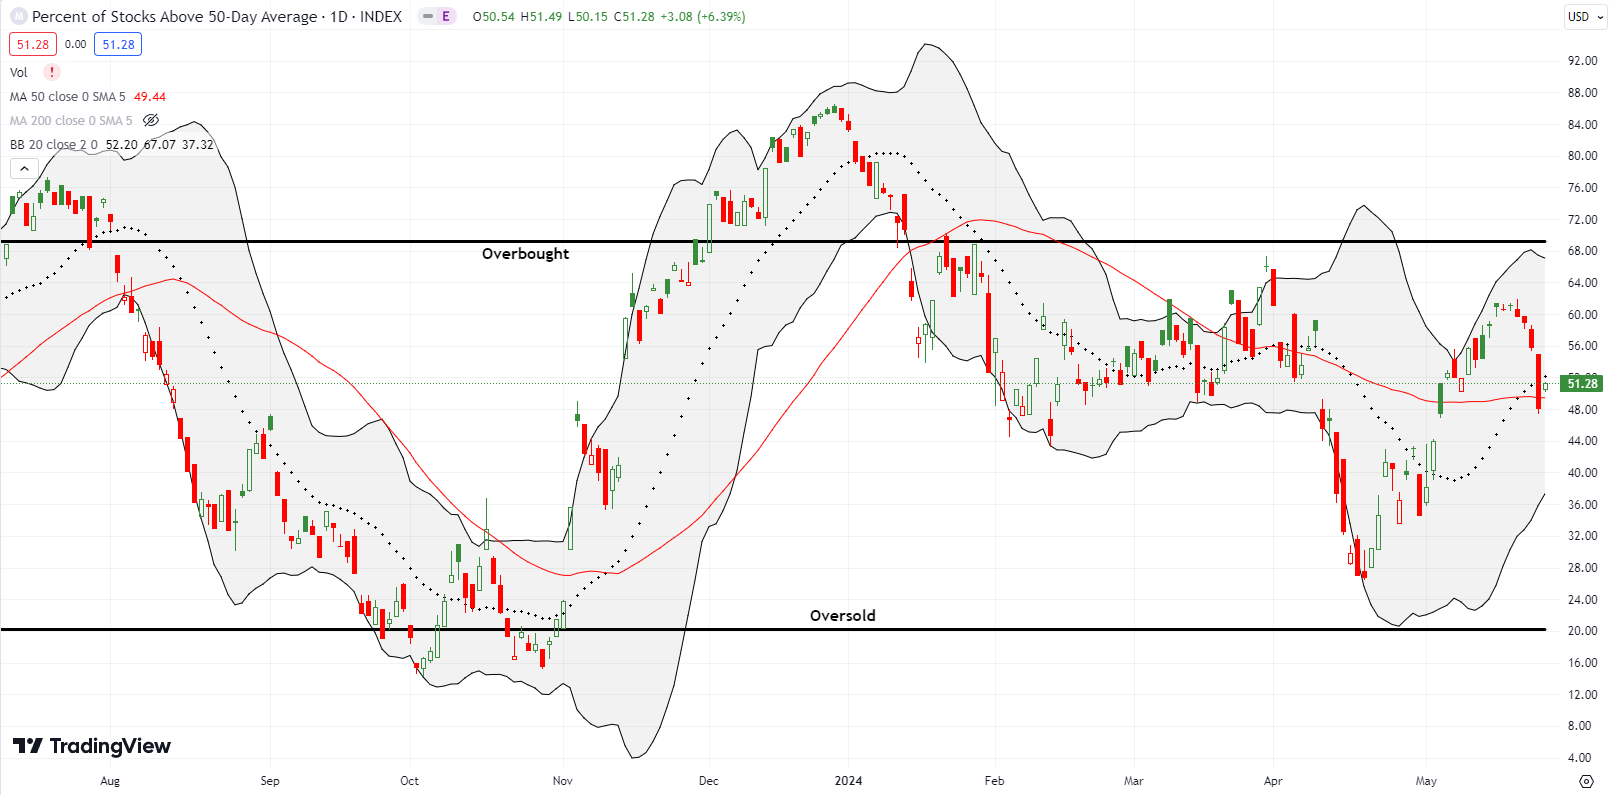
AT50 (MMFI) reversed almost half its gains from May after falling short of the overbought threshold.

Stock Market Commentary I looked to last week’s earnings from NVIDIA Corporation (NVDA) with great anticipation. The indices gathered momentum with all-time highs and seemed to point to a big moment for NVDA. NVDA did indeed have a big moment, but it helped precious few. In fact, NVDA’s gain looked like a net loss. Buyer’s … Read more

Weakness Lingers As the Oversold Rebound Cools – The Market Breadth (July 30, 2021)

Stock Market Commentary Welcome to the new world of “The Market Breadth.” I used the switch from AT40 (T2108) to AT50 (MMFI) as my market breadth indicator to improve the name of this blog series. The Market Breadth marks a change from a technical name that sounds like a Space X rocket to an English … Read more

Above the 40 (October 19, 2018) – Swirling Signals from 200DMA Drama And Bearish Breakdowns

AT40 = 16.3% of stocks are trading above their respective 40-day moving averages (DMAs) – 3rd day of oversold period following 4-day oversold period AT200 = 33.6% of stocks are trading above their respective 200DMAs VIX = 19.9 Short-term Trading Call: bullish Commentary Friday was a day with a head-spinning mix of reassuring and ominous … Read more

Above the 40 (August 17, 2018) – Another Picture-Perfect Rebound Ends Stretched Conditions

AT40 = 55.4% of stocks are trading above their respective 40-day moving averages (DMAs) AT200 = 56.7% of stocks are trading above their respective 200DMAs VIX = 12.6 Short-term Trading Call: neutral Commentary The recovery from the February swoon has been full of nearly predictable bounces: whether it was oversold trading conditions or support at … Read more

Above the 40 (August 15, 2017) – The Retail Wreck Runs Over Strong Data

AT40 = 39.5% of stocks are trading above their respective 40-day moving averages (DMAs) AT200 = 50.4% of stocks are trading above their respective 200DMAs VIX = 12.0 Short-term Trading Call: bullish Commentary Urban Outfitters (URBN) notwithstanding with its 19.5% after hours surge, Tuesday, August 15, 2017 was a signature day for the weakness engulfing … Read more

T2108 Update (December 30, 2016) – From a Roar to Caution: The S&P 500 Tentatively Steps Toward 2017

(T2108 measures the percentage of stocks trading above their respective 40-day moving averages [DMAs]. It helps to identify extremes in market sentiment that are likely to reverse. To learn more about it, see my T2108 Resource Page. You can follow real-time T2108 commentary on twitter using the #T2108 hashtag. T2108-related trades and other trades are … Read more

T2108 Update (November 16, 2016) – A 5-Day Backup Under All-Time Highs for the S&P 500

(T2108 measures the percentage of stocks trading above their respective 40-day moving averages [DMAs]. It helps to identify extremes in market sentiment that are likely to reverse. To learn more about it, see my T2108 Resource Page. You can follow real-time T2108 commentary on twitter using the #T2108 hashtag. T2108-related trades and other trades are … Read more