A Concerning Set of Signals: Gold, Silver, Bonds, and Currencies

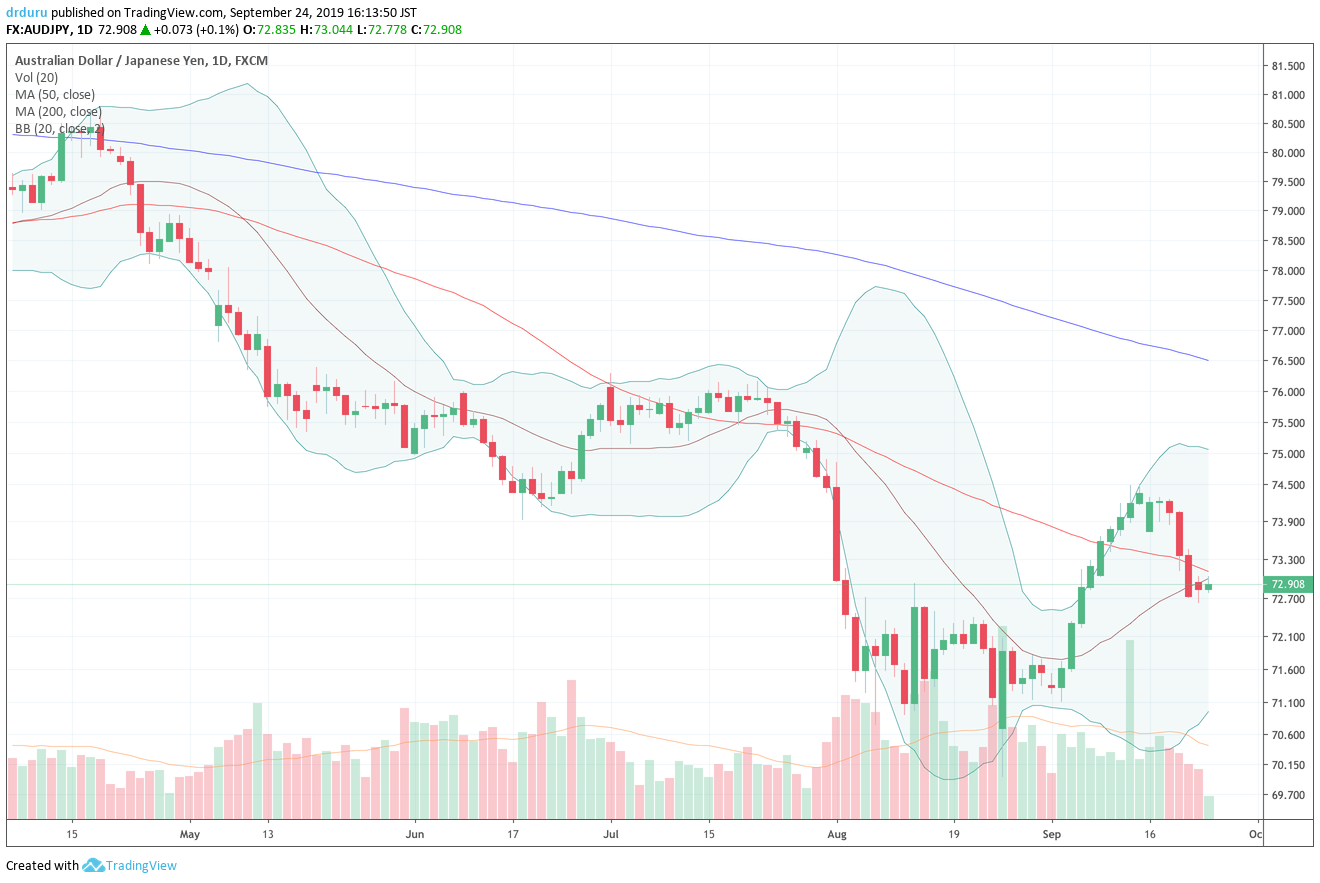
The Australian dollar vs Japanese yen (AUD/JPY) enjoyed just a brief 50DMA breakout and now looks poised to retest recent lows.

The economic data continue to worsen in Europe. While it is difficult to find signs of concern in U.S. markets, wariness is etched in a few key corners of financial markets. Precious Signals Notably, the precious metals gold and silver look ready for a fresh upward push. Gold and silver can perform well in times … Read more

From Loitering to Breakout: Stocks Look for Bad News Worthy of Rate Cuts – Above the 40 (June 21, 2019)

AT40 = 53.7% of stocks are trading above their respective 40-day moving averages (DMAs) AT200 = 50.3% of stocks are trading above their respective 200DMAsVIX = 15.4Short-term Trading Call: neutral Stock Market Commentary The stock market is officially in bizarro world. The stock market is breathlessly rallying in anticipation of rate cuts that will come … Read more

Above the 40 (February 19, 2019) – An Extended Overbought Rally In Slow Motion

AT40 = 88.1% of stocks are trading above their respective 40-day moving averages (DMAs) (17th overbought day)AT200 = 45.9% of stocks are trading above their respective 200DMAs (4-month high that effectively reverses the October, 2018 breakdown)VIX = 14.9Short-term Trading Call: neutral Stock Market Commentary AT40 (T2108), the percentage of stocks trading above their respective 40DMAs, … Read more

Above the 40 (January 25, 2019) – Stock Market Completes A 1-Week Roundtrip Back to Overbought

AT40 = 76.4% of stocks are trading above their respective 40-day moving averages (DMAs) (1st overbought day)AT200 = 28.7% of stocks are trading above their respective 200DMAs (near 2-month high)VIX = 17.4Short-term Trading Call: neutral Commentary It was just a week ago when the stock market surged to overbought levels in a bullish move. AT40 … Read more

Above the 40 (December 26, 2018) – Oversold Chronicles: Stock Market Delivers Major Reprieve for the Post-Trump Reversal

AT40 = 6.5% of stocks are trading above their respective 40-day moving averages (DMAs) (oversold day #8)AT200 = 11.0% of stocks are trading above their respective 200DMAsVIX = 30.4 (down 15.7%)Short-term Trading Call: bullish Commentary Pick your favorite catalyst or explanation. I am sure there is good news (or the absence of bad news) out … Read more

Above the 40 (December 20, 2018) – Oversold Chronicles: Small-Caps Tumble Toward A Post-Election Reversal

AT40 = 9.4% of stocks are trading above their respective 40-day moving averages (DMAs) (oversold day #5, 35-month low!)AT200 = 12.8% of stocks are trading above their respective 200DMAs (new 34-month low)VIX = 28.4 (10-month high, intraday high at 30.3)Short-term Trading Call: bullish (caveats below!) Commentary The plunge continues. AT40 (T2108), the percentage of stocks … Read more

Above the 40 (October 11, 2018) – Oversold Conditions Deepen In the Stock Market As Breakdowns Worsen

AT40 = 11.2% of stocks are trading above their respective 40-day moving averages (DMAs) (oversold day #2) AT200 = 31.7% of stocks are trading above their respective 200DMAs () VIX = 23.0 (an increase of 44.0%) Short-term Trading Call: bullish Commentary The market sell-off is unfolding quickly. AT40 (T2108), the percentage of stocks trading above … Read more

A Gold Bottom But Will the U.S. Dollar Cooperate?

Gold, and by extension the SPDR Gold Shares (GLD), has had a rough year. However, based on a historic flip in speculative positioning in gold futures, a bottom is likely in for GLD. According to the tweet and chart below, the net speculative positioning in gold recently went net negative for the first time in … Read more

Above the 40 (June 15, 2018) – A News-Packed Week Hands Victory to Stock Market Bulls and Bears

AT40 = 64.0% of stocks are trading above their respective 40-day moving averages (DMAs) AT200 = 54.8% of stocks are trading above their respective 200DMAs (a 4-month high) VIX = 12.0 Short-term Trading Call: bearish Commentary Once again, a tried and true bearish signal delivered. However this success came with a tremendous caveat: a simultaneously … Read more

A Fresh Top in Cocoa

It did not take long. Two days after I identified a Bollinger Band squeeze on iPath Bloomberg Cocoa SubTR ETN (NIB), the technical chart pattern resolved to the downside. NIB has lost 11.9% over this time. Source: FreeStockCharts.com At current levels, NIB has confirmed a top from its 19-month high: a breakdown below the 50-day … Read more