Stock Market Commentary:
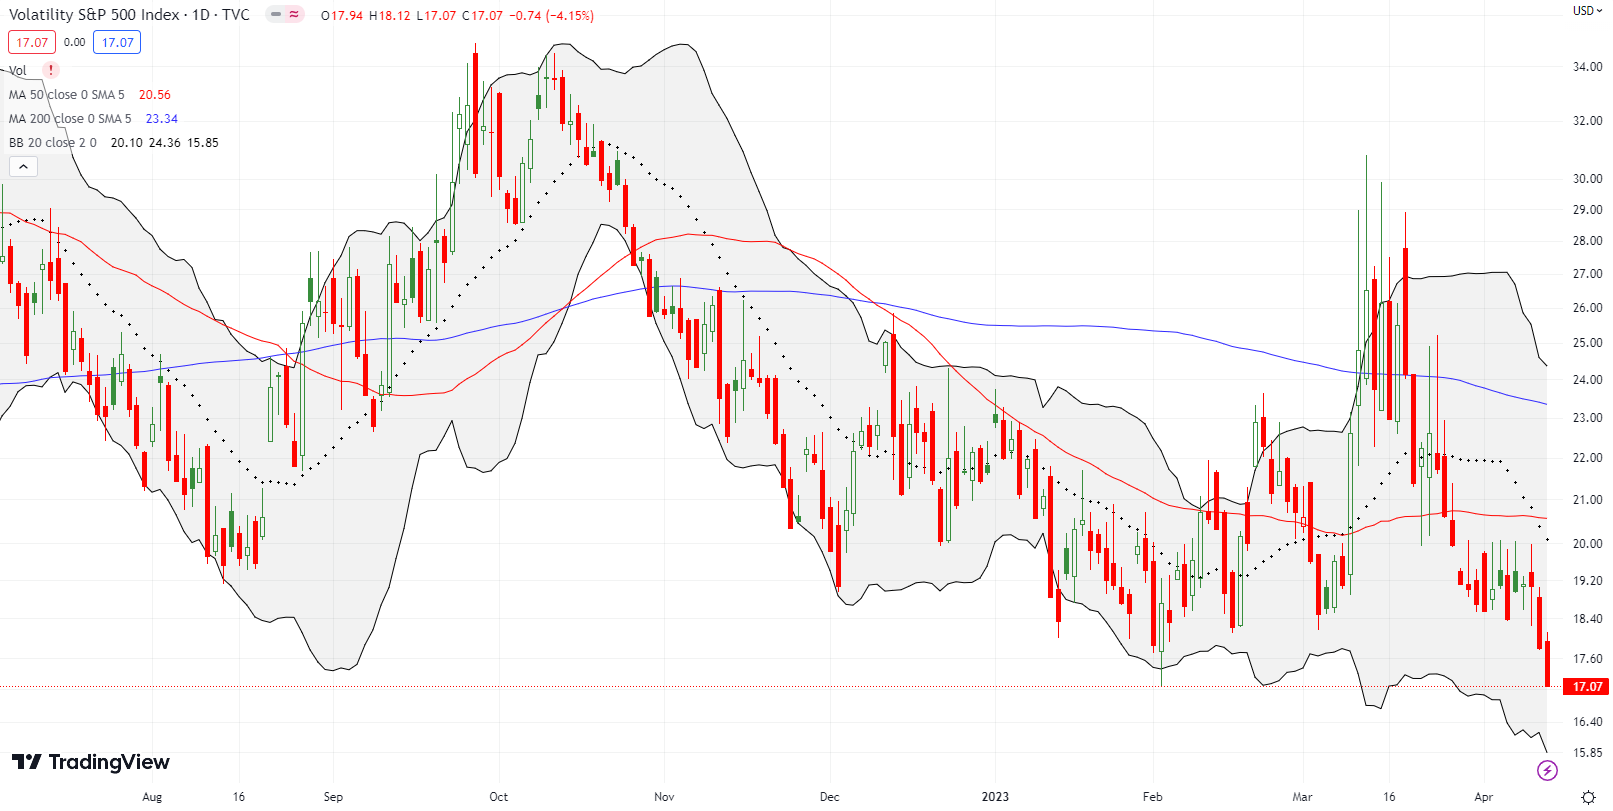
Last week I described how to reconcile a stock market that was both complacent and oversold. The stock market proceeded from there to double down on complacency while rebounding from “close enough to oversold” levels for market breadth. Traders are showing no worries as the volatility index (VIX) plunged to levels last seen on the first trading day of 2022. While the major indices have are nowhere close to reversing losses from 2022, the VIX’s reversal suggests that the path of least resistance points upward. Overhead resistance levels look like speed bumps for traders and investors looking forward to the day when the Fed pivots from monetary tightening to rate cuts (Fed fund futures currently anticipate the first rate cut in September).
Inflation data sits at the center of the market’s expectations for monetary policy. The inflation data were mixed last week, and the market had mixed responses. On Wednesday, core CPI met expectations, but represented slightly hotter inflation than the previous CPI report. The stock market went from a small gap up to a loss by the close. Buyers quickly regained cheer on slightly weaker than expected inflation readings from the March Producer Price Index (PPI). Since producer prices sit upstream from final goods prices, PPI can be a leading indicator of future prices. Of course, companies are free to absorb price relief into margins in an overall inflationary environment. The week ended with buyers disappointed by a surprising surge in consumer expectations for inflation next year. The University of Michigan’s surveys of consumers showed a jump from 3.6% to 4.6%. I expect people and markets these days to care more about inflation expectations that support lower future inflation, so I was surprised by the relatively strong response to this news. Regardless, it is very possible rising gas prices are rekindling inflation expectations.
The path from here to wherever the economy is going is a zig zag with plenty of false and confirming signals. The journey for stocks aligns with that crooked path. The recent expression of “no worries” adds a fresh wrinkle to complicate trading in this environment.
The Stock Market Indices
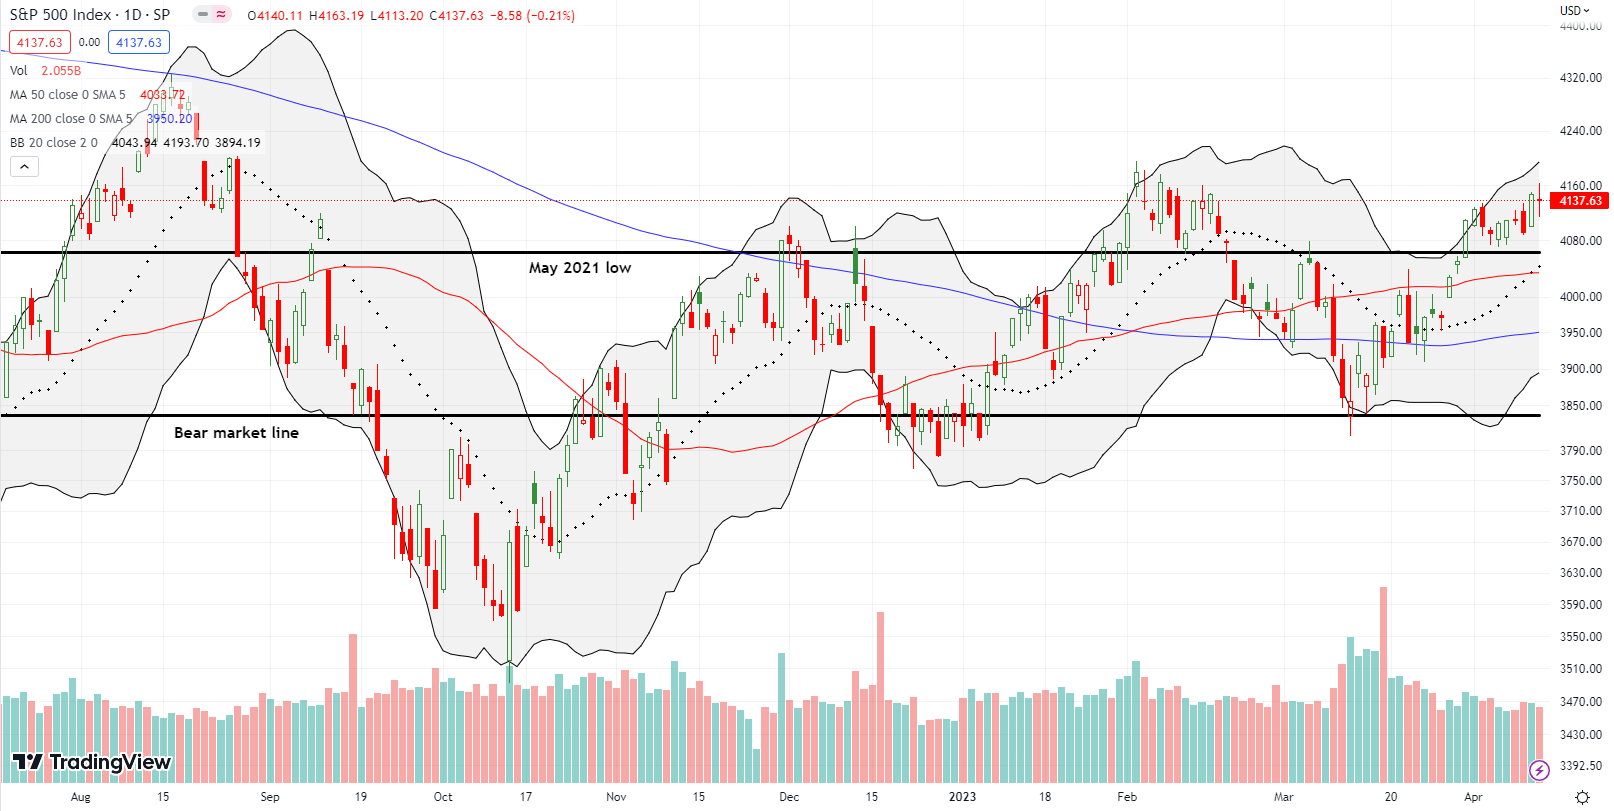
The S&P 500 (SPY) is melting upward ever so slightly. Thursday’s 1.3% gain was the big hopeful push as the market bravely faced down the launch of earnings reports from the big banks. Buyers were active through the entire day. So, putting inflation drama aside, I was surprised that Friday delivered no follow-through given the financials rallied strongly post-earnings. In fact, the S&P 500 faded away from challenging the highs of the year. A breakout above that high would invalidate my standing assumption that the S&P 500 has already seen its highs perhaps for the year. The next key resistance awaits at the August, 2022 high.
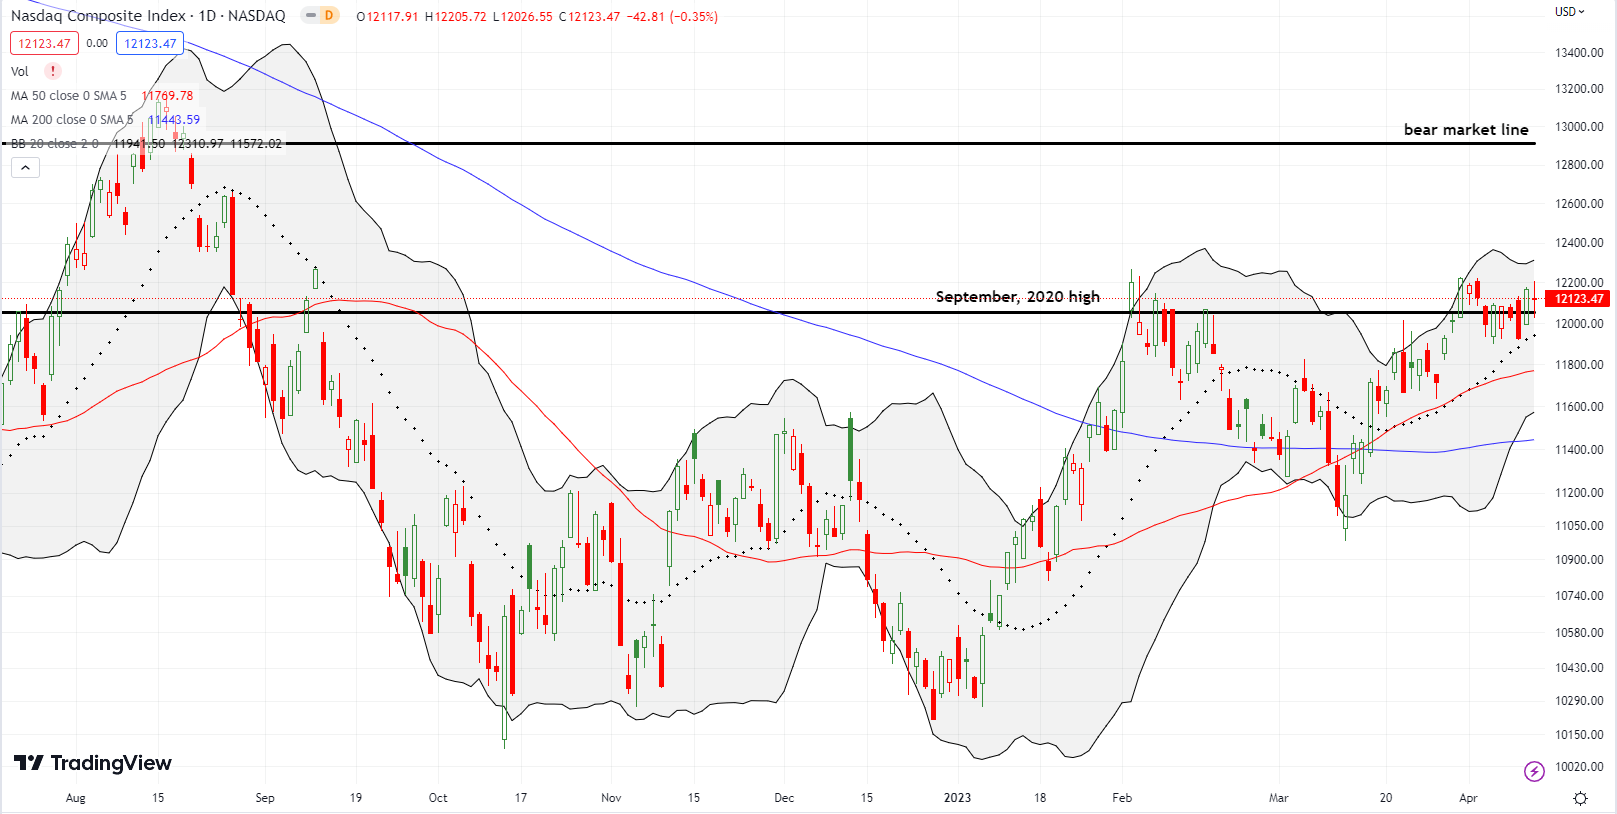
The NASDAQ (COMPQ) ended its melt-up period with its first breakout above the September, 2020 high at the end of March. That close pushed the tech-laden index ever so slightly to a 6+ month high. Since then, the tech-laden index has essentially pivoted around the September, 2020 high, thus further reinforcing the importance of this technical line. Note that buyers still have the advantage with the uptrending 20-day moving average (DMA) (the dashed line) providing support. A big test of this upward pressure is coming in the next week or two.
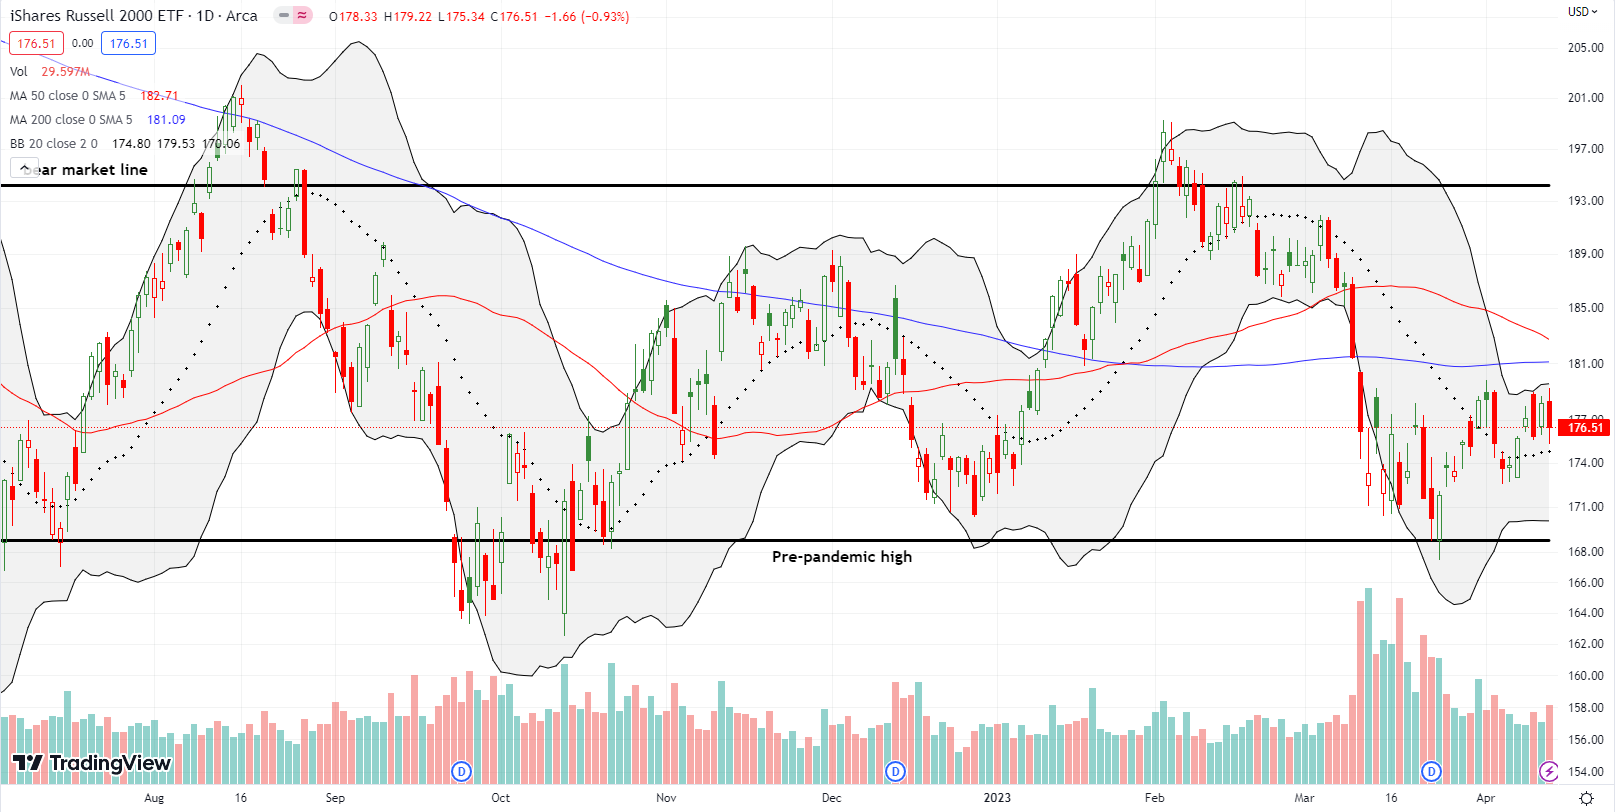
The iShares Russell 2000 ETF (IWM) is stuck. The ETF of small cap stocks is churning above and around its now flattened 20DMA. IWM has gone nowhere since the Panic of 2023 took the ETF down in mid-March. So unlike the S&P 500 and the NASDAQ, IWM has yet to benefit from a flush of sellers. An overhead convergence of 50DMA (red line) and 200DMA (blue line) resistance looms large for IWM whenever buyers try to make the next push.
Stock Market Volatility
The volatility index (VIX) remains full of surprises. The 2023 lows proved me wrong and gave way like so much melted butter. Even while the major indices retreated on Friday, the VIX still slid for a 4.2% loss and a close to levels last seen at the very beginning of 2022. The trading action of the VIX suggests that March’s panic washed out the last remnants of fear in the market. Now, “no worries” traders are anticipating some future catalyst that turns this bear market around in a sustainable way. I remain suspicious of this rapidly increasing complacency. However, the potential upside is huge given the market is far from overbought levels.
The Short-Term Trading Call With No Worries
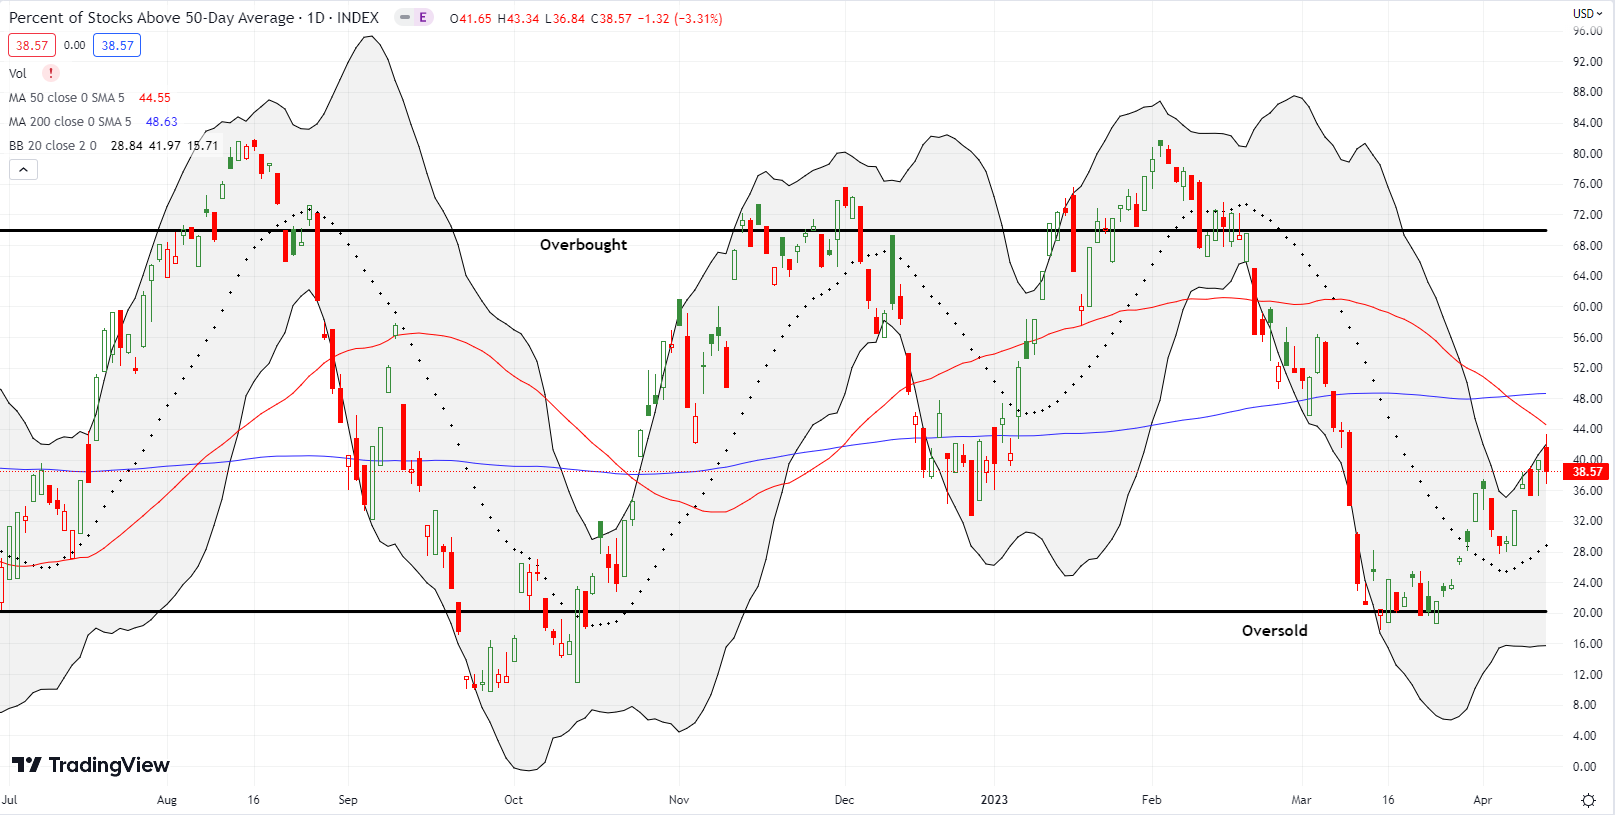
- AT50 (MMFI) = 38.6% of stocks are trading above their respective 50-day moving averages
- AT200 (MMTH) = 45.5% of stocks are trading above their respective 200-day moving averages
- Short-term Trading Call: cautiously bullish
AT50 (MMFI), the percentage of stocks trading above their respective 50DMAs, closed down on Friday at 38.6% but held on to a 5-week high. My favorite technical indicator is still holding an uptrend that began with the launch from March’s oversold threshold. As a result, I remain comfortable with the cautiously bullish short-term trading call. However, the current technical struggles for each of the major indices mean that I prefer to buy dips and sell into resistance. Moreover, a market that has no worries will always worry me. Fortunately, AT50’s relatively low level keeps my caution limited to hedges rather than turning bearish.
Gold can be a hedge against inflation. Yet, last week delivered some hedging ironies.
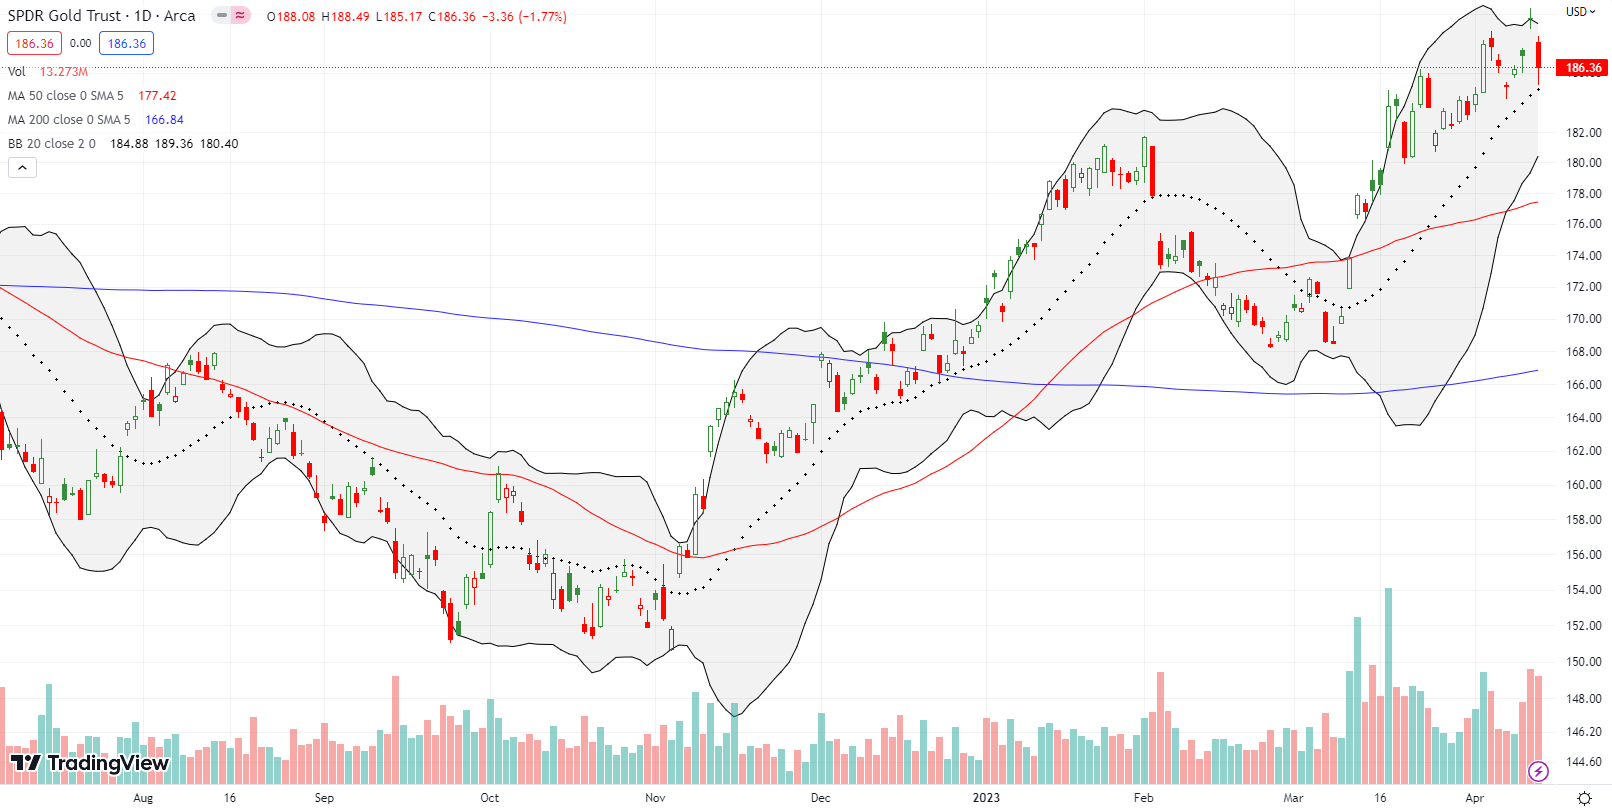
SPDR Gold Trust (GLD) gapped up for a 1.4% gain and an 11-month high as the stock market celebrated a benign PPI reading. Gold bugs anticipate the waning of the Fed’s resolve to fight inflation will invite fresh inflationary pressures into the economy. Thus, gold can rally on the weak inflation numbers that excite the general stock market. However, Friday’s inflation surprise swung the ball right back to the Fed’s court. Strong inflation readings give the Fed fuel to remain vigilant. GLD accordingly fell 1.8%. Sellers even created technical damage by leaving behind the dreaded abandoned baby top (a peak in prices bracketed by a gap up and a gap down). I took profits on a May 180/190 GLD call spread into Thursday’s surge. I am continued to hold a September 190/205 call spread as my longer duration play on the next catalyst to send gold higher. That catalyst could be a Federal Reserve in retreat or an escalating debt ceiling crisis.
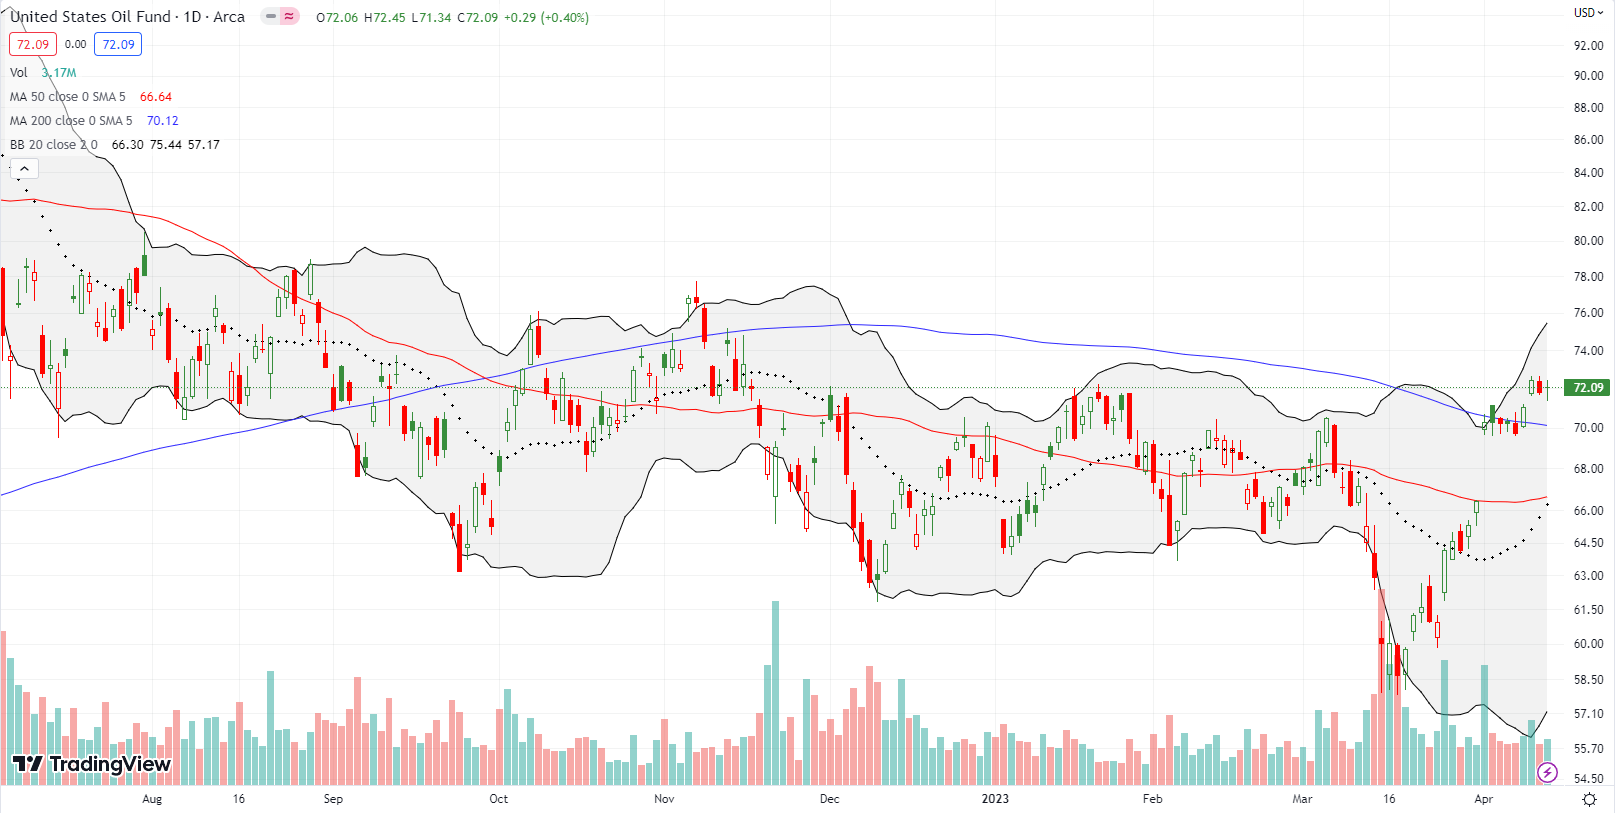
My trade on the United States Oil Fund (USO) and the Monday Blues is ending with the April expiration of the core USO call option. I got a much appreciated rebound I to save the trade. However, I sold one call short too many. On April 3rd, OPEC+ transformed the Monday blues for oil to the Monday celebration. OPEC+ announced major production cuts, and USO promptly surged 5.8%. I allowed my short weekly call to resolve into an assigned USO short. I next bought a May $75 call option to scalp upside in USO in the coming weeks. Sometime soon I will create a new trading strategy to play the on-going importance of Mondays for USO.
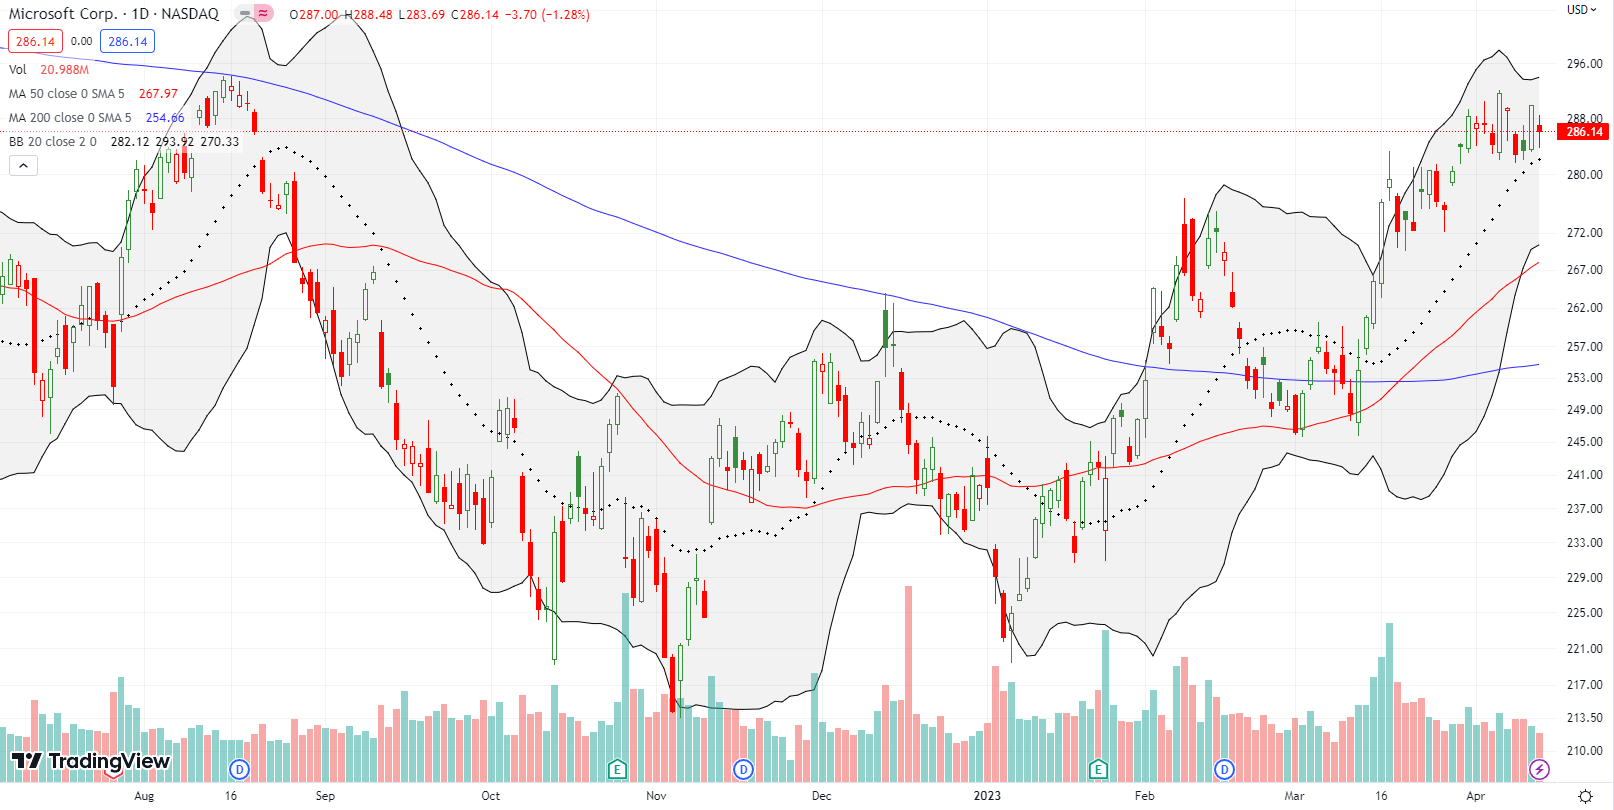
Microsoft (MSFT) is one of two bullish components to the Generative AI trade. I decided to take profits after MSFT first fell back from a challenge of the August, 2022 highs. Despite surging 2.6% the next day (April 6th), MSFT continues to churn along with the NASDAQ. Given that August resistance and MSFT’s expensive valuation at 31 trailing P/E and 26 forward P/E, I highly doubt I will chase a rally further higher. Instead, I have turned my attention closer to Alphabet Inc (GOOG).
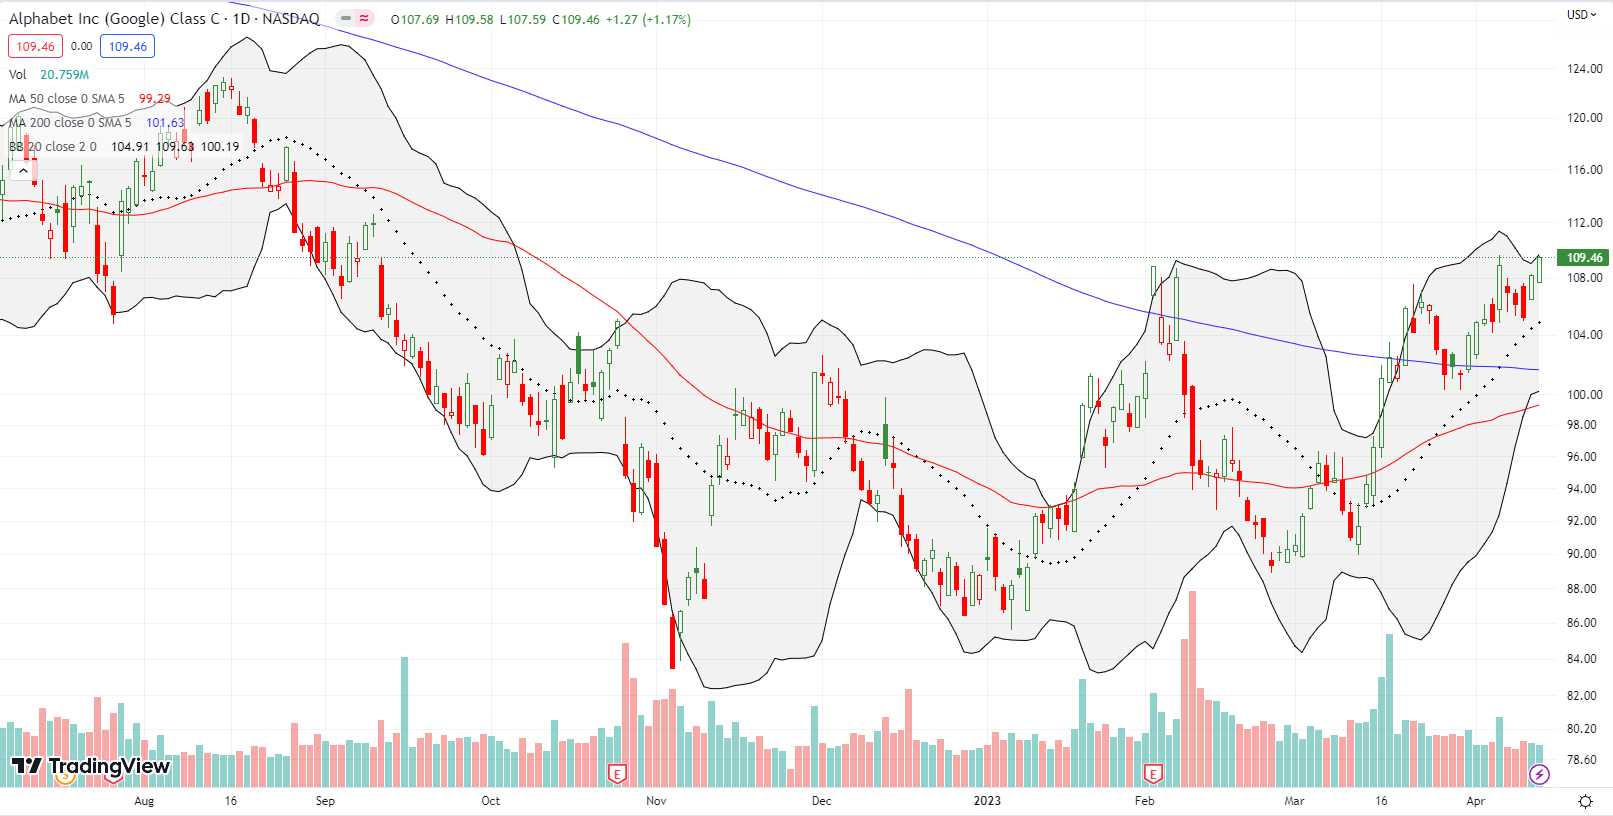
Alphabet Inc (GOOG) is the “under-valued” component of the generative AI trade with a 23 trailing and 20 forward P/E. GOOG’s disastrous opening with Bard provided a discounted entry point for the Generative AI trade. So I felt good taking profits on my call spread when GOOG first challenged its February highs on March 22nd. However, I neglected to get back into the trade when GOOG successfully tested 200DMA support. My next buy the dip opportunity arrived early last week. I took profits on the call option on Friday’s move higher. Going forward, I will continue aggressively buying GOOG dips until the June expiration of the QQQ put spread or a new formulative for the generative AI trade. As planned, I expanded the generative AI trade to the semiconductors. I reached first for an AMD weekly calendar call spread.
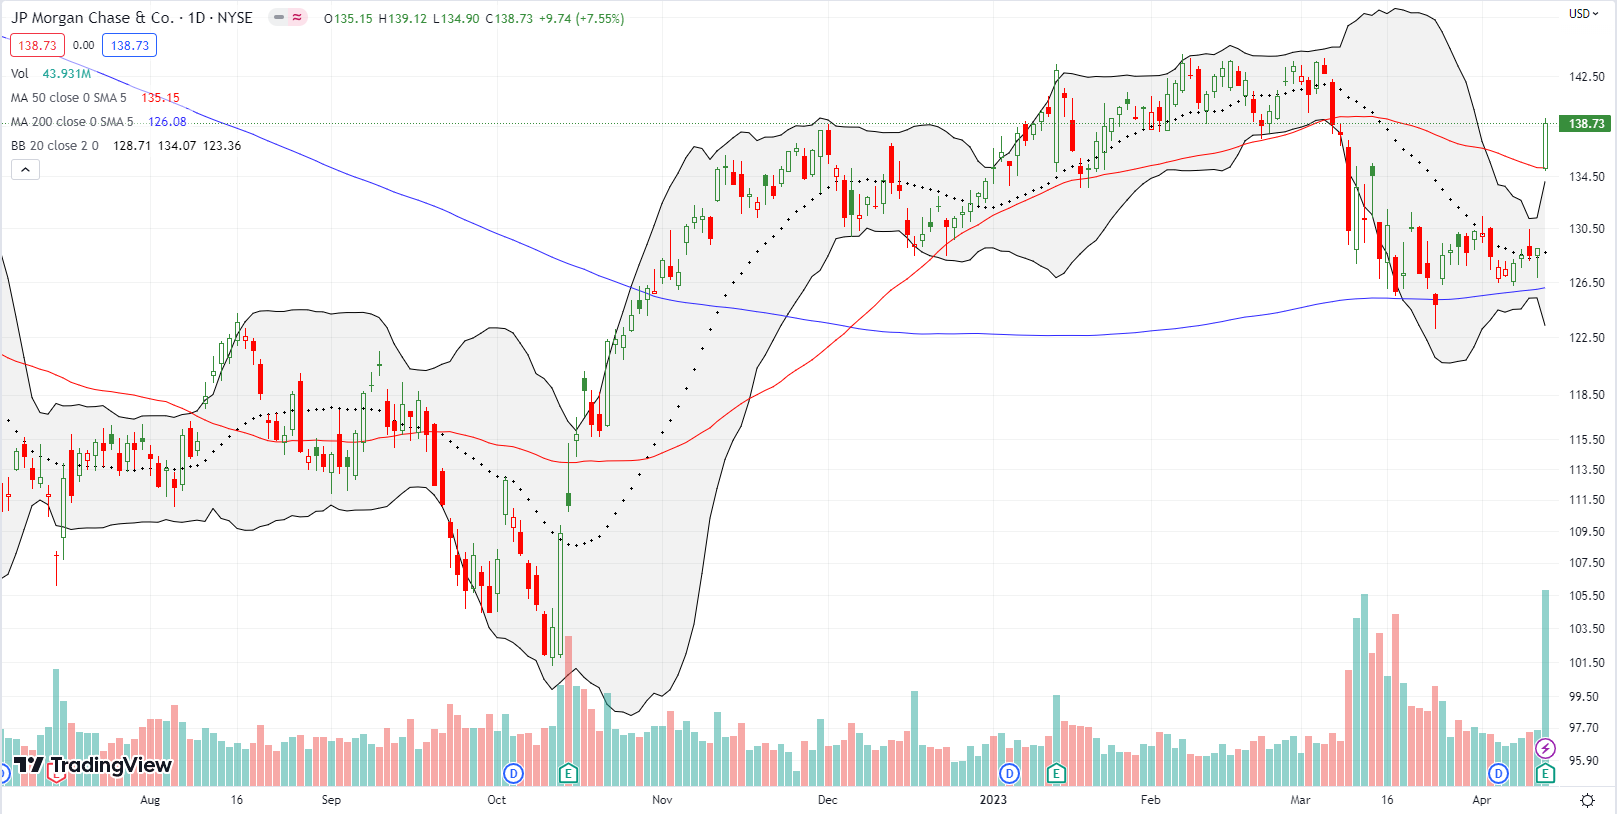
JP Morgan Chase & Co (JPM) was the story of the week. After churning in the wake of the Panic of 2023, JPM reversed its loss in one single post-earnings 7.6% surge. The 50DMA breakout is bullish and staked its claim to this “no worries” market. Still, I moved to fade Financial Select Sector SPDR Fund (XLF) under the assumption that this move was a pent-up over-reaction. I do not expect to hold the XLF puts for long.
Be careful out there!
Footnotes
Subscribe for free to get email notifications of future posts!
“Above the 50” (AT50) uses the percentage of stocks trading above their respective 50-day moving averages (DMAs) to measure breadth in the stock market. Breadth defines the distribution of participation in a rally or sell-off. As a result, AT50 identifies extremes in market sentiment that are likely to reverse. Above the 50 is my alternative name for “MMFI” which is a symbol TradingView.com and other chart vendors use for this breadth indicator. Learn more about AT50 on my Market Breadth Resource Page. AT200, or MMTH, measures the percentage of stocks trading above their respective 200DMAs.
Active AT50 (MMFI) periods: Day #15 over 20%, Day #5 over 30% (overperiod), Day #26 under 40%, Day #28 under 50%, Day 38 under 60%, Day #40 under 70%
Source for charts unless otherwise noted: TradingView.com
Full disclosure: long QQQ put spread; short USO shares, long USO calls; long GLD shares, long GLD call spread; long AMD calendar call spread, long XLF puts
FOLLOW Dr. Duru’s commentary on financial markets via StockTwits, Twitter, and even Instagram!
*Charting notes: Stock prices are not adjusted for dividends. Candlestick charts use hollow bodies: open candles indicate a close higher than the open, filled candles indicate an open higher than the close.


