Stock Market Commentary
NVIDIA Corporation (NVDA) confirmed a double-top with today’s 3.4% loss. For only the sixth time this year, NVDA closed below its uptrending support at the 20-day moving average (DMA) (the dotted line below). Three of these closes have come in the last three days. The stock is now within “inches” of confirming the bearish-engulfing topping pattern that has made me leery for almost a month. While most eyes will be on Friday’s job report for March, my eyes will be watching NVDA instead given how the stock has captured the stock market’s imagination and sentiment.
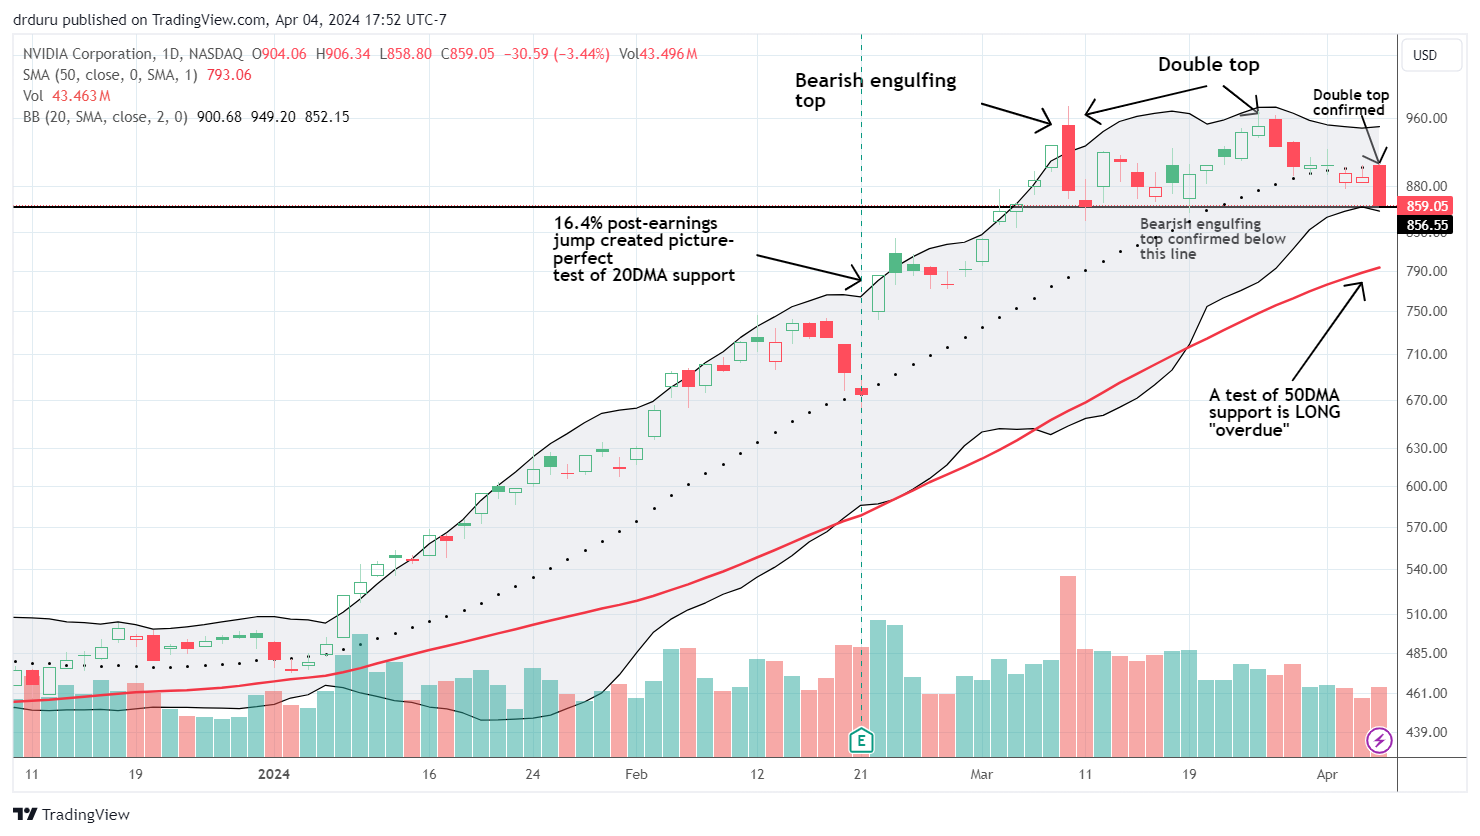
In my last Market Breadth, in reference to 20DMA support, I claimed that “if NVDA actually closes lower, the technical flavor of the market will sour just a bit.” The technical flavor has indeed soured with the S&P 500 and the NASDAQ also marking their first decisive closes below 20DMA support of the year.
In my last post I also claimed that “if NVDA closes below the last lows, around $840, suddenly a quick test of 50DMA support comes into play.” That test is now within reach. Given how NVDA has captured market sentiment, that 50DMA test could be the (technical) event of the year so far. A failure of 50DMA support would/should shift sentiment decisively in favor of the bears.
Thus, I am watching NVDA instead of the jobs report, and I will be more interested in the trading action in NVDA as another earnings season approaches.
The Stock Market Indices
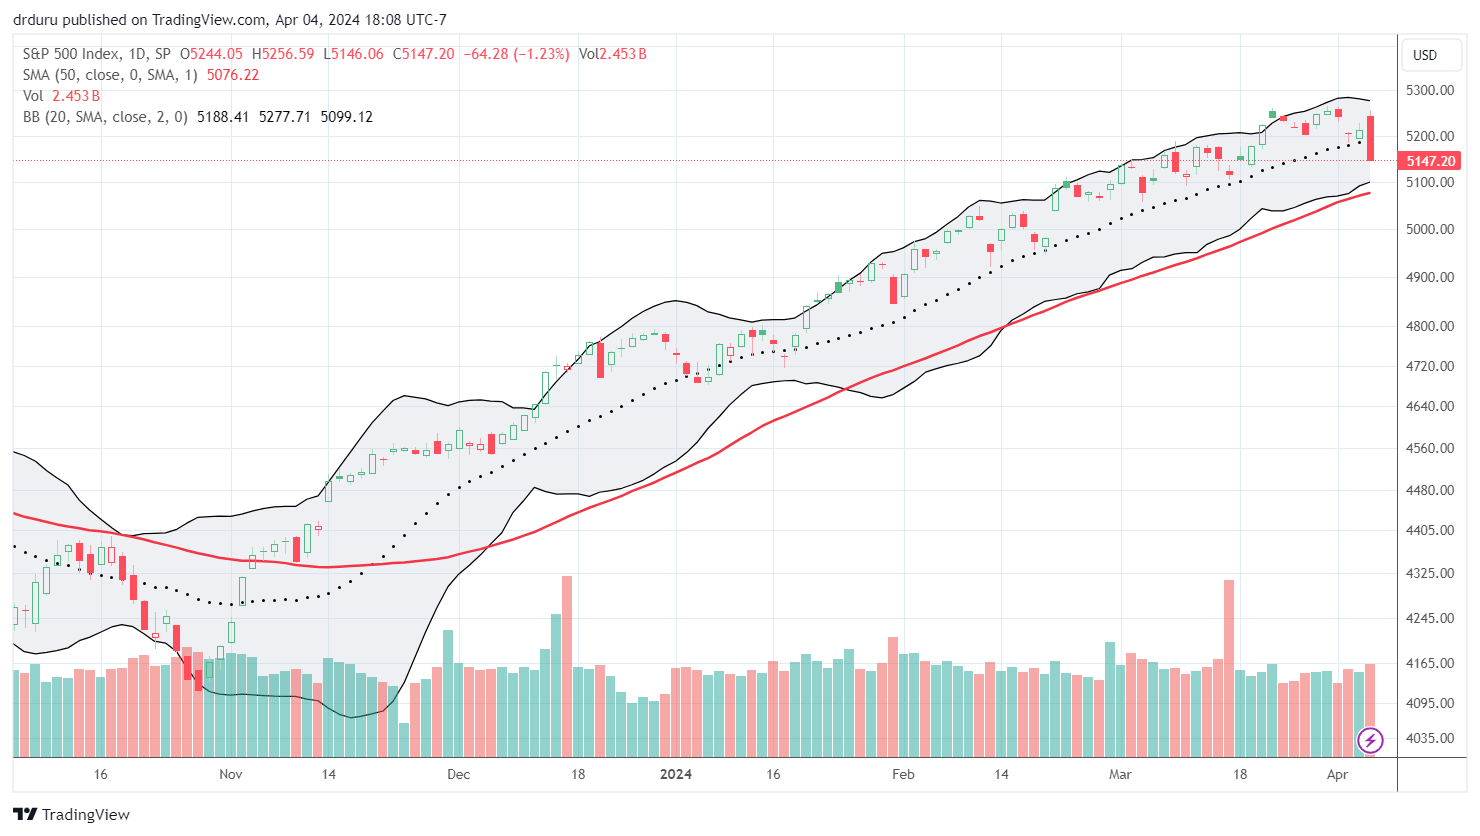
The S&P 500 (SPY) lost 1.2% as it closed below its 20DMA support. A firm uptrend looks further disturbed by the bearish engulfing pattern caused by today’s sharp reversal.
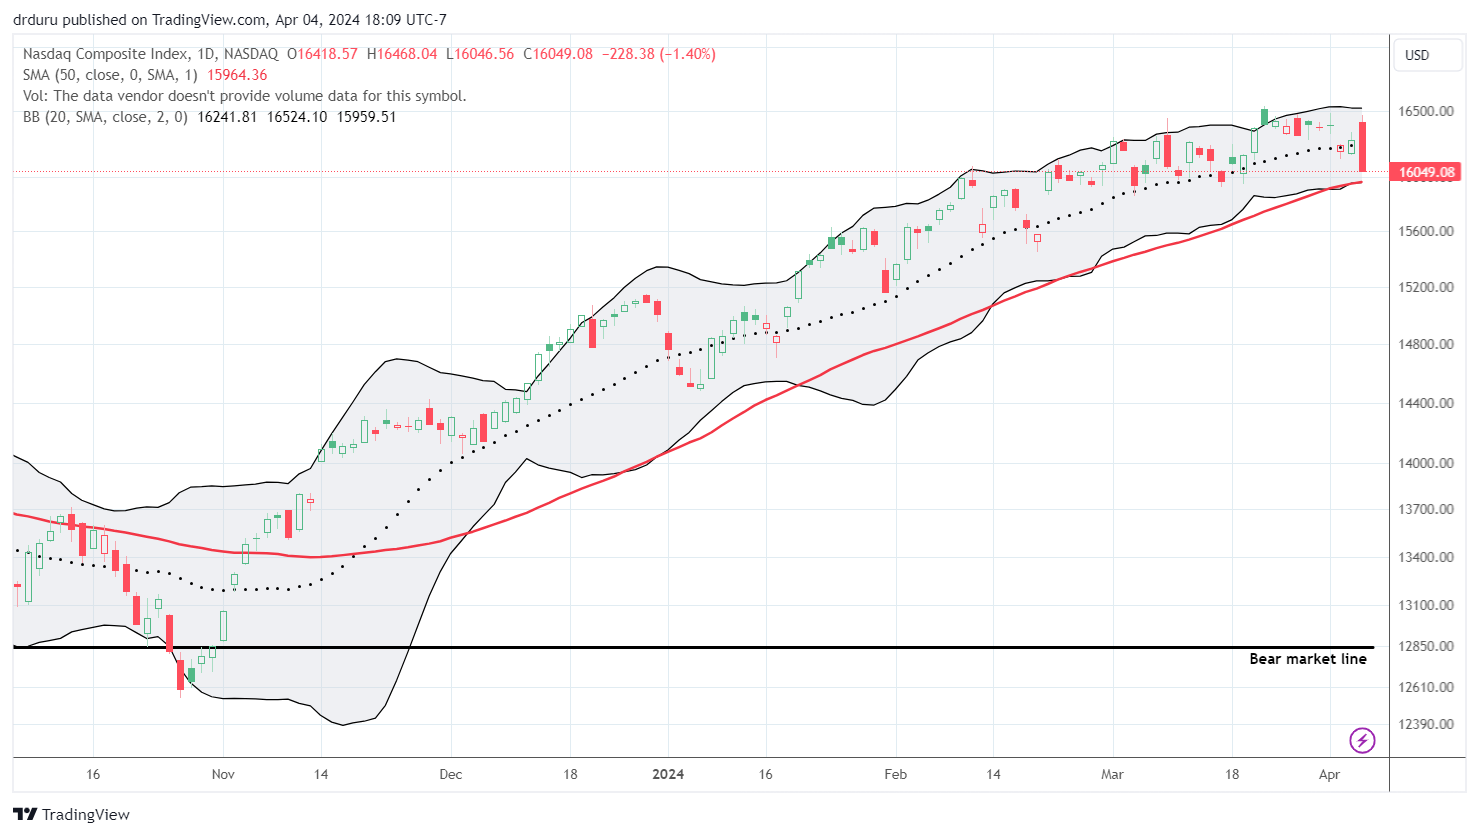
The NASDAQ (COMPQ) printed an even more notable bearish engulfing pattern along with its decisive close below uptrending 20DMA support. The 1.4% loss even put a 50DMA test within reach.
The Short-Term Trading Call While Watching NVDA
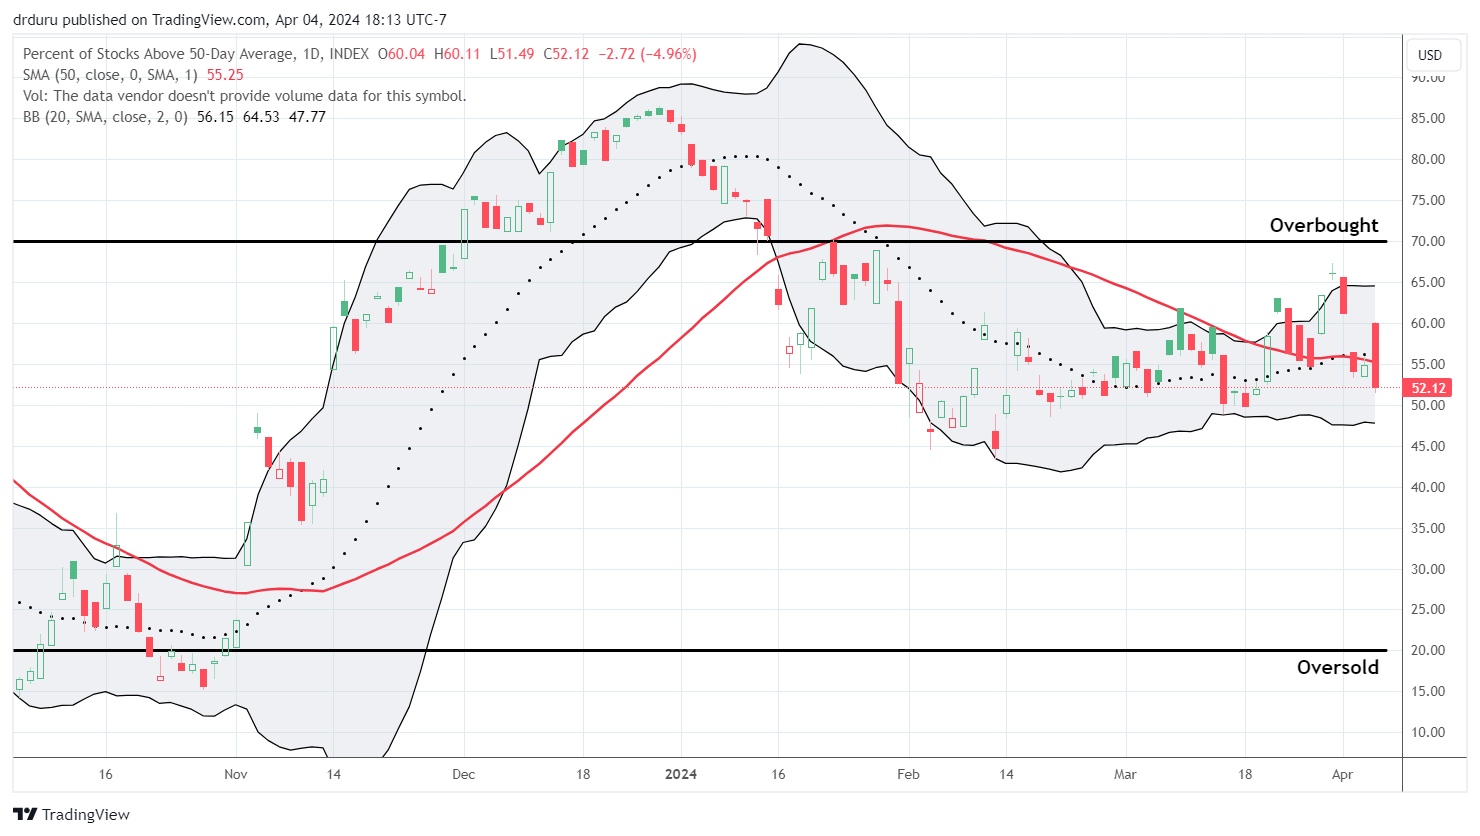
- AT50 (MMFI) = 52.1% of stocks are trading above their respective 50-day moving averages
- AT200 (MMTH) = 60.7% of stocks are trading above their respective 200-day moving averages
- Short-term Trading Call: skeptical
AT50 (MMFI), the percentage of stocks trading above their respective 50DMAs, closed at 52.1%. Just like that, my favorite technical indicator is no longer threatening to return to overbought territory (above 70%). Thus, the rally of this year remains unconfirmed, and I remain skeptical for the short-term trading call.
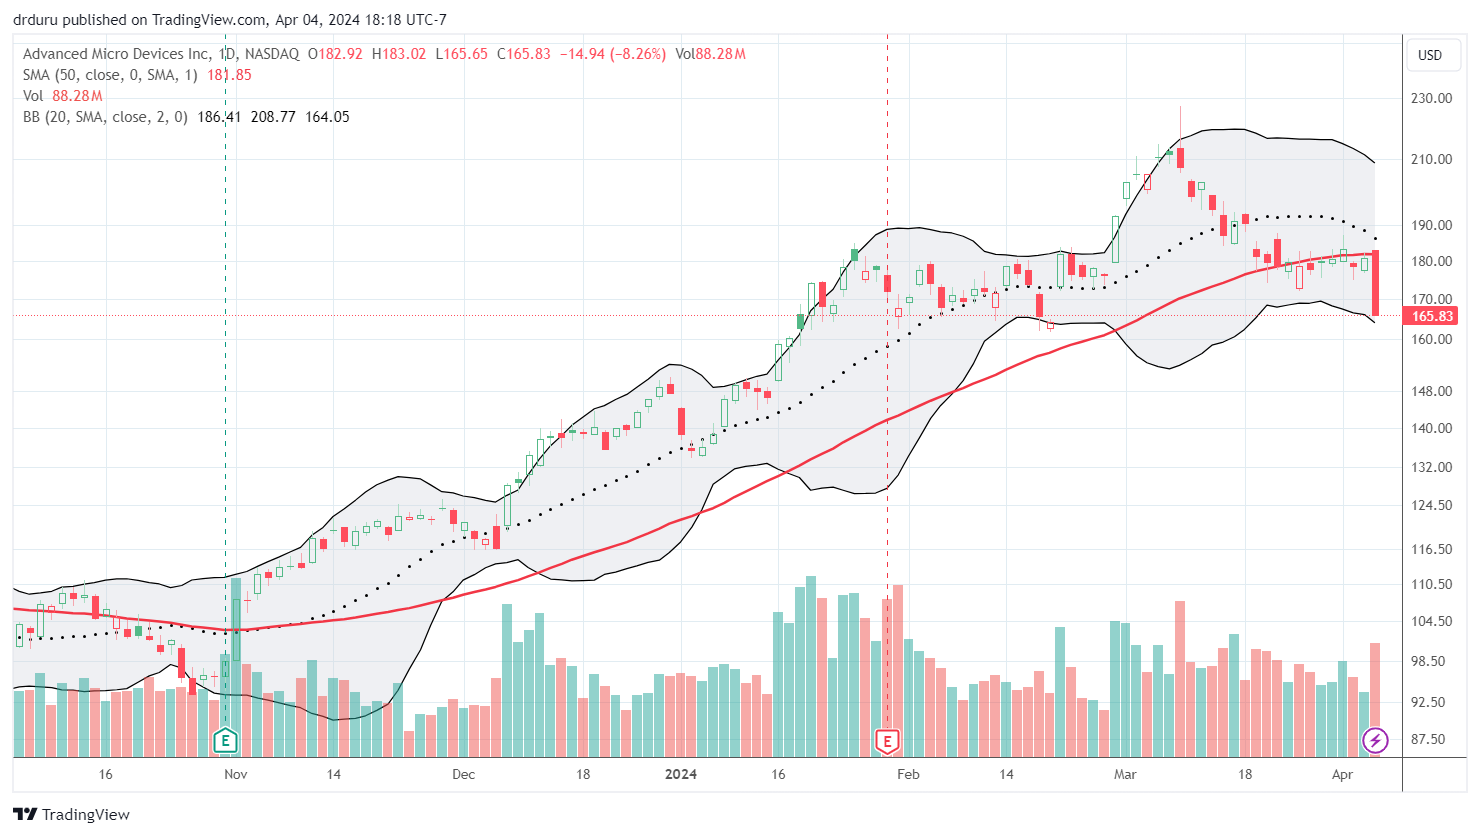
While watching NVDA, I am also watching the entire generative AI trade. Advanced Micro Devices (AMD) took a major hit on the day with an 8.3% loss that confirmed a 50DMA breakdown. With the stock teetering right at its February lows, I am officially on edge for the generative AI trade!
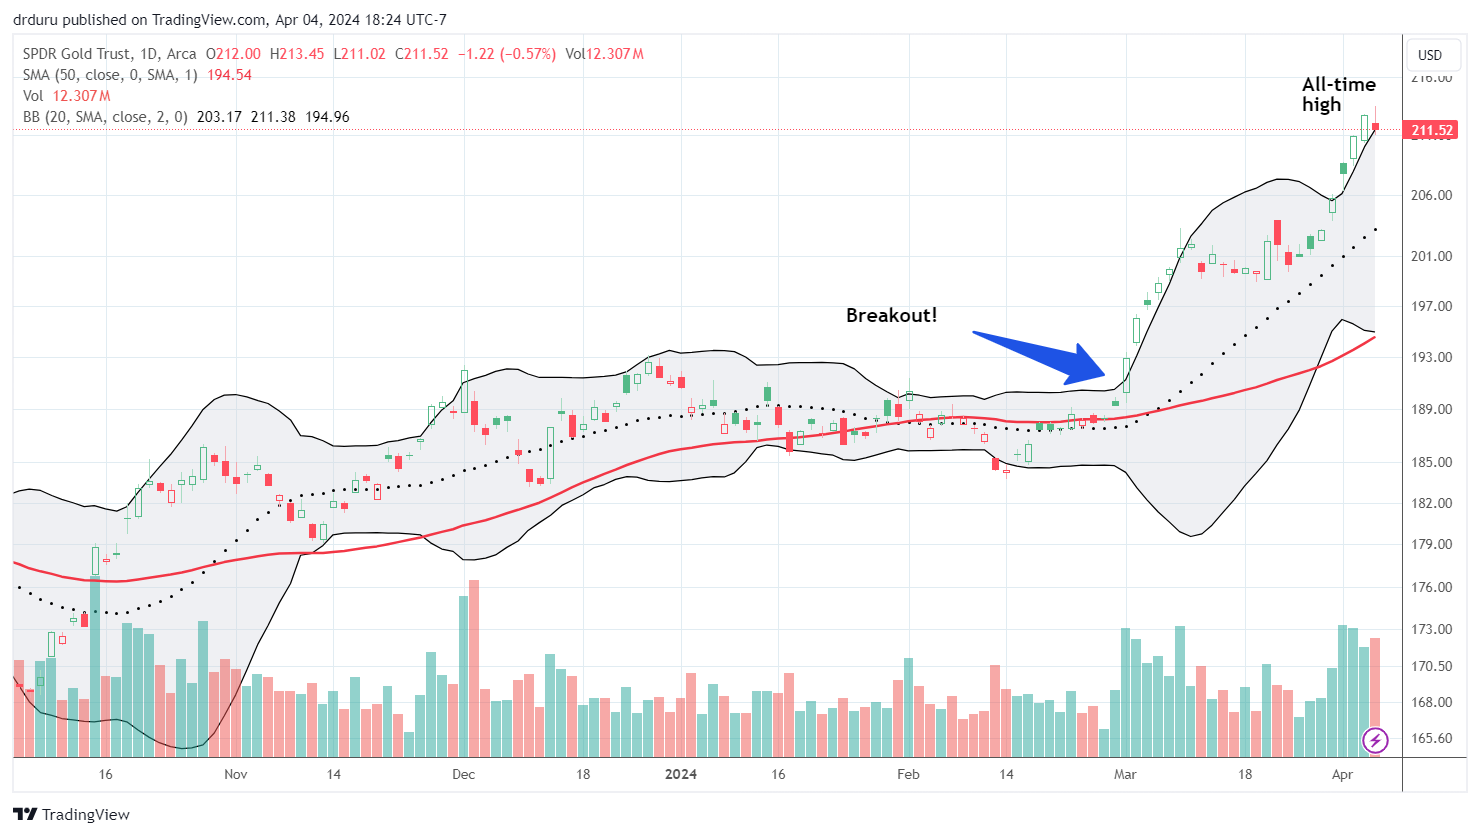
The SPDR Gold Trust (GLD) followed through with the Bollinger Band (BB) squeeze I pointed out in my last Market Breadth. However, today’s small fade from an intraday all-time high looks like the end of the latest sprint higher. I doubt gold bugs will be watching NVDA. They will instead watch for a weak jobs report which could reinforce expectations for a dovish Federal Reserve (putting aside the latest “hawkish” posturing from Fed governors with non-voting Minneapolis governor Neel Kashakri particularly scaring the market today).
Be careful out there!
Footnotes
Subscribe for free to get email notifications of future posts!
“Above the 50” (AT50) uses the percentage of stocks trading above their respective 50-day moving averages (DMAs) to measure breadth in the stock market. Breadth defines the distribution of participation in a rally or sell-off. As a result, AT50 identifies extremes in market sentiment that are likely to reverse. Above the 50 is my alternative name for “MMFI” which is a symbol TradingView.com and other chart vendors use for this breadth indicator. Learn more about AT50 on my Market Breadth Resource Page. AT200, or MMTH, measures the percentage of stocks trading above their respective 200DMAs.
Active AT50 (MMFI) periods: Day #91 over 20%, Day #89 over 30%, Day #87 over 40%, Day #35 over 50% (overperiod), Day #3 under 60% (underperiod), Day #58 under 70%
Source for charts unless otherwise noted: TradingView.com
Full disclosure: long GLD, long AMD, long DELL
FOLLOW Dr. Duru’s commentary on financial markets via StockTwits, Twitter, and even Instagram!
*Charting notes: Stock prices are not adjusted for dividends. Candlestick charts use hollow bodies: open candles indicate a close higher than the open, filled candles indicate an open higher than the close.

