A Trampling at the Frontlines of the Stock Market – Above the 40 (June 24, 2020)
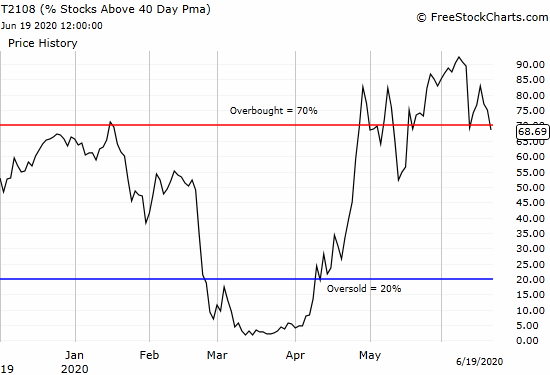
Stock Market Statistics AT40 = 47.9% of stocks are trading above their respective 40-day moving averages (DMAs) (2-month low)AT200 = 21.5% of stocks are trading above their respective 200DMAs VIX = 33.8Short-term Trading Call: neutral Stock Market Commentary The damage in the stock market is only visible upon close examination. The top technicals for the … Read more