
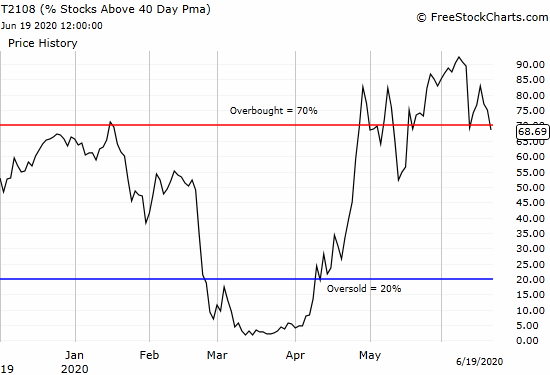
The financial markets have presented numerous extremes during the coronavirus pandemic. I rely on the percentage of stocks trading above their respective 40-day moving averages (DMAs), aka AT40 (T2108), as a measure of oversold (below 20%) and overbought (above 70%) extremes in the stock market. In just three months, the stock market went from printing the second longest oversold period on record (since 1986) to one of only four periods on record where overbought extremes sent AT40 above 90%. Last week ended one more extreme: only the fourth period on record with overbought extremes accompanied with a volatility index (VIX) closing at above 30, a historically extreme level.
Typically, overbought conditions are a demonstration of buyer strength. Investors and traders get comfortable with the stock market, risk-taking becomes bolder and bolder, sentiment may even taken on an air of complacency. The most positive outcomes get fully priced and well-anticipated. This time around, the S&P 500 first flipped overbought on April 29th and shot straight to 82.6%. Yet this confidence was not met with a plunge in volatility: the VIX only dropped from 33.6 to 31.2. Wariness remained and still remains.
I reviewed the historical data to determine whether last week’s ending of this extreme overbought period has bullish or bearish implications. The data seem to favor the bulls.
December 31, 2008 to January 9, 2009 and March 26, 2009 to June 4, 2009
These two periods were bookends to the historic March, 2009 low of the financial crisis.
The year 2009 began with some promise as the S&P 500 (SPY) broke out above its 50-day moving average (DMA) and buyers followed-through. When the overbought period ended on January 12th, the S&P 500 lost 2.3% on a fresh 50DMA breakdown. The VIX was also on the move again. The VIX closed that day at 45.8 and stayed above 40 all the way into the March, 2009 lows.
The bright side of the March low was a different story. The overbought period stretched for a month and a half with an elevated VIX above 30. From March 26th to June 4th, the S&P 500 gained 12% and managed to break out above its 200DMA. While the index drifted downward from there, it never broke support even as the overbought period ended in another week. AT40 fell as low as 33.6% on June 23rd. A bullish divergence developed with the S&P 500 continuing to drift lower while AT40 pushed higher. The final launch higher and a fresh breakout for the S&P 500 came in July. On July 10th, AT40 closed at 28.7%. The stock market was “almost” oversold, yet this was the final low-risk buy signal of that period.
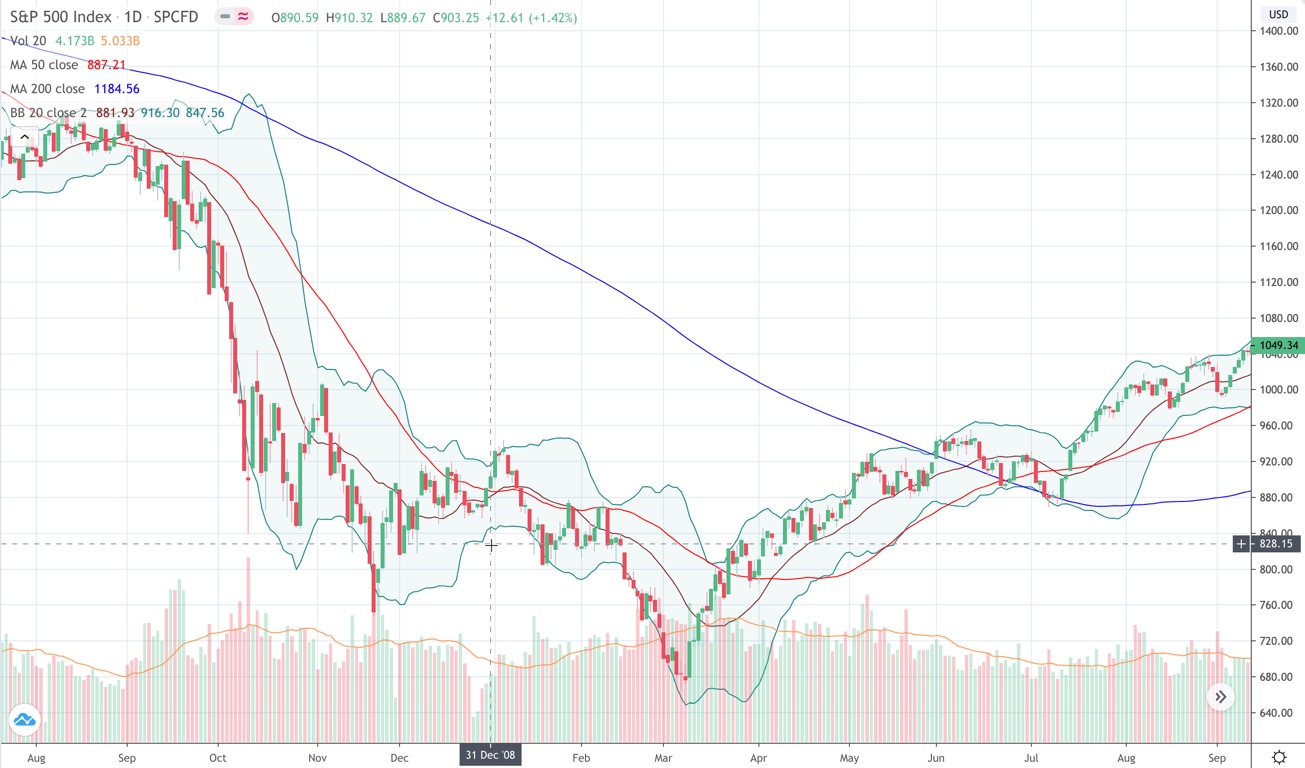
Source: TradingView.com
I contend the current stock market is related to that period of recovery in 2009. Today, the S&P 500 is continuing to hold support at its 200DMA even as overbought periods have started and ended. Sellers will likely be able to push the stock market close to or into oversold territory with little effort. Such a moment should be a major buying opportunity only eclipsed by the March stock market collapse.
October 25, 2011 to November 16, 2011
Over this period, the volatility index actually fell below 30 for 6 trading days before the overbought period finally ended on November 17th. On that day, the S&P 500 delivered a convincing confirmation of resistance at its 200DMA. In another two days, the index broke below its 50DMA. The index bottomed on November 25th, far short of the October bottom. AT40 closed at 24.3%…”close enough” to oversold. It took me some time to even recognize the bullish implications of the move (my AT40 trading strategies were still in development). The chart below shows the S&P 500 rocketed higher from there until the next peak in March, 2012.
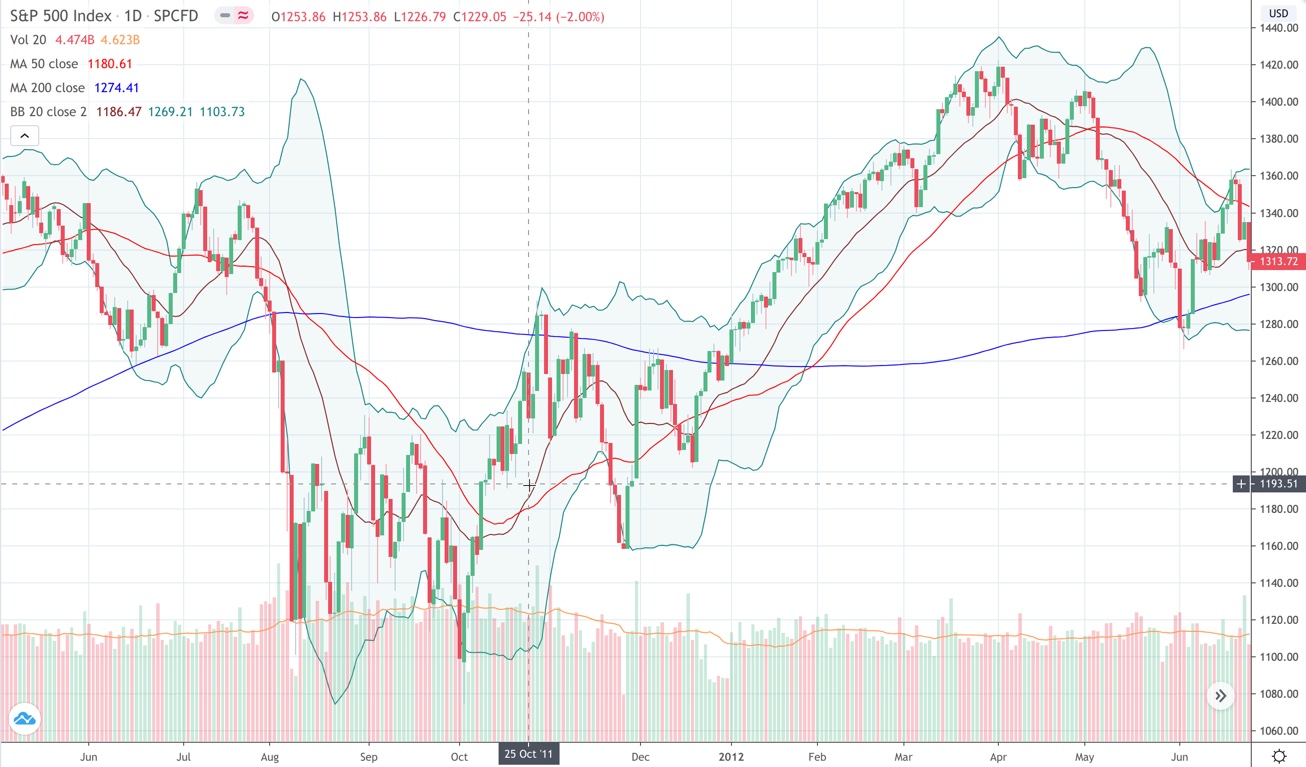
Source: TradingView.com
The lesson from this episode reinforces a lesson from the previous episode: after coming off an overbought period where volatility is already elevated, a sell-off toward oversold conditions is “close enough” to a buying opportunity. At the time of the previous episodes, I did not have the data to infer the potential opportunity. Now, I have enough data to do so. Now, I am primed for buying as soon as AT40 drops into the vicinity of 30%. I will get particularly aggressive with AT40 rebounding out of the 20s. All the standard caveats of positioning around the 50 and 200DMAs will still apply.
April 29, 2020 to June 18, 2020
So there are only three periods comparable to the one that just ended. The sample is certainly small. However, as a student of extreme stock market conditions, I have learned that small samples can provide plenty of guidance for action. I have also learned that waiting for an abundance of confirmation is a recipe for missed opportunities in extreme conditions.
From April 29th to June 18th, the S&P 500 gained 6%.
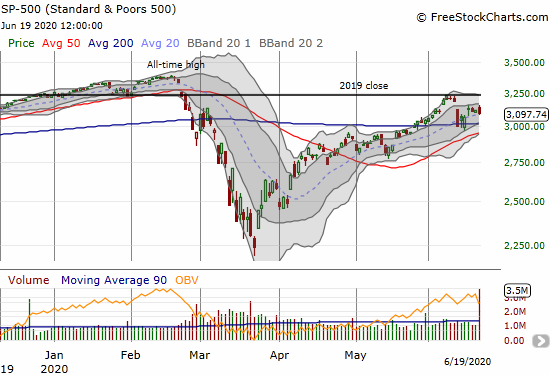
Over this period the stock market dropped out of overbought trading conditions for 10 trading days. Thus this period showed less buying conviction than the other extreme overbought periods.
There were also 15 straight trading days, from May 20th to June 10th where the VIX closed below 30. The VIX closed as low as 24.5. The VIX’s behavior is the more unique twist to consider in assessing trading opportunities.
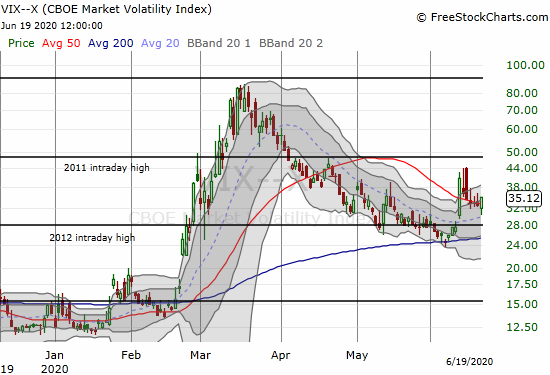
Source for above charts: FreeStockCharts
I think the combination of 1) a previously lower VIX and 2) now an increasing VIX as another overbought period comes to an end increase the odds of a sell-off strong enough to push the stock market toward oversold conditions. The drop of the VIX to 24.5 can even be interpreted as creating pent-up “demand” for volatility. While it is very possible the stock market can turn right around this week and re-enter overbought conditions, I think the risk/reward favors more downside than upside in coming weeks. Accordingly, I do not expect quick returns to overbought conditions to last long.
Given my assessments, I flipped out of cautiously bullish to neutral in the last Above the 40 post. I want to be mentally ready for more selling pressure during a time I see a tighter and tighter ceiling on near-term upside. As a reminder, I do not anticipated getting bearish before going bullish again because I anticipate a 50DMA breakdown in the S&P 500 occurring alongside a “close enough” oversold reading in AT40. Moreover, the 50DMA is now trending upward on the S&P 500.
Be careful out there!
Full disclosure: no positions
Good stuff on the t2108,…have referred to this for years….
Always good to find someone else who knows about and uses this indicator!