
Stock Market Statistics
AT40 = 68.7% of stocks are trading above their respective 40-day moving averages (DMAs) (ended 5 days overbought, over 70%)
AT200 = 25.7% of stocks are trading above their respective 200DMAs
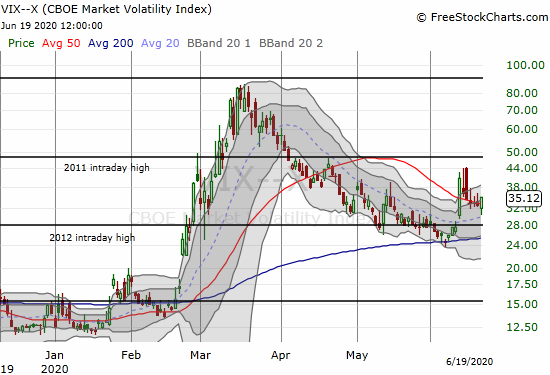
VIX = 35.1
Short-term Trading Call: neutral
Stock Market Commentary
When the NBA suspended/cancelled its basketball season in March, I wrote about how that event symbolized the non-linearity of the pandemic and the accompanying economic crisis. The volatility index was persistently high, and I braced for more stock market crashes and more stock market extremes. Three months later, the U.S. and other countries are forcing the issue of reopening economies even as coronavirus cases surge (as expected). Apple (AAPL) provided a fresh symbol of the economic side of the pandemic after announcing a closure of its stores in select coronavirus hotspots. Apple did not react with a mass, “safer than sorry” closure of all stores.
In this new phase, a menagerie of localized responses will cause confusion and perhaps even create conflicting signals. Aggregated data will become harder to interpret. In this context, I expect a more tentative stock market where, like the previous week, the big moves will be dominated by downside risk.
The Stock Market Indices
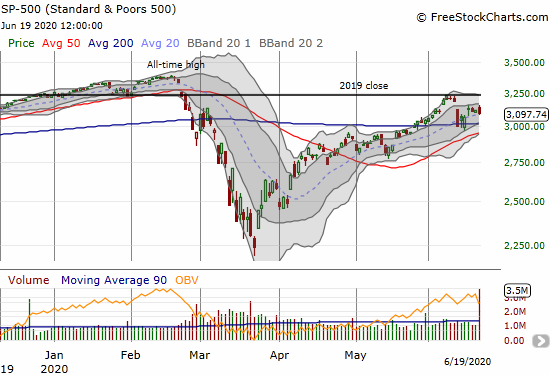
The S&P 500 (SPY) is starting to look like it is trapped between its 2019 close and its 200-day moving average (DMA). Like so many stocks that I described in the last Above the 40 post, the index looks like it is in limbo. Once the 50DMA converges with the 200DMA, the developing trading range will take on even more significance. A breakout or breakdown should be very tradable.
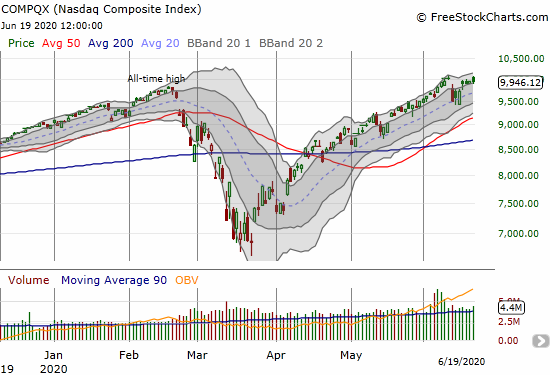
The NASDAQ (COMPQX) continues to look a lot better than the S&P 500. The tech-laden index is even still inside its upper Bollinger Band (BB). The NASDAQ is still riding an uptrend.
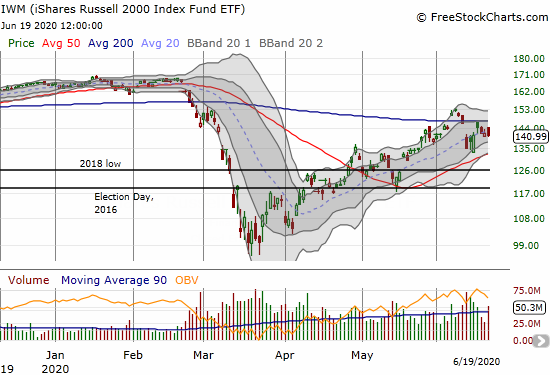
The iShares Russell 2000 Index Fund ETF (IWM) looks like the S&P 500 except the index of small cap stocks has a trading range between 200DMA resistance and 50DMA support. Last week, IWM confirmed resistance at its 200DMA and added to a growing sense of being trapped in limbo.
Volatility
The volatility index (VIX) is starting to look more resilient. After successfully fading the ProShares Ultra VIX Short-Term Futures ETF (UVXY) on Monday, I decided to suspend my strategy of fading volatility. I even bought UVXY twice. The second flip took advantage of something I noticed after an earlier particularly volatile trading day: UVXY sprinted higher during the first minutes of the after hours period. Triple-witching seemed like another great day for another such effect. Sure enough, UVXY jumped two points soon after the market closed, and I took profits. Now I wonder whether I will wish I still held those UVXY shares on Monday morning!
Overbought…No More

AT40 (T2108), the percentage of stocks trading above their respective 40DMAs, ended another overbought period. AT40 fell below 70% and closed at 68.7%.
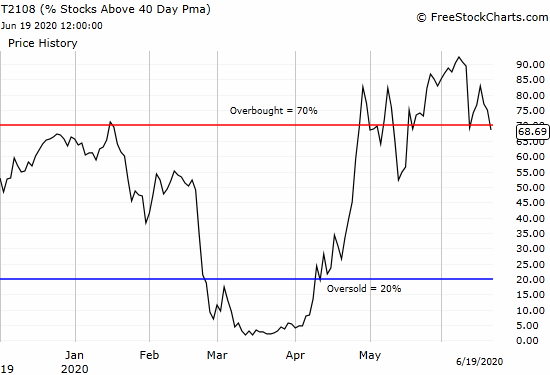
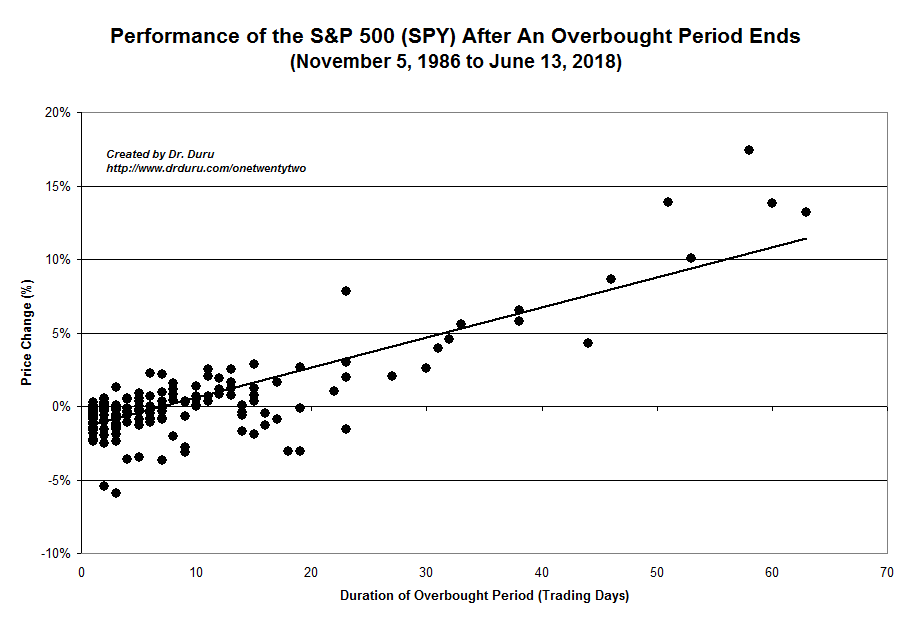
This latest overbought period lasted 5 days. The S&P 500 gained 1.8% over this time and at the high end of historical expectations. In other words, the S&P 500 is still showing off signs of latent strength.
The Short-Term Trading Call
The heavy trading in the stock market combined with another drop from overbought trading conditions have compelled me to stand down from my cautiously bullish short-term trading call. I am now back to neutral. It is just hard to be excited about the current market set-up. The volatility index remains stubbornly elevated (I will have more to say about these levels in a coming post). The S&P 500 is trapped in neutral. IWM is trapped below important resistance. At this point, I do not expect to flip bullish again until the market delivers a pullback in the form of, ideally, oversold conditions or at least a test of 50 or 200DMA support for the S&P 500.
A bearish case will be exceptionally tricky given the NASDAQ can suffer a sharp pullback and still bullishly test uptrending 50DMA support. A breakdown below this support would likely occur close to oversold conditions. I will cross that bridge when/if the market goes there. In the meantime note well I once again carefully avoided an automatic flip to bearishness upon AT40 dropping from overbought trading conditions.
Stock Chart Reviews: A Video Summary
Stock Chart Reviews – Below the 50DMA
Found none of interest for now.
Stock Chart Reviews – Above the 50DMA
iQIYI (IQ)
I had a lot of success trading in and out of Chinese video streaming service iQIYI (IQ), but in late May I decided to stop trading the stock. I am not sure whether I would have held shares to take advantage of of Tuesday’s 25.9%, but I sure felt the pain of being on the sidelines! iQIYI benefited from news that Chinese social media and gaming company Tencent Holdings Ltd is bidding to become iQIYI’s biggest shareholder. Such a deal makes sense, but I was focused on the potential of a delisting of IQ from U.S. stock exchanges.
Such a beautiful 200DMA breakout from a 3+ month consolidation period…

Lowe’s Companies (LOW)
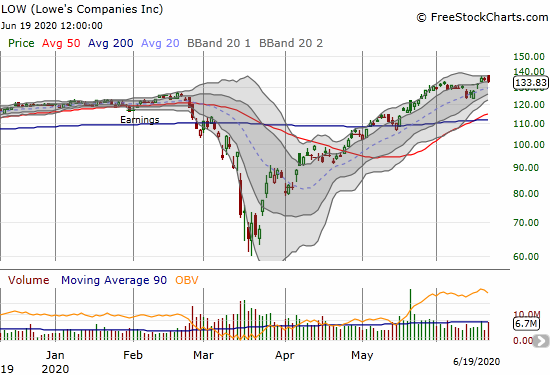
I had to rub my eyes. Minus a hiccup during the stock market’s sharp 1-day pullback, Lowe’s Companies (LOW) is grinding away higher and higher. The stock is now at all-time highs. Whenever the next round of selling in the market takes down LOW, I will make sure to buy and hold!
Netflix (NFLX)
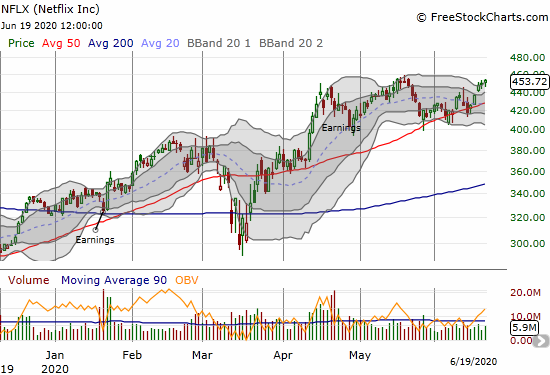
Netflix (NFLX) escaped another bearish setup. NFLX failed to confirm its 50DMA breakdown the previous Friday. To further spite my bearish inclinations, NFLX gained every single day of last week and is right back to its all-time highs.
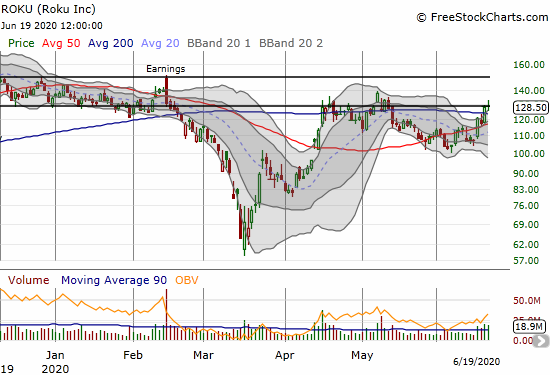
Roku (ROKU)
Roku (ROKU) also confounded my bearish inclinations. The stock escaped from trading below 50DMA resistance with an impressive 12.4% gain and 50DMA breakout. The stock is right back to its previous limbo range (see the thick and black horizontal lines). The stock market is clearly quite confused on what to do with ROKU.
Stock Chart Spotlight – Bullish Breakout
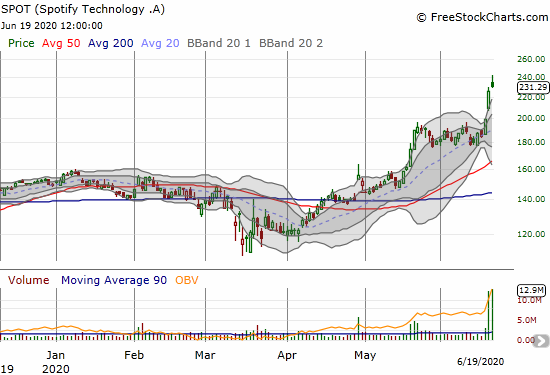
Spotify (SPOT)
Spotify (SPOT) seems to have landed on a winning strategy of signing up celebrity podcasters. This week’s excitement was over the signing of reality star Kim Kardashian West to do a podcast on criminal justice reform, a cause West has taken up with vigor in recent years. “Someone” seemed to get a drop on the news with SPOT breaking out to an all-time high on a 7.7% gain. The news came after the close of trading.
The next day, late-comers bumrushed the stock for another 12.7% gain. Early in the move, I bought a weekly calendar spread at the $220 strike. I felt very fortunate to get taken out of the trade on Friday with a small profit, but I of course lamented completely underestimating the power of this bullish breakout. The chart below also shows that the breakout to an all-time high was the start of a bullish resolution to a Bollinger Band (BB) squeeze.
I am back to the sidelines watching for the next entry long or short.
— – —
FOLLOW Dr. Duru’s commentary on financial markets via email, StockTwits, Twitter, and even Instagram!
“Above the 40” uses the percentage of stocks trading above their respective 40-day moving averages (DMAs) to assess the technical health of the stock market and to identify extremes in market sentiment that are likely to reverse. Abbreviated as AT40, Above the 40 is an alternative label for “T2108” which was created by Worden. Learn more about T2108 on my T2108 Resource Page. AT200, or T2107, measures the percentage of stocks trading above their respective 200DMAs.
Active AT40 (T2108) periods: Day #48 over 20%, Day #42 over 30%, Day #40 over 40%, Day #39 over 50%, Day #24 over 60%, Day #1 under 70% (ending 5 days overbought)
Daily AT40 (T2108)
")
Black line: AT40 (T2108) (% measured on the right)
Red line: Overbought threshold (70%); Blue line: Oversold threshold (20%)
Weekly AT40 (T2108)

*All charts created using FreeStockCharts unless otherwise stated
The T2108 charts above are my LATEST updates independent of the date of this given AT40 post. For my latest AT40 post click here.
Be careful out there!
Full disclosure: AAPL call options
*Charting notes: FreeStockCharts stock prices are not adjusted for dividends. TradingView.com charts for currencies use Tokyo time as the start of the forex trading day. FreeStockCharts currency charts are based on Eastern U.S. time to define the trading day.