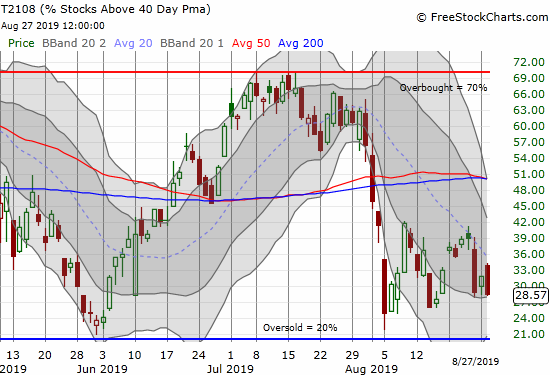
A Banner Month for Home Builders Even As the Stock Market Churned
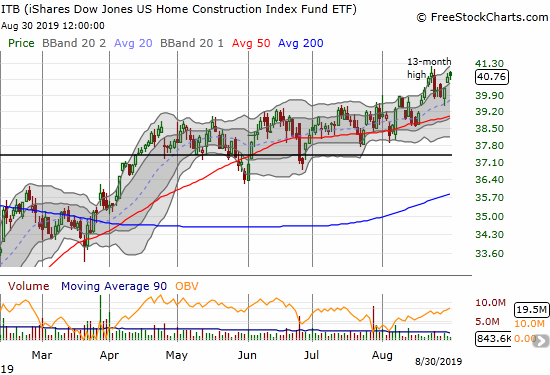
While the month of August was full of sharp trading action which left the S&P 500 (SPY) trapped in a trading range, home builders emerged stronger. The 4.8% August gain for iShares Dow Jones Home Construction ETF (ITB) far out-performed the S&P 500 (SPY) which languished with a 1.8% loss. Ironically, the stock market’s small … Read more