Airline Stocks: Trading Ideas After the End of Parabolic Moves

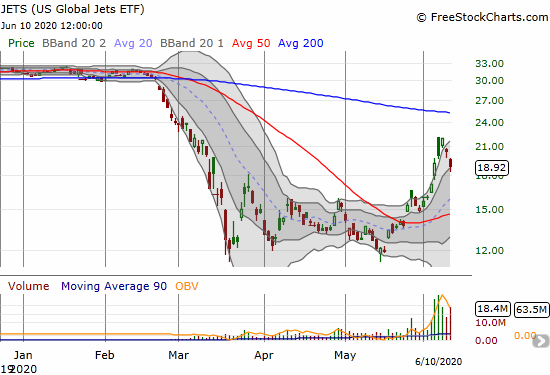
The U.S. Global Jets ETF (JETS) lost 7.5% but held on to support at bottom of its upper Bollinger Band channel.

Airline stocks were on a tear during a week of panic buying and catch-up trades. From worst to first, in less than a month airline stocks went from setting fresh multi-year lows to 3+ month highs on the heels of parabolic moves. The U.S. Global Jets ETF (JETS) summarizes the contours of the moves. From … Read more

Culture of Collapse: Air Travel’s Disappearance In One Chart

Since companies began restricting business travel over precautions with the coronavirus pandemic, the Transportation Security Administration (TSA) provided data on screenings at U.S. airports. These data say a lot about the disappearance of air travel in the U.S. Almost every screening represents a passenger on a flight. The TSA provides a year-over-year comparison, normalized to … Read more

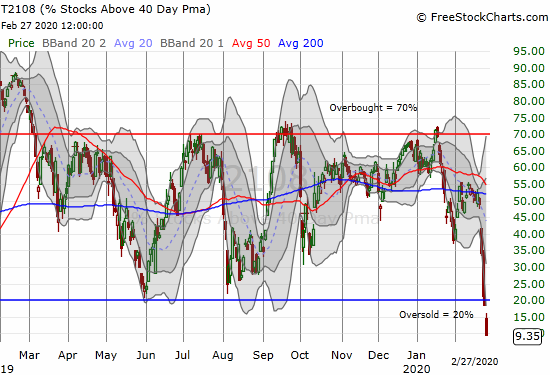
Second Derivative Selling Reverses More Stock Market Breakouts – Above the 40 (February 27, 2020)

AT40 (T2108) plunged from 18.5% to 9.4% to become deeply oversold.

AT40 = 9.2% of stocks are trading above their respective 40-day moving averages (DMAs) (oversold day #2)AT200 = 26.8% of stocks are trading above their respective 200DMAs (near 13-month low)VIX = 39.2 (up 42.1%)Short-term Trading Call: bullish Stock Market Commentary Oversold The stock market is only into its second oversold day, but the technical extreme … Read more

Overbought Conditions Remain Elusive As Market Wavers Ahead of the Fed – Above the 40 (July 19, 2019)

AT40 = 58.4% of stocks are trading above their respective 40-day moving averages (DMAs) AT200 = ~52.4% of stocks are trading above their respective 200DMAs VIX = 14.5Short-term Trading Call: neutral Stock Market Commentary A week ago, the S&P 500 (SPY) made a new all-time, and I was expecting a trip into overbought conditions. AT40 … Read more

Above the 40 (April 9, 2019) – Stock Market Fades from the Edge of Overbought

AT40 = 58.4% of stocks are trading above their respective 40-day moving averages (DMAs)AT200 = 48.4% of stocks are trading above their respective 200DMAsVIX = 14.3Short-term Trading Call: bearish Stock Market Commentary Ever since the last overbought period ended, the stock market has experienced just two clear bearish signals. Each time, the bearishness was well-telegraphed … Read more

T2108 Update (January 30, 2017) – Disruption Junction Beckons S&P 500 Bears

(T2108 measures the percentage of stocks trading above their respective 40-day moving averages [DMAs]. It helps to identify extremes in market sentiment that are likely to reverse. To learn more about T2108, see my T2108 Resource Page. T2107 measures the percentage of stocks trading above their respective 200DMAs.) T2108 Status: 53.9% T2107 Status: 65.4% VIX … Read more

T2108 Update (November 16, 2016) – A 5-Day Backup Under All-Time Highs for the S&P 500

(T2108 measures the percentage of stocks trading above their respective 40-day moving averages [DMAs]. It helps to identify extremes in market sentiment that are likely to reverse. To learn more about it, see my T2108 Resource Page. You can follow real-time T2108 commentary on twitter using the #T2108 hashtag. T2108-related trades and other trades are … Read more

T2108 Update (August 2, 2016) – From Bearish Divergence to Breakdown

(T2108 measures the percentage of stocks trading above their respective 40-day moving averages [DMAs]. It helps to identify extremes in market sentiment that are likely to reverse. To learn more about it, see my T2108 Resource Page. You can follow real-time T2108 commentary on twitter using the #T2108 hashtag. T2108-related trades and other trades are … Read more