
AT50 is an abbreviation of “Above the Fifty.” I use the term to refer to MMFI in TradingView.com which is a measure of market breadth. MMFI quantifies the percentage of stocks trading above their respective 50-day moving averages (DMAs) (red lines in my charts). Extremes in AT50 define overbought and oversold conditions in the stock market. On July 29, 2021 I switched from T2108 as AT40, or above the 40DMA to AT50. I used a correlation analysis to transfer the overbought and oversold thresholds from AT40 to AT50.
Market Breadth: Overbought and Oversold
AT50 identifies short-term “overbought” (above 70%) and “oversold” (below 20%) conditions in the stock market. Given the short-term nature of the analysis, AT50 mainly provides trading signals for swing traders. Long-term investors can use AT50 for timing buying opportunities to add to existing portfolios.
Overbought defines a market condition where buyers have crowded into a trade. There are few new buyers or new sources of funds to keep pushing a stock or index higher. Conversely, oversold defines a market condition where an extreme of traders and investors exit a stock or index. The remaining holders are the ones who are unwilling to sell at the bargain basement prices. In each case, overbought or oversold, trading becomes over-extended in one direction and odds favor an imminent reversal. When buying power exhausts itself, the path of least resistance goes to the sellers. Think of traders who want to lock in profits. When selling power exhausts itself, the path of least resistance goes to the buyers. Think of traders salivating at current prices as incredible bargains.
I consider the stock market overbought when AT50 trades above 70%. When AT50 trades below 20%, I consider the stock market oversold. In each case, so many stocks are above/below the threshold that little extra room exists for incremental buying/selling. In other words, as AT50 continues higher from the overbought threshold, buyers find fewer and fewer stocks at attractive prices. When AT50 continues lower from the oversold threshold, sellers are less and less interested in giving up their holdings at low prices.
Trading Rules for Overbought and Oversold Stock Markets
I developed short-term trading principles and rules from these basic observations. When the stock market is overbought, a trader generally should avoid initiating new long positions. A trader should start closing out existing short-term longs and consider short-term opportunities to go short. When the stock market is oversold, a trader typically should avoid initiating new short positions. A trader should start closing out existing shorts and consider opportunities to go long.
These trading rules are foundational, yet I always review the potential unique circumstances for any overbought or oversold period. I make these caveats clear in the prior T2108 Updates and the updated market breadth series using AT50.
Trading overbought conditions
The 2008-2009 financial crisis introduced an era of active central bank intervention that profoundly impacted trading dynamics in stock markets. Ample liquidity helps produce what I call “extended overbought rallies”. In these cases, the stock market remains overbought for many days and sometimes weeks. Thus, once AT50 goes overbought, I generally wait for AT50 to fall out of overbought conditions before considering shorting opportunities. I also consider shorting the stock market if AT50 rallies to but fails to close above the overbought threshold of 70%. In this case, I get bearish on the second lower close below the overbought threshold.
Trading oversold conditions
(See “How AT50 Market Breadth Extremes Shape S&P 500 Performance” for the latest analysis correlating AT50 with the performance of the S&P 500).
Oversold conditions are generally easier to trade than overbought conditions because, over time, the stock market “wants” to move higher. Moreover, the stock market cannot sustain fear over extended periods of time. The market tends to price in perceived risks and then move on. Thus, even long-term investors can use oversold trading conditions to increase the size of their portfolio.
There are two categories of trading oversold conditions: conservative and aggressive. In either case, the first major profit targets for short-term trades are set at the first appearance of significant resistance levels (usually a moving average like the 20, 50, or 200DMA).
Conservative oversold trading
- Buy AFTER AT50 exits oversold trading conditions.
- Benefit: avoids large losses during (rare) extended oversold periods.
- Drawback: limits upside (short-term) profit potential during downtrends and bear markets.
Aggressive oversold trading
- Start buying as soon as AT50 drops into oversold conditions: most oversold periods last just one or two days.
- Alternatively, after AT50 drops into oversold conditions wait to buy once the volatility index (VIX) experiences its first “significant’ down day off an extreme high.
- Start taking some profits upon the end of oversold trading conditions and before the first significant resistance levels.
- Benefit: maximizes upside (short-term) profit potential
- Drawback: exposes short-term positions to potentially extended losses during a bear market (in a bear market there are no supports!)
Duration and Performance During Oversold Periods
Most oversold periods last just one or two days. Thus, I tend to prefer the aggressive style of trading oversold periods. During bull markets, this approach is particularly effective. However bear markets present tricky challenges because they can cause oversold periods to last for extended periods of time and/or generate a sequence of oversold trading periods. The chart below provides an approximate guide to S&P 500 performance over the course of an oversold period (starting from the first oversold day and ending with the first day above the oversold threshold) (chart covers 2022 to 2023). The worst performing period was during the Great Financial Crisis. The 48 trading days from September 29, 2008 to December 4, 2008 delivered a gut-wrenching -20.8% performance for the S&P 500 during the oversold period.
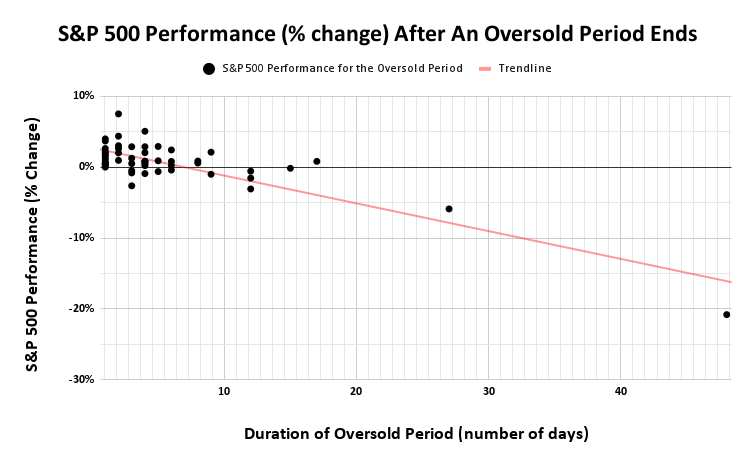
From 2002 to 2023 there were 56 oversold periods, 42 (75%) of which delivered positive S&P 500 returns during the oversold period. Only 7 (13%) periods lasted 10 days or more and only one of those delivered positive gains. The media duration of an oversold period is 3.5 days. The average duration of 5.4 days is heavily skewed by the extreme oversold periods.
Use and Validation of AT50 (T2108)
Traders can use AT50 as a strong complement to existing trading tools. For example, if the market is oversold, a trader can wait for a climactic sell-off, like a “hammer” candlestick or a bullish engulfing bottom, before making bullish trades. When the market is overbought, a trader might wait for a “blow-off top” before going short.
The Origins of AT50 as Market Breadth: the T2108 Trading Model
Over the years, I validated the T2108 thresholds as sufficiently definitive as trading signals. Starting in April, 2013, I began a complete overhaul of my usage of T2108 for trading that I called the T2108 Trading Model (TTM). In TTM, I used machine learning methods to project the likely performance of the S&P 500 depending on the number of days that T2108 spends above or below a threshold (and the performance of the S&P 500 during that time).
I also used machine learning methods to determine the odds of the S&P 500 bouncing back from at least two straight days of “intense” selling; a condition I call “quasi-oversold.” This modeling effort generated my first exhaustive compilation of T2108-related data and relevant relationships. On December 29, 2014, I implemented the first update of these data and analyses. Interested readers can click here to download the presentation (feedback welcome!).
I produced several refinements to the trading rules for AT50 (T2108) – some pre-overhaul, some post-overhaul. I have also refined strategies depending on the context of the trading environment. In the following section, I provide an updated list of the most important posts and their high-level trading rules listed in reverse chronological order with the most important posts listed in bold.
Trading Overbought Conditions
- “Key Overbought Signal Hit Historic Highs – A Bullish Sign For Stocks” – Seeking Alpha (June 9, 2020): Each period featuring 90%+ share of stocks trading above their respective 40DMAs featured a bullish rebound from a market sell-off, crash, and/or recession with the year ending with additional gains.
- “A Bearish Reversal for the Stock Market” (June 10, 2016): T2108 fell out of overbought conditions in dramatic fashion and created a bearish trading signal.
- “Overbought Status Finally Ends As the NASDAQ Teeters” (May 3, 2016): The end of an overbought period created a bearish trading signal.
- “New Trading Rules After Market Ends A 414-Day Overbought Drought” (March 1, 2016): A COMPLETE review of the trading rules for overbought conditions.
- “A Toppy Feeling In the Market Even As Individual Stocks Shine” (November 6, 2015): An example of the bearish signal created from a failure of T2108 to crack into overbought territory even as the S&P 500 continued to make (marginal) gains.
- “Overbought for A Hot Minute With Breakout Charts Galore” (November 21, 2014): Created conditional rules: bearish if the S&P 500 confirms a pullback from overbought conditions; bullish and buy the dips if the S&P 500 extends into overbought territory.
Trading Oversold Conditions
- “Tariff Crash Trading Plan: Chaos Edition – The Market Breadth” (April 8, 2025): Modified the tariff crash trading plan to accommodate official oversold conditions. Includes methods for dealing with substantial rallies following a bottoming signal.
- “How to Trade A Bear Market Intrusion On An Oversold Period – The Market Breadth” (October 28, 2023): Includes a review of the S&P 500’s performance after the end of an oversold period.
- “The Latest Oversold Period Ends With A JP Morgan Chase Bottom” (February 12, 2016): A COMPLETE review of trading oversold periods that includes using the volatility index, the VIX. This piece also looks at the difficulties presented by the frequent recurrence of oversold periods.
- “A Second Epic Oversold Period Over the Past Five Months” (January 20, 2016): T2108 makes a VERY rare drop into single digits, and I use the VIX AND currencies to help assess the trading opportunities for bottom-fishing. I included a very detailed list of trades at the time.
- “How To Profit From An EPIC Oversold Period” (August 24, 2015): A drop into single digits for T2108 in the wake of what turned out to be a flash crash. I provided detailed trading strategies for aggressive and conservative traders based on movements in the VIX and other signals.
The following video provides an example of how to trade oversold conditions. At the time AT50 was “close enough” to the oversold threshold of 20%. “Close enough” informally applies to strong bull markets.
AT50 (T2108) Data Refreshes
- “S&P 500 Performance During Overbought and Oversold Trading Conditions” (January 31, 2019): An update on T2108 historical data, durations of oversold/bought periods, mean/median durations, and the performance of the S&P 500 during oversold and overbought periods.
How to Trade Stocks Testing 50DMA Support
On August 19, 2023 I did a quick tutorial on how I use SwingtradeBot to trade stocks testing support at their 50DMAs.
Article Archives
Here is an archive of older studies from which I built most of my latest strategies. These studies still have relevance as historical analyses, but they are no longer “required” reading.
- Trading Strategies for an Overbought S&P 500 Using the Percentage of Stocks Trading Above Their 40DMAs (T2108) – an update to a similar analysis January, 2009, see below (November 6, 2011)
- Trade the Oversold Bounce (PDF file) – written for SFO (Stocks, Futures and Options) Magazine as a follow-up to my 2008 article discussing trading strategies using oversold indicators from T2108 and the VIX. (July, 2010)
- Using the Percentage of Stocks Trading Above Their 40DMAs (T2108) to Identify Overbought Conditions on the S&P 500 (January 4, 2009)
- Does the VIX Need to Spike at A Climactic Low? – Using T2108 and the VIX (July 7, 2008)
I also actively use T2107, the percentage of stocks trading above their respective 200DMAs, as a check on longer-term trends. T2107 does not have low or high thresholds from my analyses. On June 10, 2016, T2107 broke out of a post-recession downtrend in what looked like a bullish breakout. That breakout did not last long! (Click here for a definition of the “T2” series of Worden’s Market Indicators)
If you still have questions about T2108 or about using it for trading, feel free to contact me directly. I also highly encourage readers to subscribe to the email distribution list for this blog to get timely updates.
Be careful out there!