

Stock Market Commentary
A bear market intrusion upset the dynamics of this oversold period. The NASDAQ is back in bear market territory. Both the NASDAQ and the S&P 500 broke down below their respective 200-day moving averages (DMAs) (the blue line in the charts below) and entered “correction” territory which is 10% below the 52-week high. The iShares Russell 2000 ETF (IWM) fell to a near 3-year low. This toxic combination of bearishness threatens to extend the oversold period. Thus, the trading rules for the oversold period get more complicated. I discuss the changes later in the blog post.
An extremely strong report on Q3 GDP (Gross Domestic Product) delivered the biggest irony of the week. The bearish tone of the market completely drowned out the good news. GDP grew at 4.9%, even higher than “consensus” expectations for 4.2%. As a result, the consensus continues to struggle to understand today’s economy. Consensus underestimated GDP despite the consistently strong forecasts from the Atlanta Federal Reserve’s GDPNow which started the Q3 estimate at 3.5% on July 28th, sent it as high as 5.9% by August 24th, and effectively landed on 5.4% on October 17th.
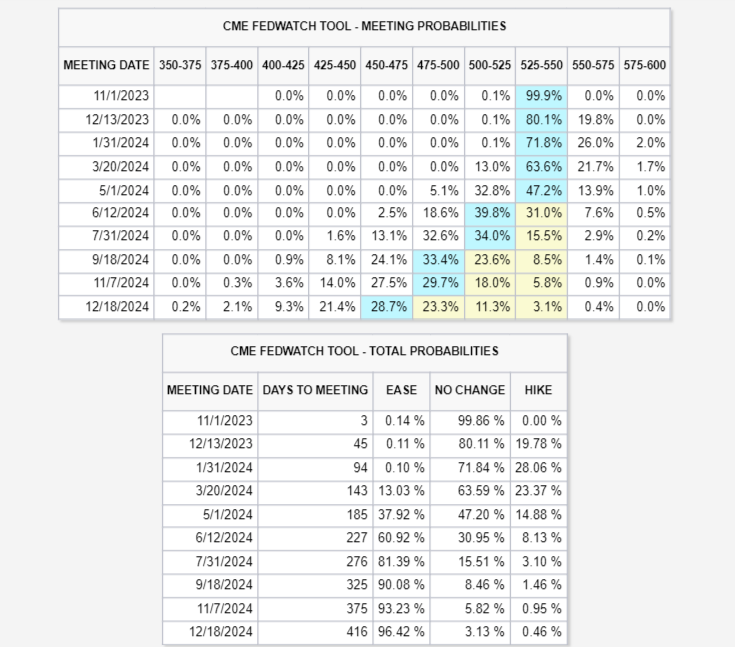
Of course, good news is bad news for a Wall Street hungry for lower interest rates. Fortunately for them, interest rates came down slightly after the report. Moreover, the Fed Fund futures continue to imply that the Fed will not hike rates further for this cycle. Still, the first rate cut is priced way out to June, 2024. The blue boxes in the table below show the most likely outcome for Fed rates (shown at the top of the column) for the given meeting date in the first column.
Dana Peterson from the Conference Board laid out the case for a potential hike in December and explained why, regardless, the Federal Reserve will have to maintain its hawkish rhetoric. The Conference Board also projects a shallow recession for the first quarter of 2024.
The Stock Market Indices
The S&P 500 (SPY) started last week with an ominous confirmation of the prior week’s 200DMA breakdown. Buyers generated false hope with a quick recovery on Tuesday which looked like the beginning of an anticipated oversold bounce. The signs looked promising especially given the index successfully tested support from the beginning price of the summer of loving stocks. However, sellers took over from there for the rest of the week. Sellers responded to Thursday’s strong Q3 GDP report by taking the S&P 500 down another 1.1%. The loss in turn confirmed a 200DMA breakdown.
The S&P 500 is now approaching important support dating all the way back to the May, 2021 low. Note in the chart below how this support line was an important launching pad for the summer of loving stocks.
")
The NASDAQ (COMPQ) is back in bear market territory. This observation seems to contrast with the tech-laden index’s 20.8% year-to-date gain. Yet, the observation aligns perfectly with the NASDAQ’s 200DMA breakdown on Thursday. Strong post-earnings reactions for Intel (INTC) (+9.3%) and Amazon.com (AMZN) (+6.8%) helped save the NASDAQ from confirming the breakdown. As a result, the index outperformed and gained 0.4% on the day. The 200DMA held firm as resistance at the intraday high.
Note below how the “NASDAQ trading bots” executed as expected by buying the first test of the bear market line. Unfortunately, they stepped aside on the second round!
")
The iShares Russell 2000 ETF (IWM) accelerated its downtrend. The ETF of small caps ended the week near a 3-year low. IWM is now trading well below the previous trading range defined by the bear market line at the top and the pre-pandemic high at the bottom. Needless to say my last speculation on IWM call options failed. I am now content to leave IWM alone until, perhaps, this oversold period ends.
")
The Short-Term Trading Call With a Bear Market Intrusion
- AT50 (MMFI) = 15.6% of stocks are trading above their respective 50-day moving averages (6th oversold day)
- AT200 (MMTH) = 23.8% of stocks are trading above their respective 200-day moving averages
- Short-term Trading Call: bullish
AT50 (MMFI), the percentage of stocks trading above their respective 50DMAs, plunged to 15.6%, the lowest close since the oversold period that started the month. This oversold period is now 6 days long. The more bearish the market environment, the longer oversold periods tend to last. Given the volatility index (VIX) failed to break out much less close above the high for the month, I suspect this bear market intrusion of the oversold period has not quite yet hit a crescendo.
Accordingly, I am not ready to go back to aggressively buying this oversold period despite my short-term bullish trading call. Instead, I am waiting to buy aggressively (including selling expensive put options) on the next breakout of the VIX and/or buy once this oversold period comes to an end (which is actually the conservative approach to trading oversold periods). The profits I made last week on flipping shorts and puts after stock-specific catalysts was quite telling.
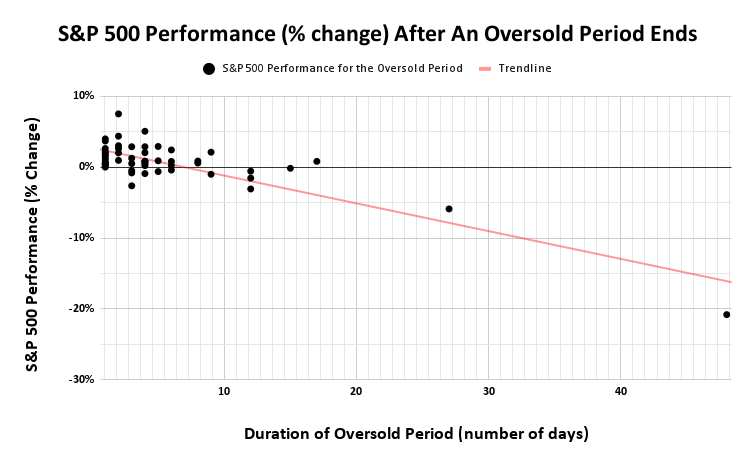
The chart below shows a loose correlation between the length of an oversold period and the S&P 500’s performance during that period measured from the close of the first oversold day to the close of the first day after the oversold period ends (using data since 2002). For the typical 1 or 2 day oversold periods (40% of the 55 oversold periods), the S&P 500 emerges with gains, sometimes substantial. Starting with 3-day long oversold periods, the S&P 500 can emerge with negative performances (overall, the S&P 500 emerges from an oversold period with a gain 76% of the time). After 10 days, only 1 of 7 oversold periods have emerged with gains for the S&P 500. The two big outliers are from December 4, 2008 (the Great Financial Crisis) at 48 days and April 13, 2020 (the COVID-19 pandemic) at 27 days.
The CNN Fear and Greed Index has yet to fall below the extreme fear from the last oversold period. So this index gives me yet one more reason to brace for lower prices before this oversold period bottoms out.
Even if the market goes yet lower, the historical patterns say this is a time to start buying the seasonal October sell-off. The S&P 500 has now suffered a 4.0% drawdown in October. I anticipated this drawdown at the end of September based on the historical patterns of the stock market’s worst three months of the year. The current drawdown has surpassed the 3.2% average maximum drawdown for the month (and the 2.1% median).
After Thursday’s carnage, I created an extended “show and tell” video to go into detail on the bearish signs in the market. I also used swingtradebot to scan for the few stocks that look strong enough to buy right now.
A week ago I noted the bearish implications of the post-earnings breakdown in Tesla (TSLA). Now Apple Inc (AAPL) has added its bearish red flag with a 200DMA breakdown. When AAPL last closed below this important long-term trendline, the stock quickly rebounded as part of the counter-sentiment move from the regional banking crisis. With earnings coming up this week, I worry that AAPL is set up for a big fall. The stock will be my #1 hedge against bullishness. I am starting the week long a QQQ calendar call spread.
")
My favorite generative AI play suffered a major setback last week. Alphabet Inc (GOOG) lost 9.6% post-earnings and closed the week with a fill of July’s post-earnings gap up. Once again, the market proves it has no idea what to think. This time around weaker than expected cloud results had sellers stampeding. With the stock forming a hammer-like bottoming pattern, I sold short a put spread expiring this Friday. I am also ready to buy call options on a test of 200DMA support.
")
Align Technology, Inc (ALGN), the makers of Invisalign, had a very bad week. Just like Invisalign aligners straighten teeth, investors decided to ‘realign’ ALGN with a 28.9% post-earnings loss. ALGN flunked its own Smile Quiz on this one. The stock last closed this low in mid-December, 2022. All the gains from 2023 are gone with a frown.
")
Coinbase Global, Inc (COIN) had a trading week that provided a stark reminder of the market’s bias for lower prices. COIN soared as much as 15.8% on Tuesday before closing the day with a 6.3% gain. I was a little late in recognizing the market’s over-reaction to the fresh excitement over SEC approval of a Bitcoin ETF. While Bitcoin may sustain higher prices on such an ETF, Coinbase will likely lose business as an ETF offers a cheaper and more convenient way to trade Bitcoin (BTC/USD). I flipped a COIN put option the next day and left a lot of money on the table (I also reduced profits with a parallel call spread I used as a hedge). COIN ended the week nearly testing 200DMA support with a 20.8% loss from the week’s intraday high.
")
Fastenal Company (FAST) is one of the few good-looking stocks on my shopping list. The Minnesota-based distributor of industrial and construction supplies broke out to a near 2-year high thanks to a 7.5% post-earnings surge. Sellers took over from there until FAST stabilized at 20DMA support (the dotted line below). I will buy FAST on the next higher close in anticipation of an eventual fresh breakout.
")
")
")
Be careful out there!
Footnotes
Subscribe for free to get email notifications of future posts!
“Above the 50” (AT50) uses the percentage of stocks trading above their respective 50-day moving averages (DMAs) to measure breadth in the stock market. Breadth defines the distribution of participation in a rally or sell-off. As a result, AT50 identifies extremes in market sentiment that are likely to reverse. Above the 50 is my alternative name for “MMFI” which is a symbol TradingView.com and other chart vendors use for this breadth indicator. Learn more about AT50 on my Market Breadth Resource Page. AT200, or MMTH, measures the percentage of stocks trading above their respective 200DMAs.
Active AT50 (MMFI) periods: Day #5 under 20% (6th oversold day), Day #29 under 30%, Day #39 under 40%, Day #53 under 50%, Day #58 under 60%, Day #61 under 70%
Source for charts unless otherwise noted: TradingView.com
Full disclosure: long QQQ calendar call spread, short GOOG put spread, long SPY call
FOLLOW Dr. Duru’s commentary on financial markets via StockTwits, Twitter, and even Instagram!
*Charting notes: Stock prices are not adjusted for dividends. Candlestick charts use hollow bodies: open candles indicate a close higher than the open, filled candles indicate an open higher than the close.