
(T2108 measures the percentage of stocks trading above their respective 40-day moving averages [DMAs]. It helps to identify extremes in market sentiment that are likely to reverse. To learn more about it, see my T2108 Resource Page. You can follow real-time T2108 commentary on twitter using the #T2108 hashtag. T2108-related trades and other trades are occasionally posted on twitter using the #120trade hashtag. T2107 measures the percentage of stocks trading above their respective 200DMAs)
T2108 Status: 61.6% (ends 4 days in overbought territory)
T2107 Status: 64.9%
VIX Status: 17.0 (a 16.3% 1-day gain!)
General (Short-term) Trading Call: bearish
Active T2108 periods: Day #83 over 20%, Day #82 over 30%, Day #79 over 40%, Day #13 over 50%, Day #12 over 60%, Day #1 under 70% (ending 4 days overbought)
Commentary
Thursday was a close call, Friday was a full out bearish reversal.
Given the open, no surprise that %stocks>40DMA is below overbought threshold again (70%). $SPY will likely close bearish today. #T2108
— Dr. Duru (@DrDuru) June 10, 2016
T2108, the percentage of stocks trading above their 40-day moving averages (DMA), suffered a huge blow as it tumbled from overbought territory and closed at 61.6%. This move ended four days in overbought status. My T2108 trading rules dictate a bearish trading call whenever T2108 ends overbought status or confirms a failure to enter overbought status. Recent history alone shows how swiftly selling can unfold after such moments.
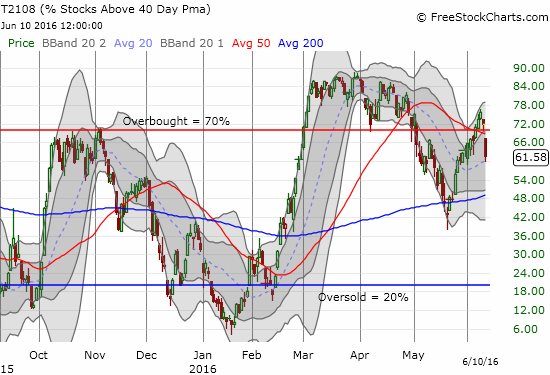
This moment is particularly ominous because T2107, the percentage of stocks trading above their 200DMAs, JUST broke out from a post-recession downtrend. Now, that breakout may turn out to be a fake-out.
The immediate damage on the S&P 500 (SPY) is mixed. The index lost less than 1%, but it did close marginally lower than the day of the jobs report. The drip-drip in the upward trending channel through the upper-Bollinger Bands (BBs) is over. The uptrending 20 and 50DMAs await opportunities to provide support.
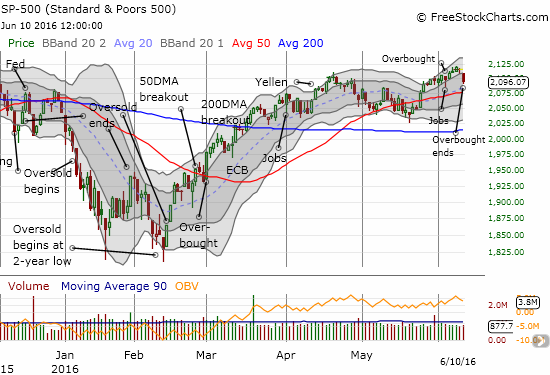
Our local friendly Federal Reserve updates monetary policy on June 15th and could provide the timely assistance the market seeks. While there is a zero chance the Fed will hike rates at this meeting, the tension should still be high. Economic fears are running high again since the poor May U.S. jobs report. Futures have pushed the next rate hike out to December and bond yields are plunging all over again. The German 10-year hit a new record low at an astonishing 0.011%. Negative territory seems very likely.
The irony here could not get thicker. If the Fed continues to expresses enough confidence in the economy to affirm earlier hawkish commentary, the market will likely continue its sell-off. If the Fed once again gives in to the market’s fears, reassured traders and investors will express their relief by getting back to business buying all the “bargains” that recent selling has created.
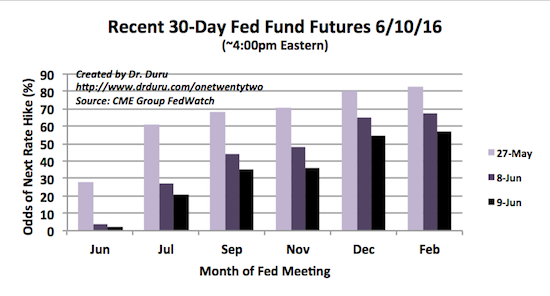
Source: CME Group FedWatch
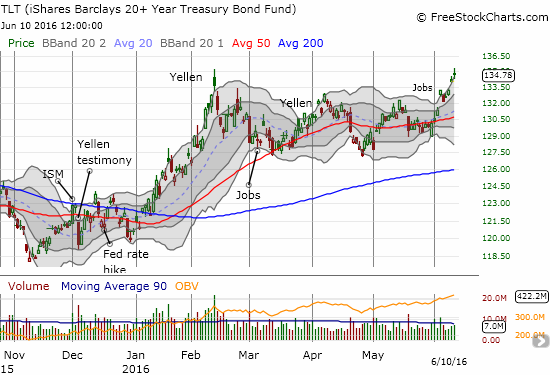
The ironies abound to see how TLT has RALLIED since the Fed implemented its first rate hike. It is as if the market is saying that one rate hike has put the entire economy in peril. Note that I sold my latest TLT call options on Thursday thinking that the small fade from highs indicated another “gap and crap” move.
Volatility is suddenly soaring into the Fed meeting. The VIX gained a whopping 16.3%. I am honestly astounded by my good fortune on the timing of my recent purchase of call options on ProShares Ultra VIX Short-Term Futures (UVXY). As a reminder, here is what I said to justify the purchase even though my short-term trading call at the time was “cautiously bullish” (I aptly titled the post “Sudden Uncertainty”):
“I do not have to turn bearish to see this picture and wonder aloud whether this complacency is far too high (the VIX far too low). It is definitely possible that the market is under-pricing risk because it now expects the Fed to leave rates alone until at best the end of the year. Yet, time and again, the VIX has failed to stay at these levels for long. The risk/reward balance has shifted toward betting on an increase in volatility even if the S&P 500 maintains its generally bullish stance by holding support at its 50DMA or even holding the low of the current trading range.”
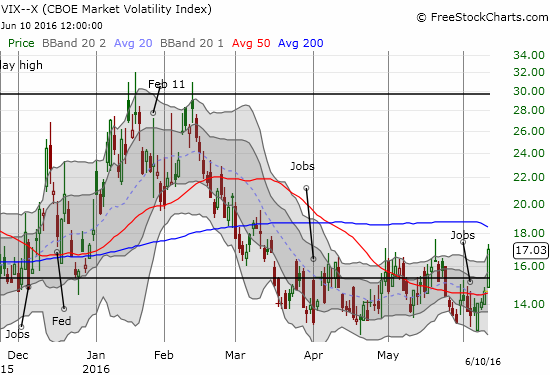
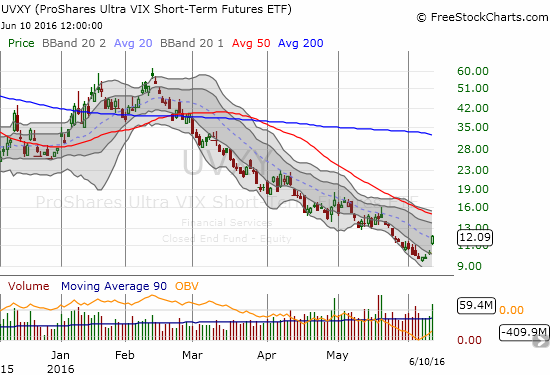
My UVXY call options do not expire until September, but I will very likely lock in the profits on Monday where I expect another gap up in volatility. I have two trading rules working against holding the call options for much longer: 1) I tend to sell options if I get at least a double within days of purchase, 2) the Fed meetings generally soothe markets and work against volatility. Given #2, I am keen to initiate my anti-volatilty pre-Fed trade. I will put this trade on either near Tuesday’s close or first thing Wednesday morning right before the Fed’s announcement. Recall that conventional practice sets 20 on the VIX as the threshold to indicate elevated market fear.
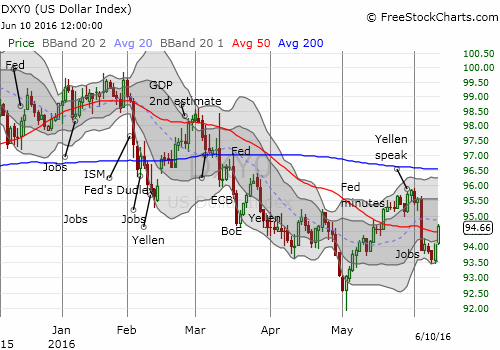
The rise in volatility and drop in interest rates has accompanied a recovery for the U.S. dollar index (DXY0). I think the recent bounce confirms the dollar’s bottom in May as the rise in fear makes the greenback look better relative to a lot of currency alternatives. It is too early to speculate on whether the dollar can gain enough momentum to breach the last high. The Fed may be the ultimate wildcard on that.
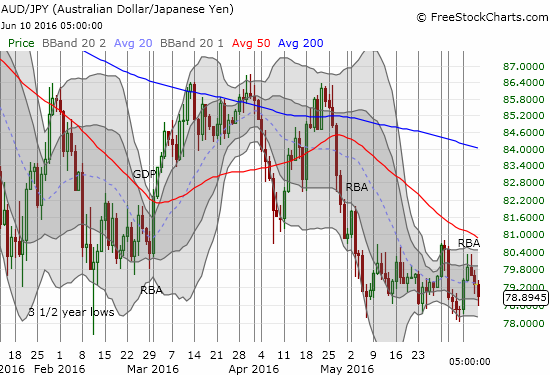
The Australian dollar (FXA) versus the Japanese yen (FXY) is still in a bearish position. A fresh low would confirm a bearish trading call for financial markets.
In total, this trading action convinced me I do not need to append “cautiously” to my shift to a bearish trading stance. I think the tone is now set for the summer. Even if markets churn for the rest of the way, I think risk/reward will favor fading rallies rather than buying dips. The shift from bullish to bearish will be rough. As an example, Friday was a telling mix of trades. I started with some bullish moves which could (should?) be my last for a while: I finished my plan to get back on the home builder trade with call options on iShares U.S. Home Construction ETF (ITB). I thought I was taking advantage of an opportune dip. I also got into my trade on call options for Freeport-McMoRan Inc. (FCX) to play what I hope to be a continued pivot around its 50DMA. I even finished building a long position on Verifone (PAY) which is a play for a presumed imminent post-earnings recovery at least back to the lower-BB. In coming days, and maybe weeks, I will be looking to unwind almost all my bullish trading positions.
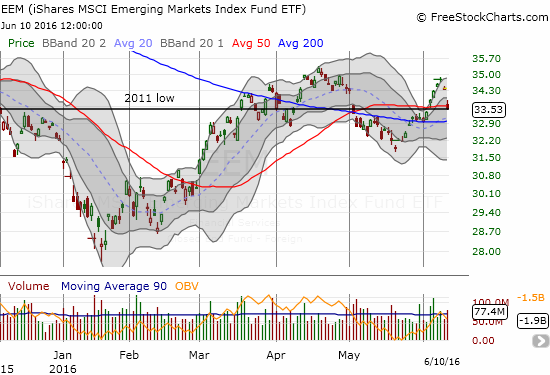
As the bearish case unfolded for the day, I decided to hold onto all my bearish trades except one: the iShares MSCI Emerging Markets ETF (EEM). EEM sank 2.5% and closed right on top of converged support at its 2011 low and its 50DMA. The profits on my out-sized put position well exceeded the cost of the call options, so I felt comfortable taking this position off the table even though I lined up the trade for July expiration. Moreover, I still have EEM put options at a $32.50 strike expiring this coming Friday. These are left-over from a rare “solo” purchase at the end of May. These puts could at least go breakeven if EEM continues to sell-off in the coming week. Needless to say, I will be ready to fade any and all subsequent rallies in EEM.
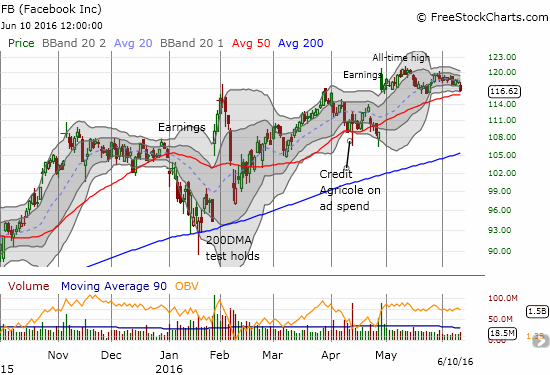
I will not spend too much more time on other stock charts until we get through the Fed meeting. Past T2108 Updates already include plenty of good bearish trade ideas that still apply now. Facebook (FB) is one chart I have not examined in a while that deserves close monitoring no matter what happens with the Fed this week. FB’s chart shows a definitive topping pattern. FB printed an impressive gap up after its last earnings but has failed to sustain any further momentum. The last brief rally failed to generate a new all-time high. Friday’s selling makes a 50DMA breach look imminent. Also note how trading volume has fallen off a cliff ever since earnings. FB is a market darling, so a failure to sustain momentum is a warning sign. A breakdown that confirms a topping pattern would be a loud alarm bell…
— – —
Reference Charts (click for view of last 6 months from Stockcharts.com):
S&P 500 or SPY
U.S. Dollar Index (U.S. dollar)
EEM (iShares MSCI Emerging Markets)
VIX (volatility index)
VXX (iPath S&P 500 VIX Short-Term Futures ETN)
EWG (iShares MSCI Germany Index Fund)
CAT (Caterpillar).
IBB (iShares Nasdaq Biotechnology).
Daily T2108 vs the S&P 500
")
Black line: T2108 (measured on the right); Green line: S&P 500 (for comparative purposes)
Red line: T2108 Overbought (70%); Blue line: T2108 Oversold (20%)
Weekly T2108

*All charts created using freestockcharts.com unless otherwise stated
The charts above are the my LATEST updates independent of the date of this given T2108 post. For my latest T2108 post click here.
Related links:
The T2108 Resource Page
Expanded daily chart of T2108 versus the S&P 500
Expanded weekly chart of T2108
Be careful out there!
Full disclosure: net long the U.S. dollar, long EEM puts and calls, short AUD/JPY, long UVXY call options, long PAY, long ITB call options, long FCX call options