
(T2108 measures the percentage of stocks trading above their respective 40-day moving averages [DMAs]. It helps to identify extremes in market sentiment that are likely to reverse. To learn more about it, see my T2108 Resource Page. You can follow real-time T2108 commentary on twitter using the #T2108 hashtag. T2108-related trades and other trades are occasionally posted on twitter using the #120trade hashtag. T2107 measures the percentage of stocks trading above their respective 200DMAs)
T2108 Status: 70.8% (overbought for the first time in 414 trading days!)
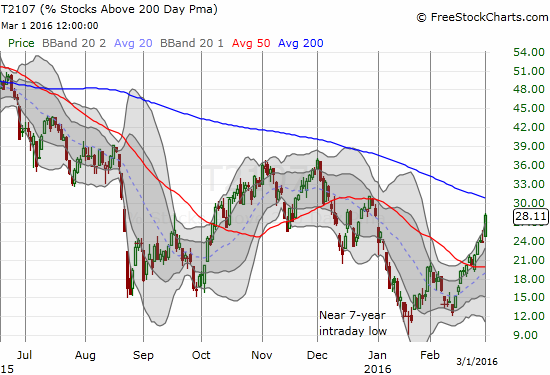
T2107 Status: 28.1% (new high for 2016)
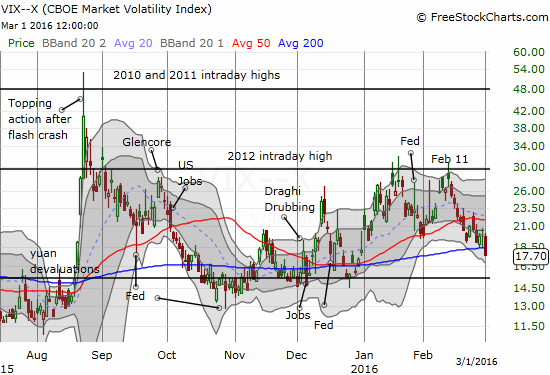
VIX Status: 17.7 (cracked below 200DMA)
General (Short-term) Trading Call: bullish
Active T2108 periods: Day #11 over 20%, Day #10 over 30%, Day #7 over 40%, Day #4 over 50%, Day #2 over 60% (only spent the first day in the 60s! Ended 72 days under 60%), Day #1 over 70% (ending a record-beating 414 days under 70%!!!) (overbought)
Commentary
FINALLY. %stocks>40DMA is above overbought threshold (70%). It has been over 400 trading days since the last overnight CLOSE. #T2108 $SPY
— Dr. Duru (@DrDuru) March 1, 2016
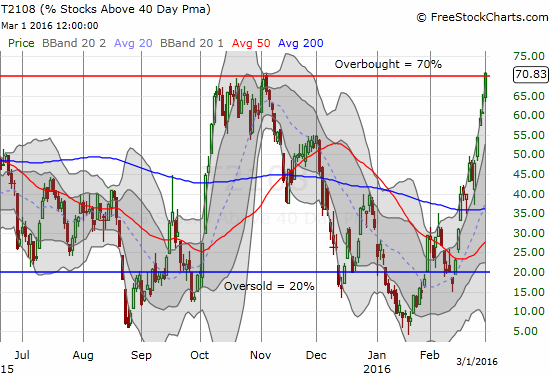
To be exact, T2108, the percentage of stocks trading above their respective 40-day moving averages (DMAs), went 414 trading days avoiding a close in overbought territory. T2108 just barely closed above the overbought threshold with a 70.8% finish.
As a reminder, here is the context for this historic 70% underperiod…
T2108 last closed above overbought territory way back on July 3, 2014. From that day to today, the S&P 500 (SPY), amazingly enough, has stayed the same: a -0.3% change. This zero move is exactly what I would expect based on the history above. This performance also means that a trader could have beaten the market by selling the S&P 500 when T2108 dropped from overbought status and then accumulating only during oversold periods. Of course, that investment chain has the great benefit of hindsight. Note that the steady decline in T2108 from the last all-time high in May, 2015 was an increasingly loud warning even as the S&P 500 churned in a tight (but widening) range until the breakdown of the August angst. For example, see my T2108 Update from August 5, 2015 titled “The “Fleckenstein Indicator” Flashes Bright Red.”
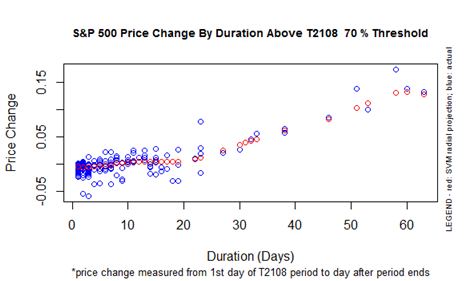
The trading rules for overbought conditions are more difficult than the rules for trading oversold conditions. When the market is oversold, I trade with the assurance that oversold conditions will end in due time and deliver gains from accumulated positions on the S&P 500. No straightforward theoretical limit or constraint holds for overbought conditions. The chart below emphasizes this point. In particular, once T2108 passes the 25-day mark in the overbought period, a truly bullish run-up can erupt. In near linear fashion, the longer the overbought period lasts, the more the S&P 500 gains.
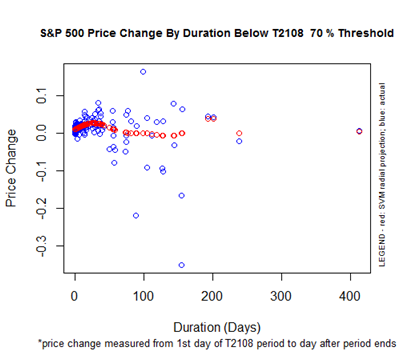
In an oversold period, sellers invariably exhaust themselves. In overbought periods, buyers can continue pressing the market for very long stretches of time without exhaustion. This fuzzy constraint is even more poignant in this era of central bank intervention that has created a financial world awash in liquidity. So, context is extremely important in assessing the rules for overbought trading. The current context features a market that has suffered a major technical breakdown after a series of oversold periods since August. Many 40DMAs are still in decline. Overbought conditions could continue for quite some time before these healing stocks get stretched the upside on an individual basis.
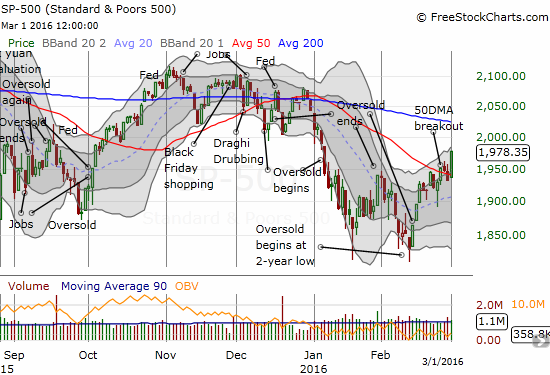
Fortunately, the S&P 500 (SPY) provides some immediate guidance for short-term rules. The index gained 2.4% to confirm a 50DMA breakout AND the W-bottom from the January and February intraday lows. Last week’s close above 50DMA resistance was the first since December 29, 2014 (the final end of the Santa Claus rally). This is a very bullish move that signals overbought conditions should NOT be sold yet. IF from here the S&P 500 closes BELOW 50DMA support AND T2108 drops “significantly” out of overbought territory, I will flip the trading call to bearish. I need to see T2108 drop from overbought conditions on this rule because it will confirm broad participation in the pullback. I am also very wary of whiplash from the S&P 500 pivoting around its 50DMA. Recall that bullish divergence helped convince me that this rally has broad support despite some unconvincing moves in the S&P 500 including the pullback UNDER 50DMA support just yesterday (February 29, 2016). I am not expecting this broad support to evaporate easily.
Absent an immediate failure of support, the next upside target is the now declining 200DMA. I realize this target is nothing to get excited about: at 2025 this target is only a 2.4% gain away. If the S&P 500 tests 200DMA resistance, then I switch my trading call to bearish on the next pullback even if T2108 remains overbought.
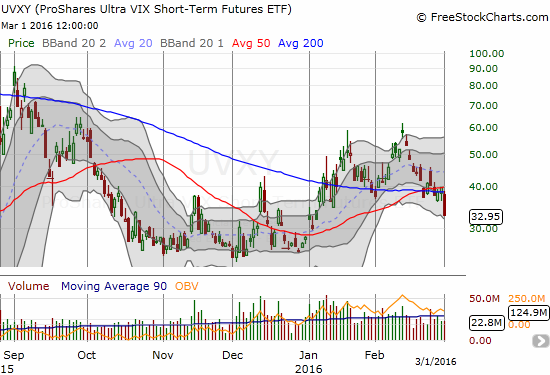
The volatility index, the VIX, confirmed this bullish turn in events. The VIX cratered below its 200DMA and left the ProShares Ultra VIX Short-Term Futures (UVXY) floundering with a major breakdown below 50 and 200DMA supports. Those multiple failures to break through resistance from the 2012 intraday high turned into very bullish signs.
T2107, the percentage of stocks trading above their respective 200DMAs, also sent positive vibes. T2107 soared to its highest level of 2016. That move erases a LOT of pain and greases a lot of buy buttons. If more and more stocks rise above their long-term trendlines, I expect to find a positive feedback effect on market sentiment.
I next turn to the currency markets for confirmation. At the close of U.S. trading, the Australian dollar (FXA) versus the Japanese yen (FXY) was stubbornly uncooperative. AUD/JPY rallied but it stopped short of breaking out of the recent trading range. It took the Q4 GDP report from Australia to do the honors of a bullish breakout.
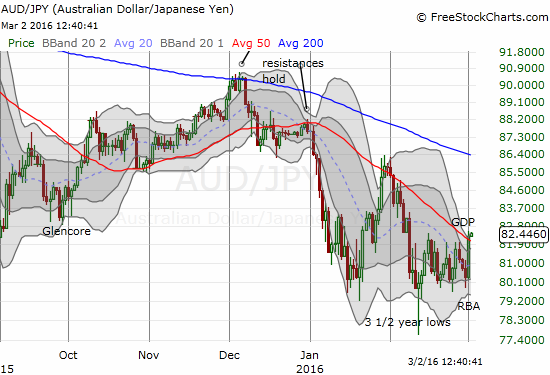
The GDP report follows a statement on monetary policy from the Reserve Bank of Australia (RBA) that said nothing new and was still biased toward dovishness (accomodation). AUD/JPY last bottomed following the RBA’s statement.

On a day like this, there are plenty of bullish charts to choose from. I will just zero in on three: two bullish charts and a bearish one.
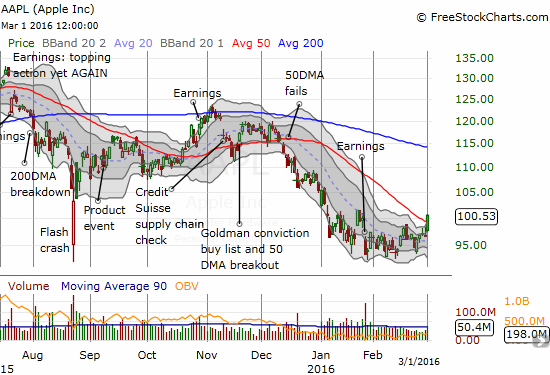
Apple (AAPL) is waking up. The stock managed a 4.0% gain that well out-paced the market like the “old days.” AAPL accomplished multiple feats: it filled the post-earnings gap down, it broke through 50DMMA resistance, AND the stock logged a 5-week high. If AAPL confirms this breakout with more buying, the stock will look like it spent the first two months of 2016 creating a bottom by consolidating a firm base.
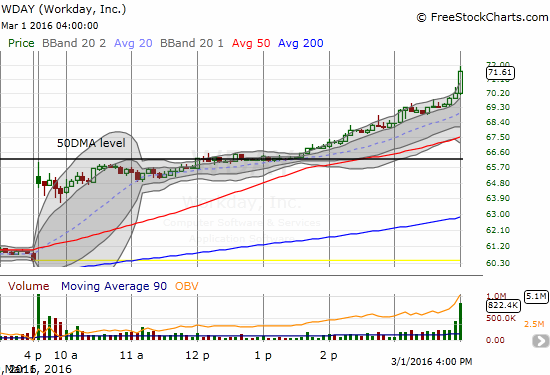
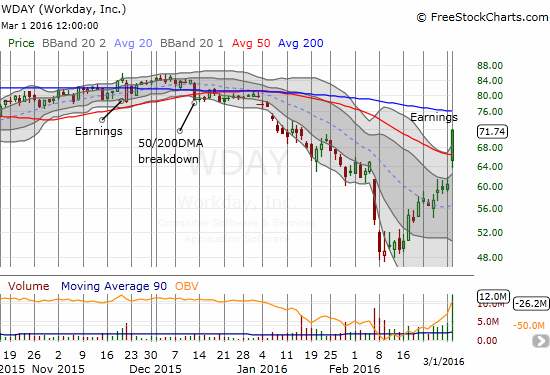
Workday (WDAY) put on a fantastic display of post-earnings bullishness that I misread when it stalled around 50DMA resistance. The stock gapped up over 7% and stalled around 50DMA resistance until around 1:35pm Eastern. At that point, WDAY took off. The stock crashed through 50DMA resistance and tacked on another 9 percentage points!
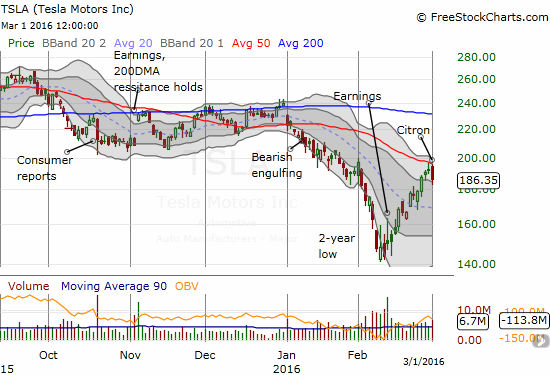
Tesla Motors (TSLA) managed to go in reverse. Thanks to a timely negative piece from Citron Research, TSLA pulled back sharply from 50DMA resistance with a 2.9% loss. Rather than follow the stock lower, I actually decided to play a reversal of the initial quick-trigger response. Needless to say, more selling from here will confirm 50DMA resistance AND break the steep uptrend from 2-year lows.
Finally, the market expressed a bit more confidence in economic conditions by moving the odds for the next rate hike to November from December. The odds for a rate hike in November are now at 51% and December has gone up to 62%. See “A Cascade of Impacts from Rate Hike Expectations Planted Back In 2016” for a complete review of the significance of an earlier timetable for rate hikes.
— – —
For readers interested in reviewing my trading rules for T2108, please see my post in the wake of the August Angst, “How To Profit From An EPIC Oversold Period“, and/or review my T2108 Resource Page.
Reference Charts (click for view of last 6 months from Stockcharts.com):
S&P 500 or SPY
U.S. Dollar Index (U.S. dollar)
EEM (iShares MSCI Emerging Markets)
VIX (volatility index)
VXX (iPath S&P 500 VIX Short-Term Futures ETN)
EWG (iShares MSCI Germany Index Fund)
CAT (Caterpillar).
IBB (iShares Nasdaq Biotechnology).
Daily T2108 vs the S&P 500
")
Black line: T2108 (measured on the right); Green line: S&P 500 (for comparative purposes)
Red line: T2108 Overbought (70%); Blue line: T2108 Oversold (20%)
Weekly T2108

*All charts created using freestockcharts.com unless otherwise stated
The charts above are the my LATEST updates independent of the date of this given T2108 post. For my latest T2108 post click here.
Related links:
The T2108 Resource Page
Expanded daily chart of T2108 versus the S&P 500
Expanded weekly chart of T2108
Be careful out there!
Full disclosure: long SSO shares, long SVXY shares, short AUD/JPY, long TSLA call option