
I have heard you loud and clear: it is time to part ways with the T2108 brand.
T2108 is a daily technical indicator provided by TC2000, a stock charting program created by Worden Brothers, Inc. T2108 represents the percentage of stocks trading above their respective 40-day moving averages (DMAs). My former trading mentor, TraderMike (now of SwingTradeBot.com), introduced me to T2108 around 2001 as a way of measuring oversold and overbought trading conditions in the stock market. Starting on May 10, 2011 I started writing the “T2108 Update” to formalize my approach to using T2108 and to create a specific space in the financial blogosphere for traders to learn about and track my favorite technical indicator. Lately, I have heard feedback that, essentially, the term is too mysterious and even confusing. This feedback is timely as for several years I have considered overhauling the branding. The time is now.
So, going forward, I will give my posts about T2108 the title “Above the 40.” My objective is clarity. The number 40 refers directly to the essence of the indicator, the 40DMA. “Above” refers to the direction of the measurement. In parallel, I will greatly reduce my use of the term T2108. While I will still use the term for continuity with my archives and tagging, I will mainly refer to T2108 as “AT40” (Above The 40). Similarly, I will rename T2107, the percentage of stocks trading above their respective 200DMAs, as “AT200.” I realize this may look like I am exchanging one set of arcane numbers and letters for another set, but I still need to be brief with these symbols.
I also like “Above the 40” as an allusion to the 40th parallel north. Eureka, California (in the U.S.A.) sits directly above the 40th parallel north at latitude 40.8 degrees north. Eureka means “I found it!” The word refers to the excitement of a discovery or invention. This definition perfectly expresses my feeling when I began the journey of formalizing the analysis of T2108, now AT40. Coincidently and conveniently, Omaha, Nebraska also sits just above the 40th parallel north at latitude 41.3 degrees north. Omaha of course is the home of the Oracle of the financial world, Warren Buffett.
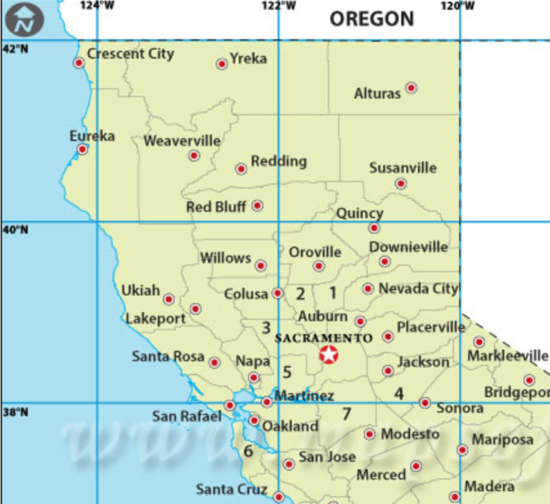
Source: Maps of World
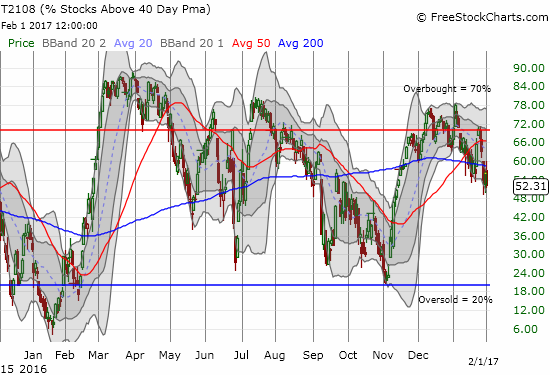
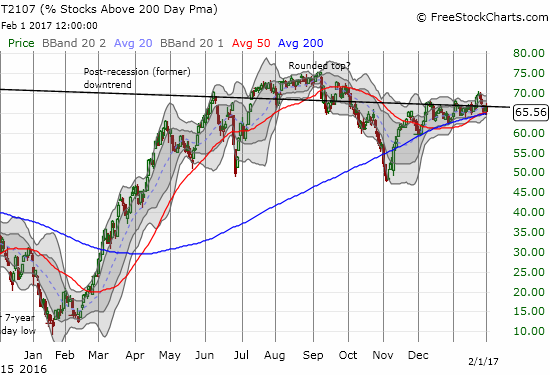
Source: FreeStockCharts.com
Hi Dr Dru,
How many years back using TC2000 can you get the number for AT40/T2108
I have data until mid 2013, but want to go earlier.
I understand there is a bar limit on TC2000 so am wondering if as of now how far it goes back.
Thanks, Frank
There are indeed limits. I use FreeStockCharts and the limits are even tighter there. However, I have been saving the data for a very long time and collected the entire archive back to 1986 when it was available. Go to my contact page for my email address and send me a message with what you need and how you have been able to use the data you do have.
Thanks for reading!