Follow-Through Trades: A Classic Bounce from Oversold Conditions

The Follow-Through: Bounce Stock market traders delivered a classic bounce from oversold trading conditions. The S&P 500 (SPY) confirmed a picture-perfect test of support at its 50-day moving average (DMA). The NASDAQ (COMPQX) pulled off a picture-perfect toe tap of its lower Bollinger Band (BB). The iShares Trust Russell 2000 Index ETF (IWM) confirmed a … Read more

Declining Market Breadth Resolved Into An Oversold Trading Period – Above the 40 (July 19, 2021)

Stock Market Commentary Unlike the months long process of declining market breadth, the resolution into an oversold trading period came swift, fast, and in a hurry. I thought my wait for an oversold trading period would last more days and weeks. Instead, a further plunge in market breadth combined with other important price signals to … Read more

How Declining Market Breadth Delivered A Beating On Stocks – Above the 40 (July 16, 2021)

Stock Market Commentary The stock chickens have come to roost on declining market breadth. The stock market indices still generally appear fine, but an ever growing swath of individual stocks have fallen further and further behind. Last week in particular, sellers delivered an extended beating on individual stocks. The signs of waning confidence in the … Read more

The S&P 500 Broke Down Just As the Stock Market Hit Extremes – Above the 40 (May 12, 2021)

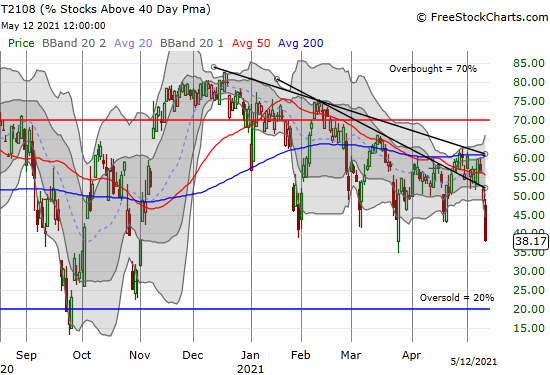
AT40 (T2108) plunged from 59.7% to 38.1% in 3 days for its lowest close in 6 months.

Stock Market Commentary The S&P 500 (SPY) finally broke down and succumbed to the selling pressure building up in the stock market. A “surprise” surge in inflation as measured by the Consumer Price Index (CPI) delivered the headline catalyst for a day of broad-based selling. Given market breadth was already in the process of narrowing, … Read more

Fades and Breakdowns Contradict The Calm of the S&P 500 – Above the 40 (May 7, 2021)

Stock Market Commentary The stock market is a cauldron of contradictions and divergences. Breakdowns below key support levels abound. Stocks suffer post-earnings fades even after companies report strong results, especially in both beaten up growth stocks and resilient big cap tech. Yet, the S&P 500 just rises above the steady erosion of market breadth with … Read more

Stock Market Almost Overbought After Sweeping Away Bearish Signals – Above the 40 (February 5, 2020)

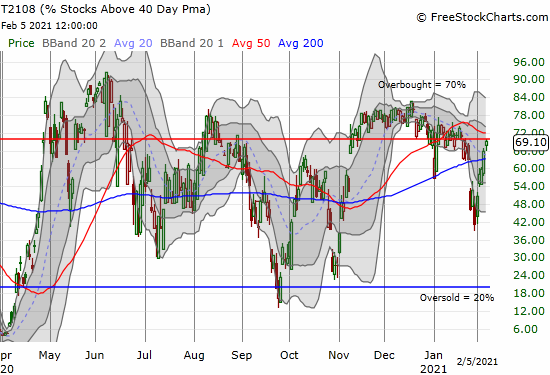
In a major display of buying power, AT40 (T2108) surged from 41% to 69% in just a week's time.

Stock Market Commentary Sellers beat a hasty retreat from the stock market as another bearish signal enjoyed a fleeting existence. The last bearish period lasted about three days. The previous bearish period barely survived a day. The stock market’s ability to quickly wipe away bearish signals is impressive. The buying force over the last week … Read more

Bearish Indices and Bullish Reopen Stocks Create Abrupt Rotation – Above the 40 (November 9, 2020)

AT200 (T2107) surged 10 percentage points to close near a 3-year high and a breakout above the post financial crisis downtrend.

Stock Market Statistics AT40 = 67.8% of stocks are trading above their respective 40-day moving averages (DMAs) (high of 75.1%) AT200 = 63.6% of stocks are trading above their respective 200DMAs (near 3-year high and breakout above post financial crisis downtrend) VIX = 25.8 (as low as 22.4) Short-term Trading Call: neutral Stock Market Commentary … Read more

A Stock Market Almost Oversold On Broad-Based 50DMA Breakdowns

AT40 (T2108) gapped down from 40% and closed at 25.3%.

The week started with key support at the 50-day moving average (DMA) giving way for the S&P 500 (SPY). The meltdown started into a crescendo today with 50DMA breakdowns across indices. The selling was swift enough to drive my favorite technical indicator close to oversold levels. AT40 (T2108), the percentage of stocks trading above their … Read more

An Indicator of Stock Market Breadth Nears An Important Milestone

The stock market convincingly followed through on last week’s bullish divergence that indicated strengthening stock market breadth. At the time of the bullish divergence, AT40 (T2108), the percentage of stocks trading above their respective 40-day moving averages (DMAs), powered higher even as the S&P 500 (SPY) lost 1.0%. The index also suffered a 50DMA breakdown. … Read more

The Stock Market’s Garden Grows More Weeds In Sell-Off – Above the 40 (September 8, 2020)

Stock Market Statistics AT40 = 42.5% of stocks are trading above their respective 40-day moving averages (DMAs) (2-month low)AT200 = 42.1% of stocks are trading above their respective 200DMAs (2 1/2 week low)VIX = 31.5Short-term Trading Call: cautiously bearish Stock Market Commentary The swift stock market sell-off took a fresh turn for the worse. AT200 … Read more