Stock Market Commentary:
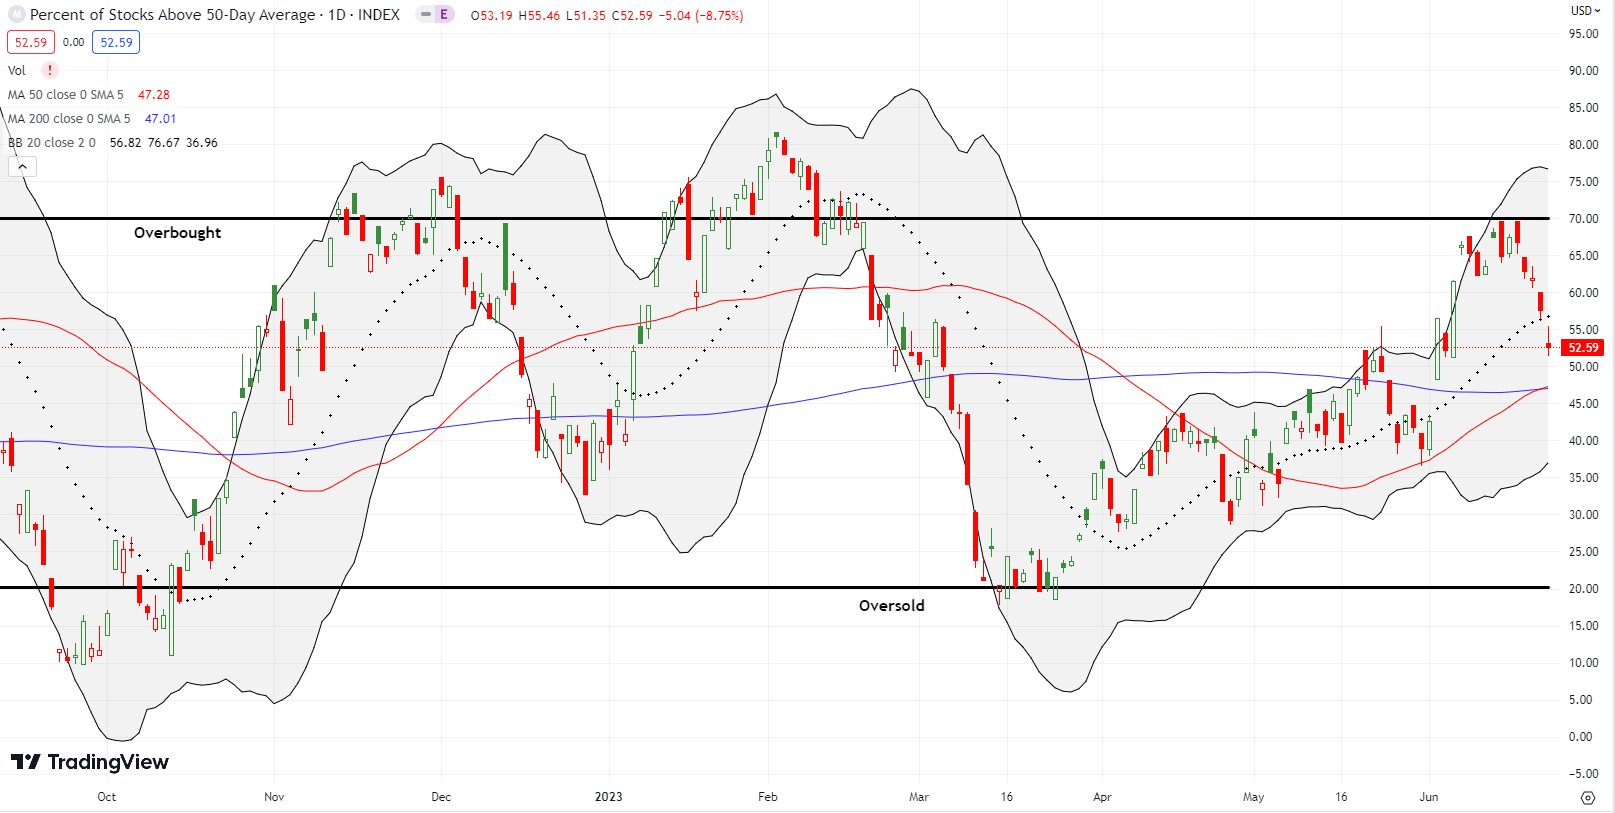
The summer of loving stocks is facing its first real test. In the middle of the week, the rally finally failed at the threshold of overbought market breadth. The stock market closed the week with market breadth confirming the end of the primary rally and the start of an important test of the uptrends. As bulls fade fast from from the overbought frontier, all the bearish arguments lobbed against the stock market take on increased prominence.
For example, even though Federal Reserve Chair Jerome Powell simply reiterated the Fed’s hawkish stances at Senate banking panel, the timing on Wednesday conveniently coincided with a complete reversal of the gains from the previous week’s Federal Reserve press conference. Pile on the start of recessions in New Zealand and Germany, big rate hikes from the Bank of England and the Central Bank of the Republic of Turkey, and weak manufacturing PMIs from across the major economies, and suddenly even a summer of loving stocks cannot resist gravity.
A U.S. recession has occupied the time and minds of economists, pundits, and analysts for over a year. Yet, the reality on the ground continues to outfox the forecasts. A quote from an economics professor interviewed in Marketplace’s “Economic indicators can’t tell us the economy’s whole story” sums up the conundrum for fundamental analysts who strain to see the future: “the best way to predict the trajectory of the economy is to look at how the economy’s doing right now”. Right now, the economy in aggregate is doing pretty well, especially considering the potential headwinds.
The “lagging” indicator of employment has been more informative than a battery of leading indicators. The Conference Board’s index of leading economic indicators just fell for a 14th month in a row. Yet, the economist who manages this indicator still had to upgrade her forecast for Q2 GDP growth from negative to positive. In other words, a leading indicator can fail to provide guidance on timing.
I have pointed out for a long while that eventually the U.S. will have a recession. There is no magic in making such a claim since the business cycle remains a part of economic life. The breathless expectations for a recession have made the rally from the October lows seem misguided. The solidification of this rally AFTER the calamity in regional banks in March is particularly frustrating for bears and those who are waiting to buy the market at much lower prices. Folks tend to believe the stock market when it aligns with their own expectations. For me, I believe the stock market between the extremes of market breadth. The bulls fade from the overbought frontier, the upper extreme of market breadth, has me ever so slightly more sympathetic to the skepticism of the bears.
The Stock Market Indices
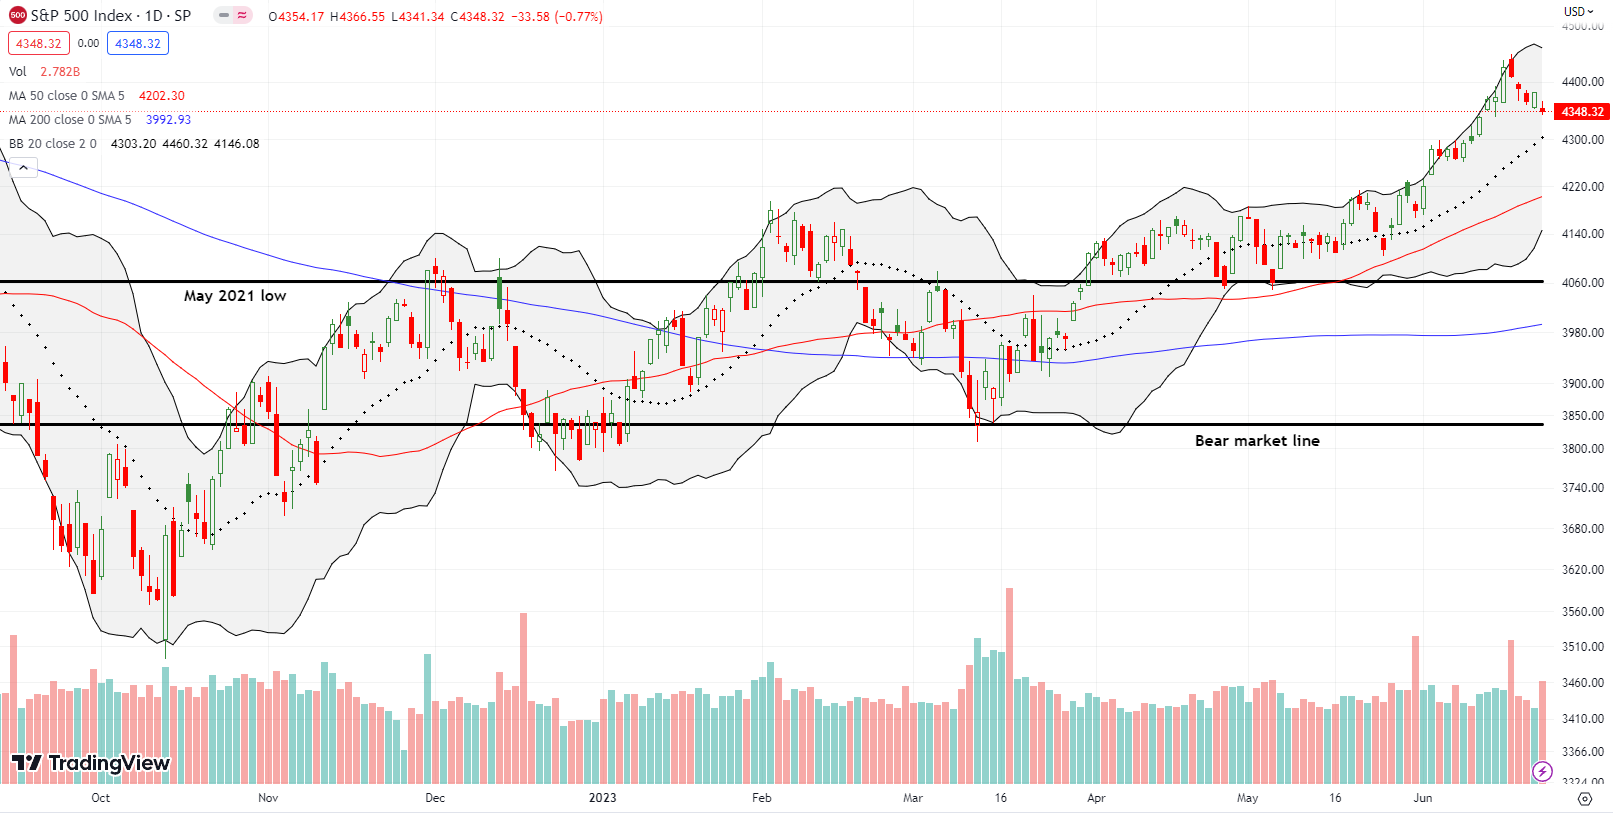
The S&P 500 (SPY) is fading into its first major test for the summer of loving stocks. With the post-Fed gains in the rearview mirror, sellers (and buyers like me) have their eyes on the uptrending 20-day moving average (DMA) as support. If the index bounces before testing support, the trading action will happen in an uncomfortable limbo zone until a new high.
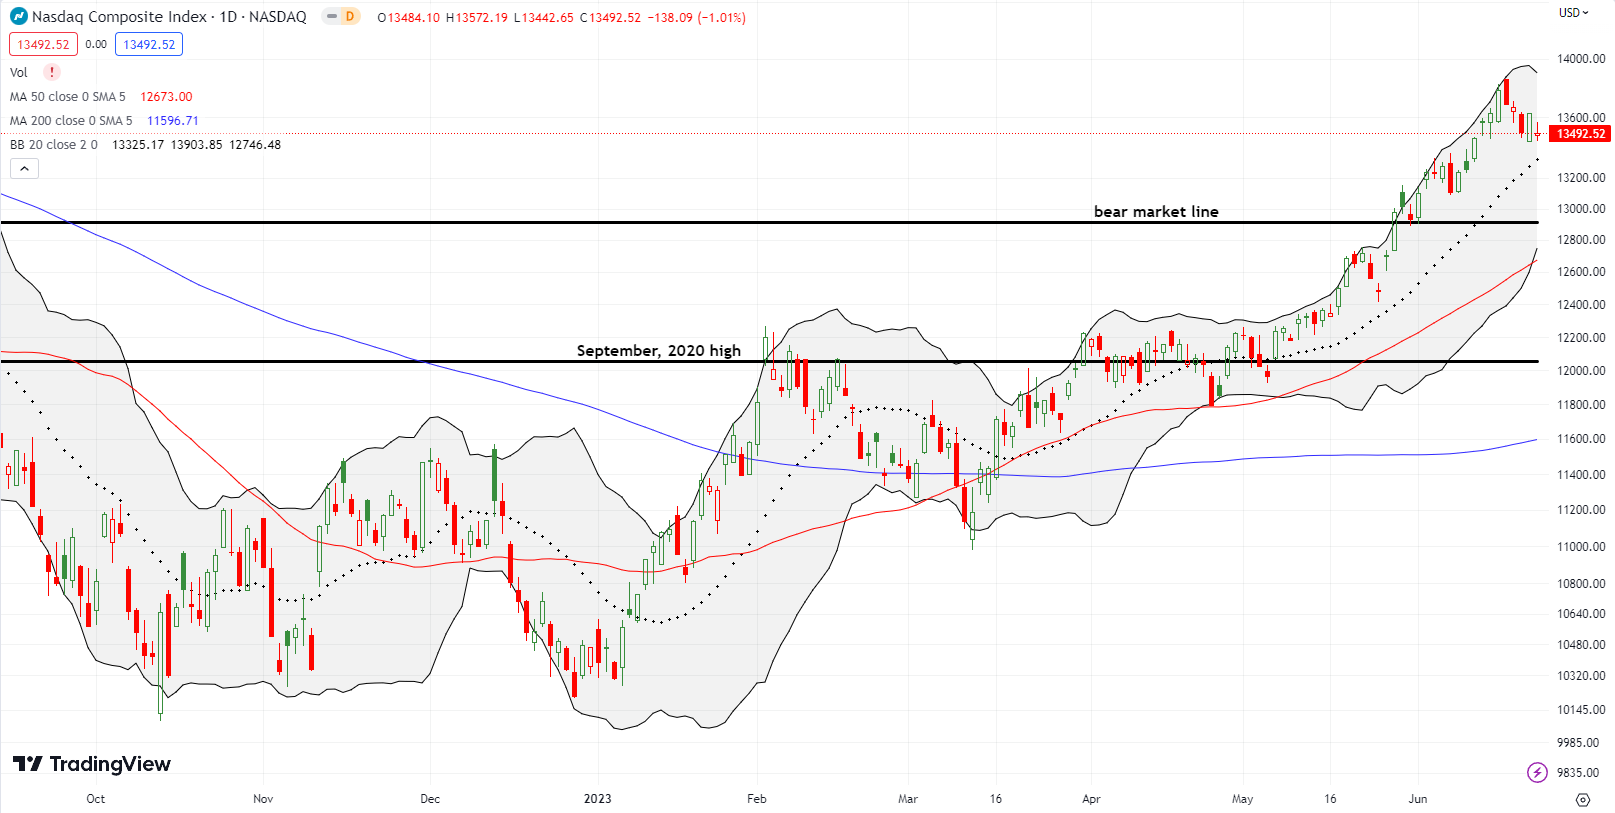
The NASDAQ (COMPQ) could test uptrending 20DMA support on Monday given the proximity. Buyers pushed against the fade on Thursday with a 1.0% gain. Friday’s small gap down returned the tech-laden index to its journey toward support.
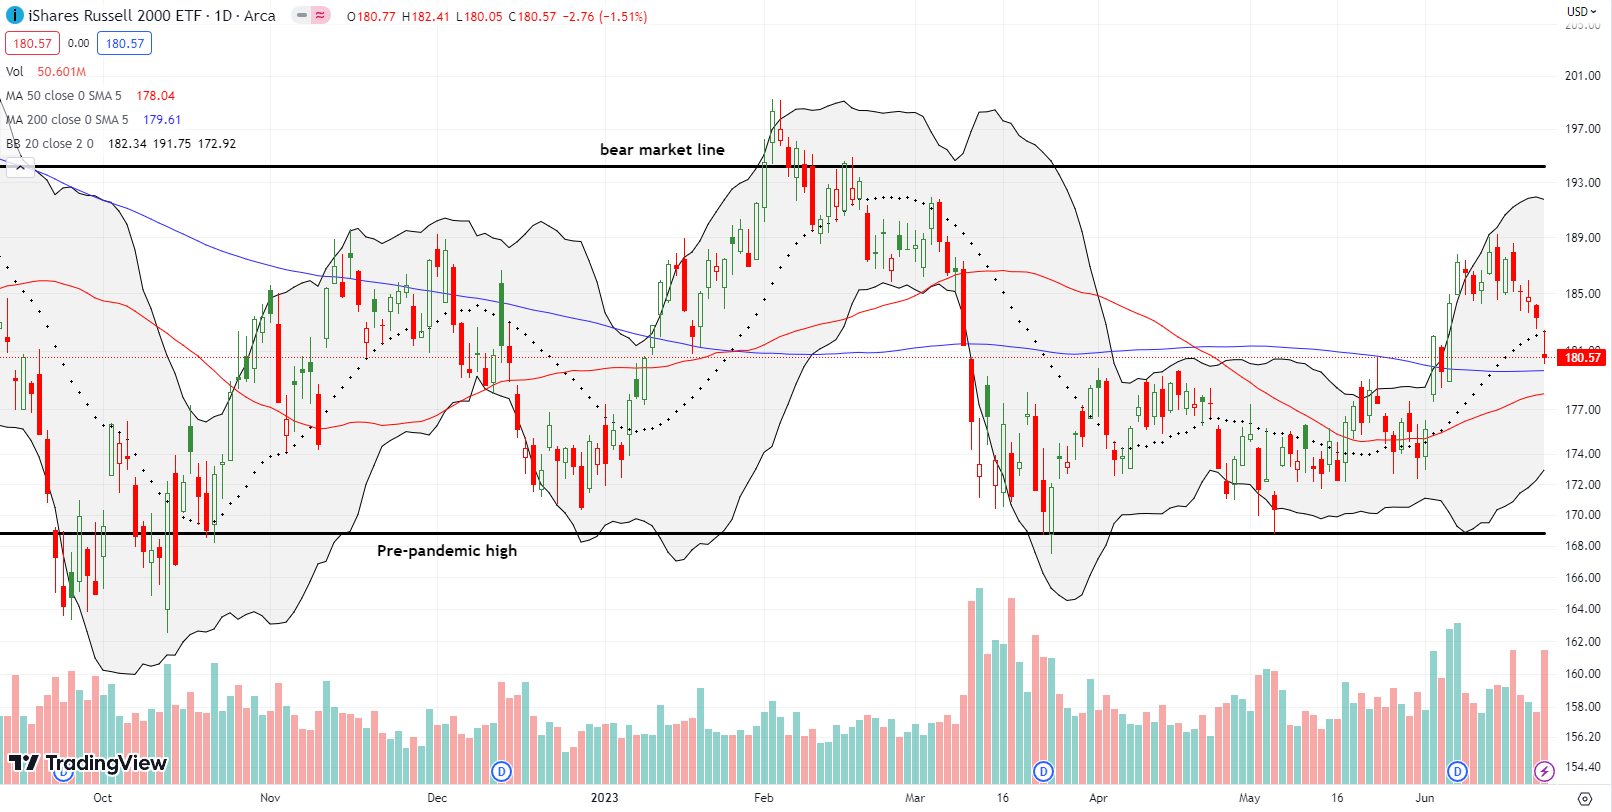
The iShares Russell 2000 ETF (IWM) confirmed its exhaustion with Friday’s 1.5% loss. The ETF of small caps gapped below 20DMA support and nearly tested 200DMA support (the bluish line). IWM reversed its entire breakout. Still, I dared to try one more time to play a rebound with a call spread. For this round I picked an expiration two weeks out.
Stock Market Volatility
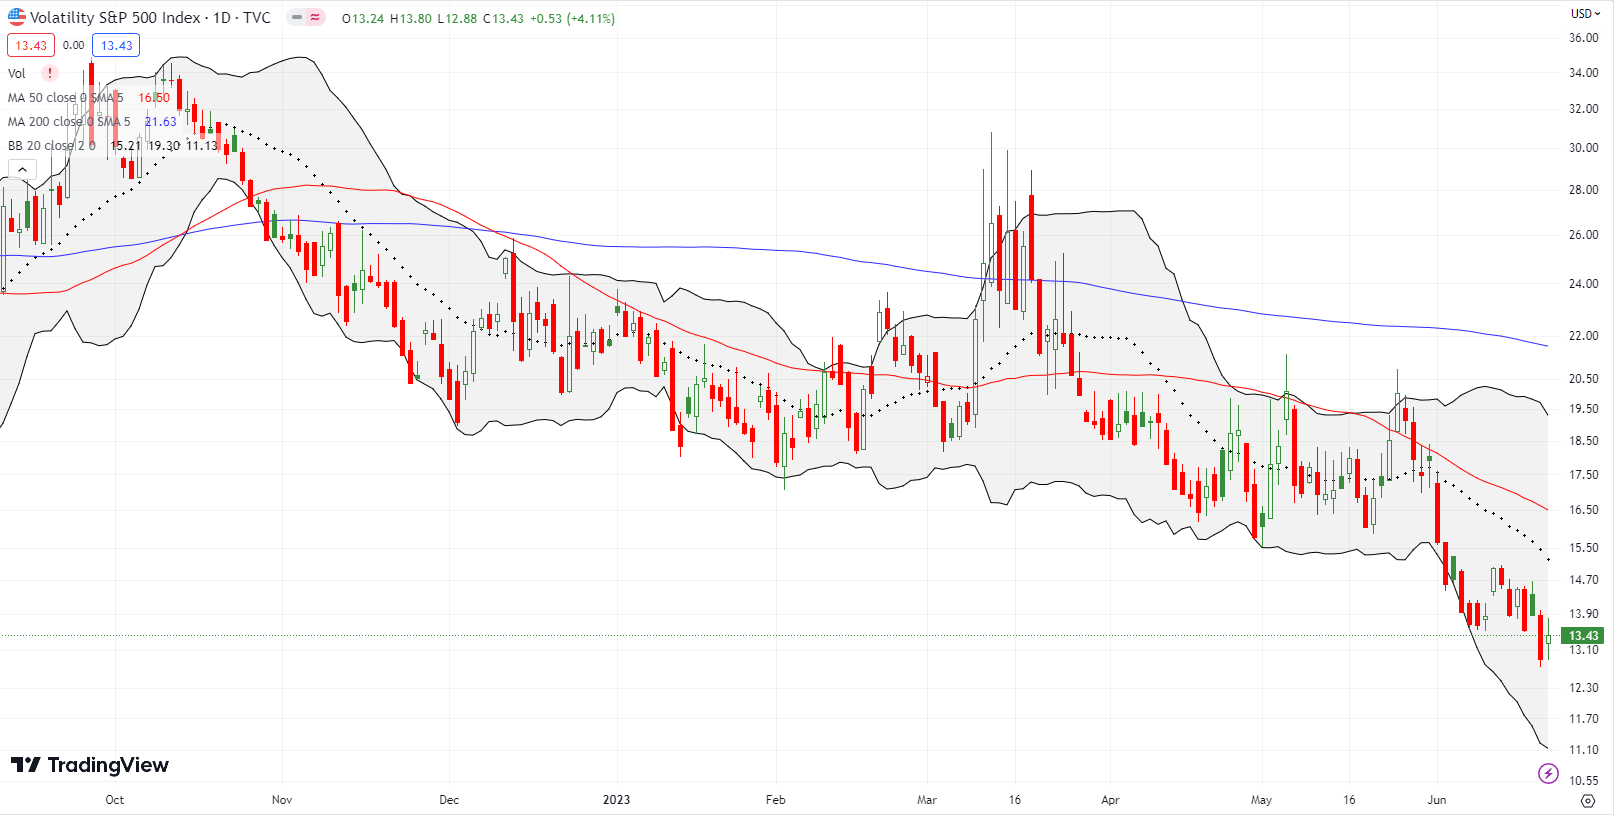
The volatility index (VIX) rebounded 4.1% after hitting a fresh multi-year low on Thursday. The VIX was last this low in January, 2020, before the pandemic. Until proven otherwise, I continue to think of the VIX as a broken indicator. Going forward, I will exclude the VIX until/unless something meaningful happens like a spike during oversold conditions.
The Short-Term Trading Call With A Fade from Overbought
- AT50 (MMFI) = 52.6% of stocks are trading above their respective 50-day moving averages
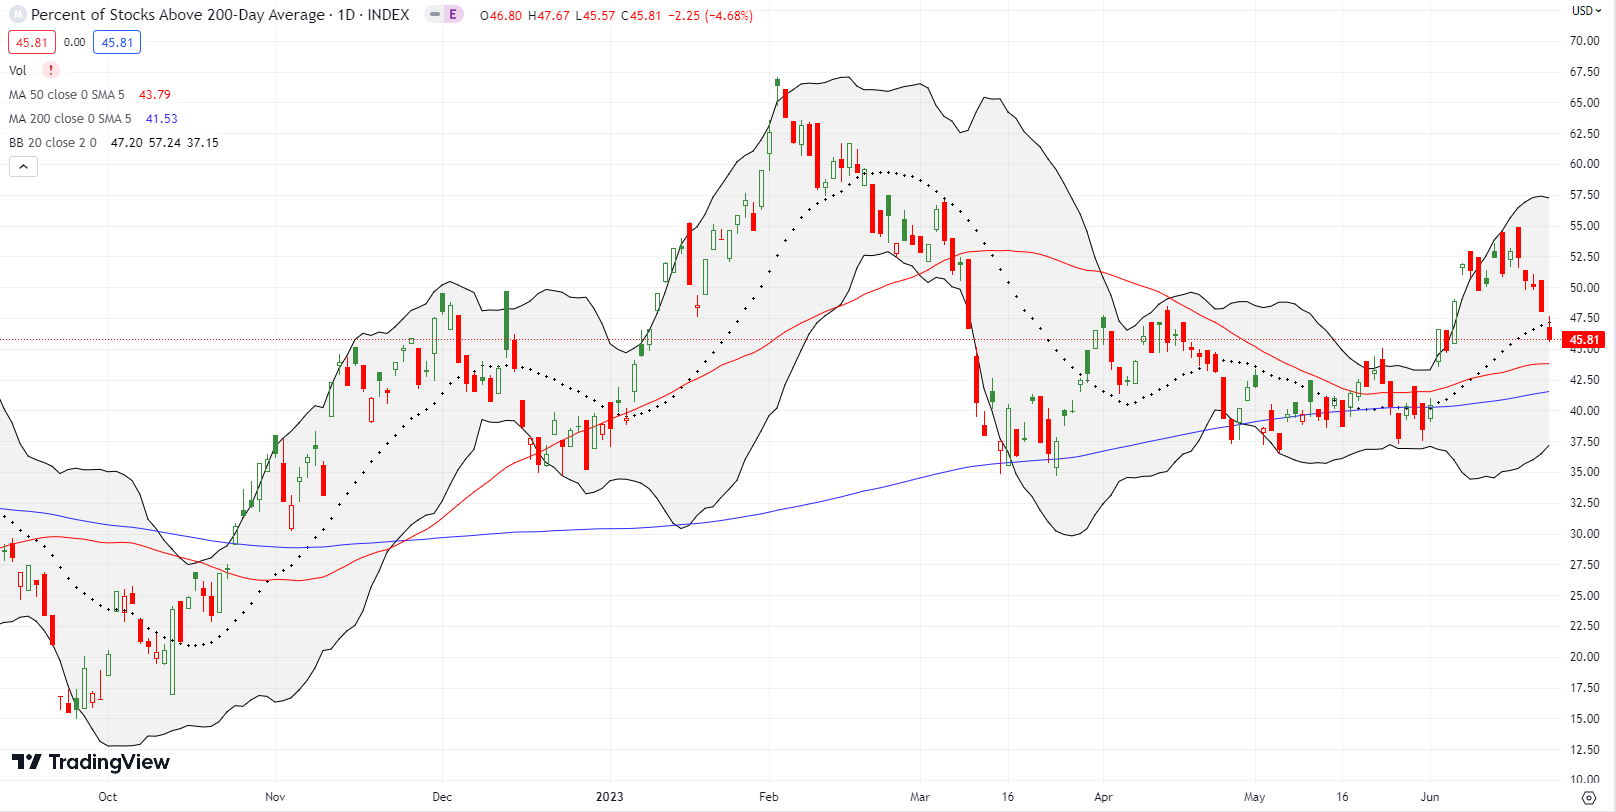
- AT200 (MMTH) = 45.8% of stocks are trading above their respective 200-day moving averages
- Short-term Trading Call: neutral
AT50 (MMFI), the percentage of stocks trading above their respective 50DMAs, closed the week at 52.6%. The 2+ week low reversed all of the gains from my favorite technical indicator’s breakout. This reversal further confirmed the trading significance of the fade from the overbought threshold at 70%. As I stated in my last post, I would be short-term bearish if not for the strong uptrends in place. So, for now, I am short-term neutral awaiting the trading dynamics that unfold at the 20DMA and then the 50DMA if selling intensifies. Note that AT200 (MMTH), the percentage of stocks trading above their respective 200DMAs, added its own confirmation with a reversal of its breakout (see the last chart below).
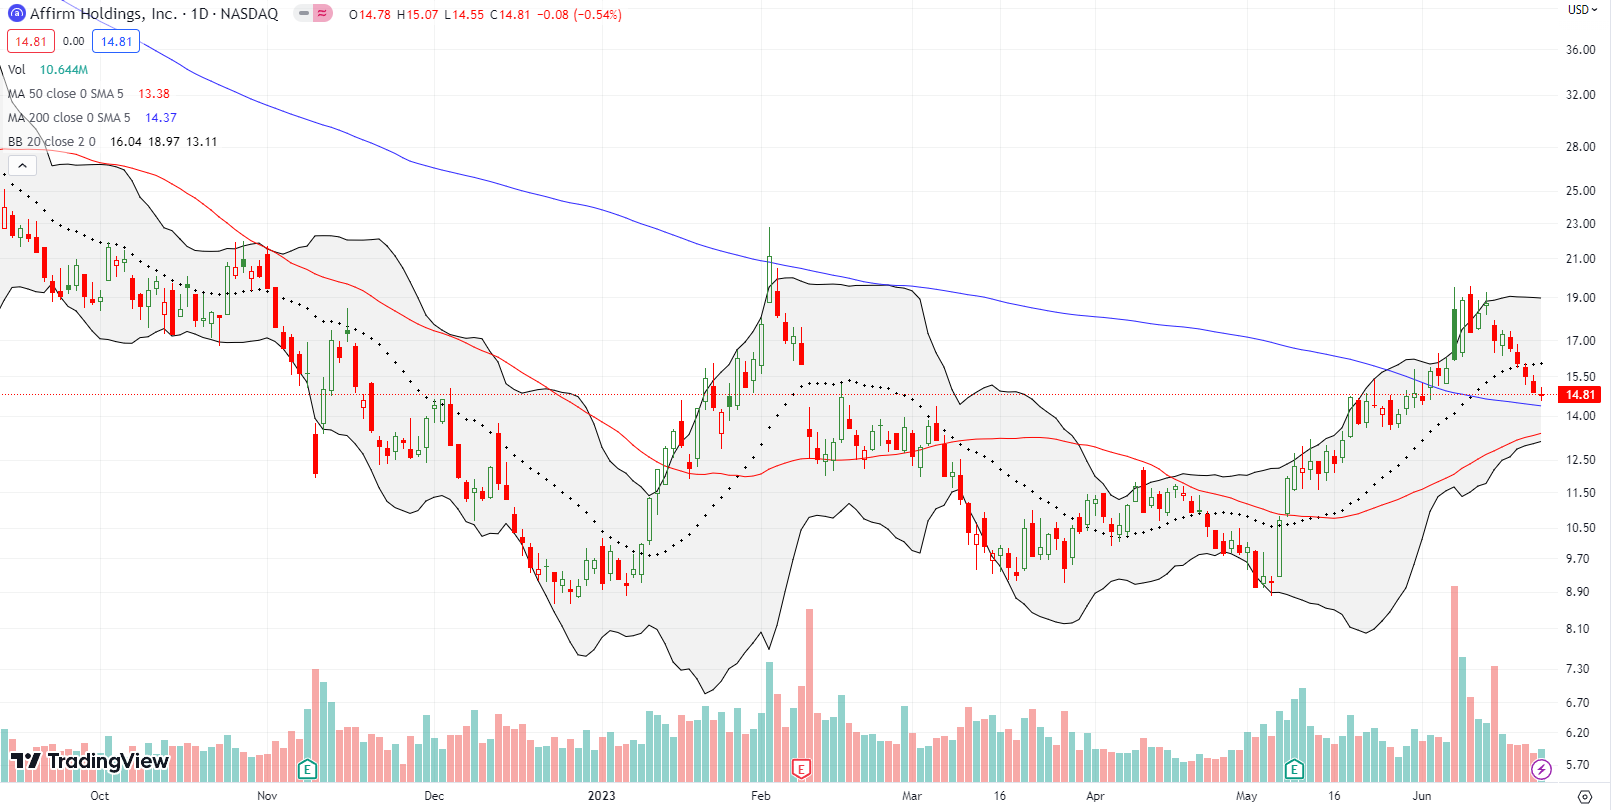
Affirm Holdings, Inc (AFRM) caused fresh excitement on June 7th with new product news related to its partnership with Amazon.com (AMZN). While sellers rolled out a fade of the initial surge, the price action seemed to confirm the earlier 200DMA breakout. Instead, AFRM never received sufficient momentum to challenge the February high, the last time AFRM traded above its downtrending 200DMA. A fade since then slipped through 20DMA support and ended last week just above 200DMA support. With the 50DMA (red line) trending up to reinforce 200DMA support, this fade has the potential to set up a major buying opportunity on a rebound or a short on a breakdown.
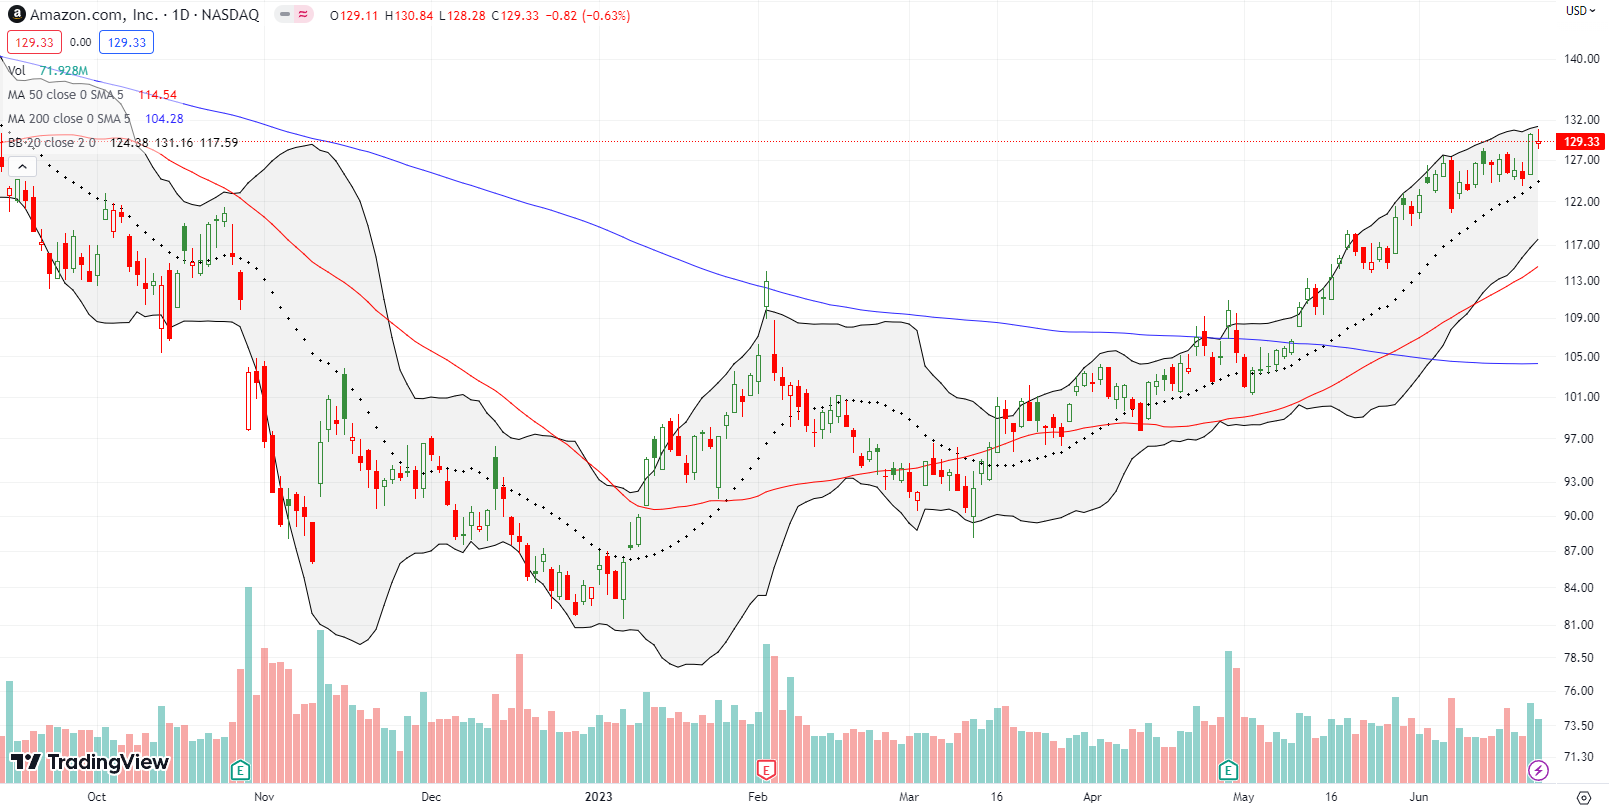
Ironically, Amazon.com (AMZN) lost 4.3% on the day of Affirm’s news. The pullback was part of a larger sell-off across big cap tech. Since then, AMZN has drifted higher and on Thursday the stock surged 4.3% on AI-related news (see “What generative AI means for businesses and how AWS can help“). AMZN now trades around 9-month highs with the 20DMA successfully tested as support.
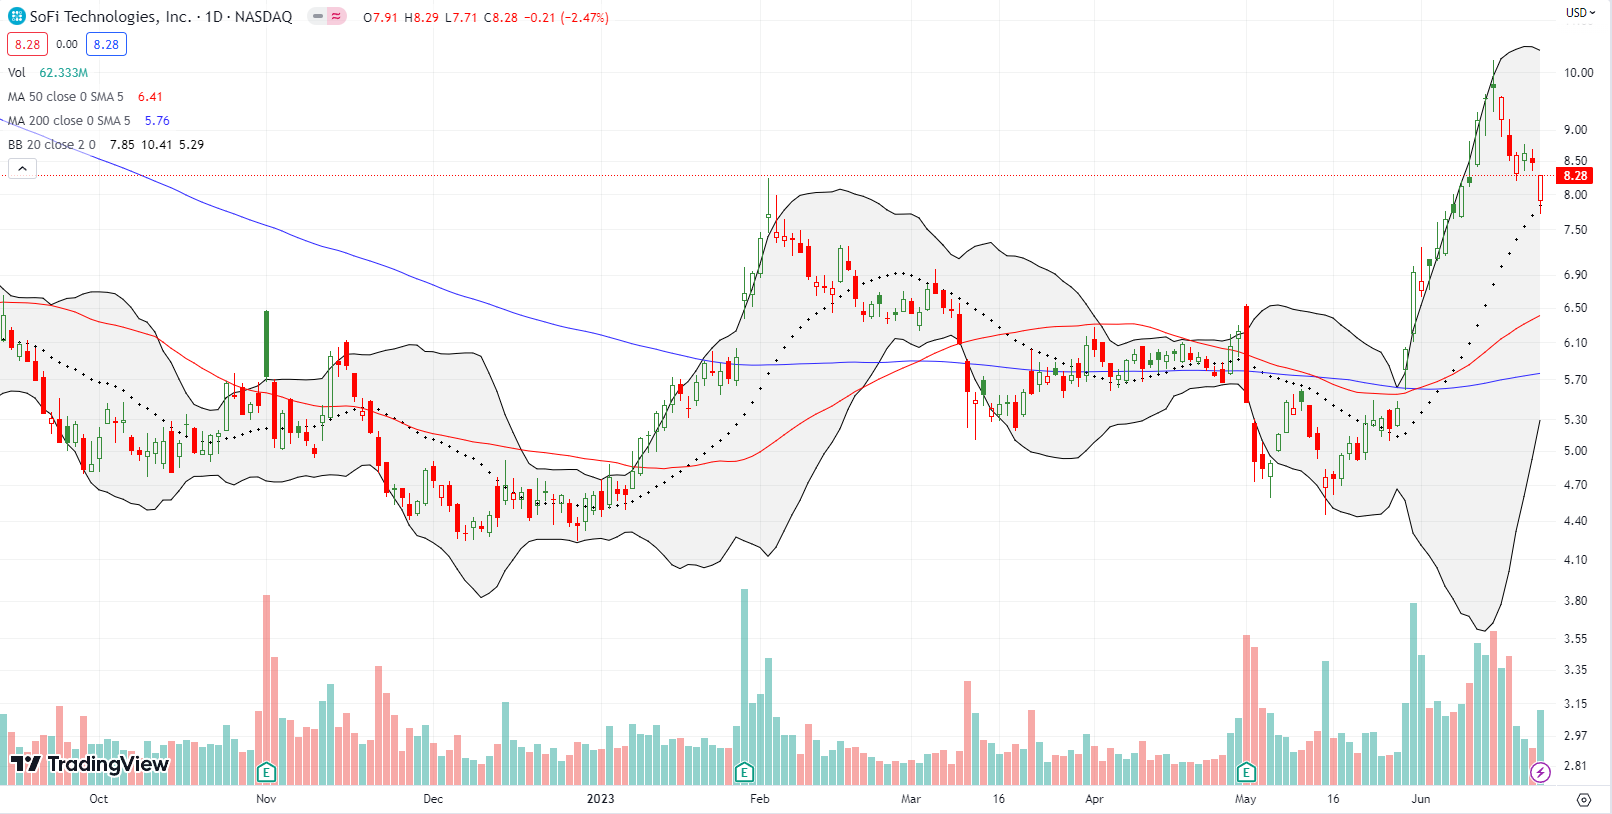
A sharp fade in SoFi Technologies (SOFI) took the stock back to its intraday high for the year. Sellers managed to break through that “soft” support to test 20DMA support. Buyers proved up to the task but failed to reclaim that intraday high of the year. I am a buyer on a higher close. Otherwise, SOFI will likely continue its fade to 50DMA or 200DMA support and a complete reversal of the last May breakout.
I do not see any company-specific news to explain SOFI’s resurgence. However, an analyst at Mizuho called the exact bottom in May with the following scathing jab at SOFI bears in an appearance on CNBC: “SOFI bears are weighing on the stock in recent days. They wrongly, in our view, conclude that since no personal loans were sold in 1Q, SOFI is unable to sell its loans. We believe the correct reasoning is that SOFI is able to earn ~6.4% annualized yield on holding its personal loans, which is more attractive than selling them at ~5%. Other bear arguments state that SOFI would have to take a CECL (current expected credit loss) provision. Those miss the point, because regulators don’t allow switching between fair market value and cost accounting. The recent liquidity disclosure is yet another concern, even though it isn’t new and has been around since the S-1. Buy.”
If only I saw this news earlier! SOFI proceeded to double in a month and shoot right through Mizuho’s $9 price target. Traders have sold short 12.6% of SOFI’s float.
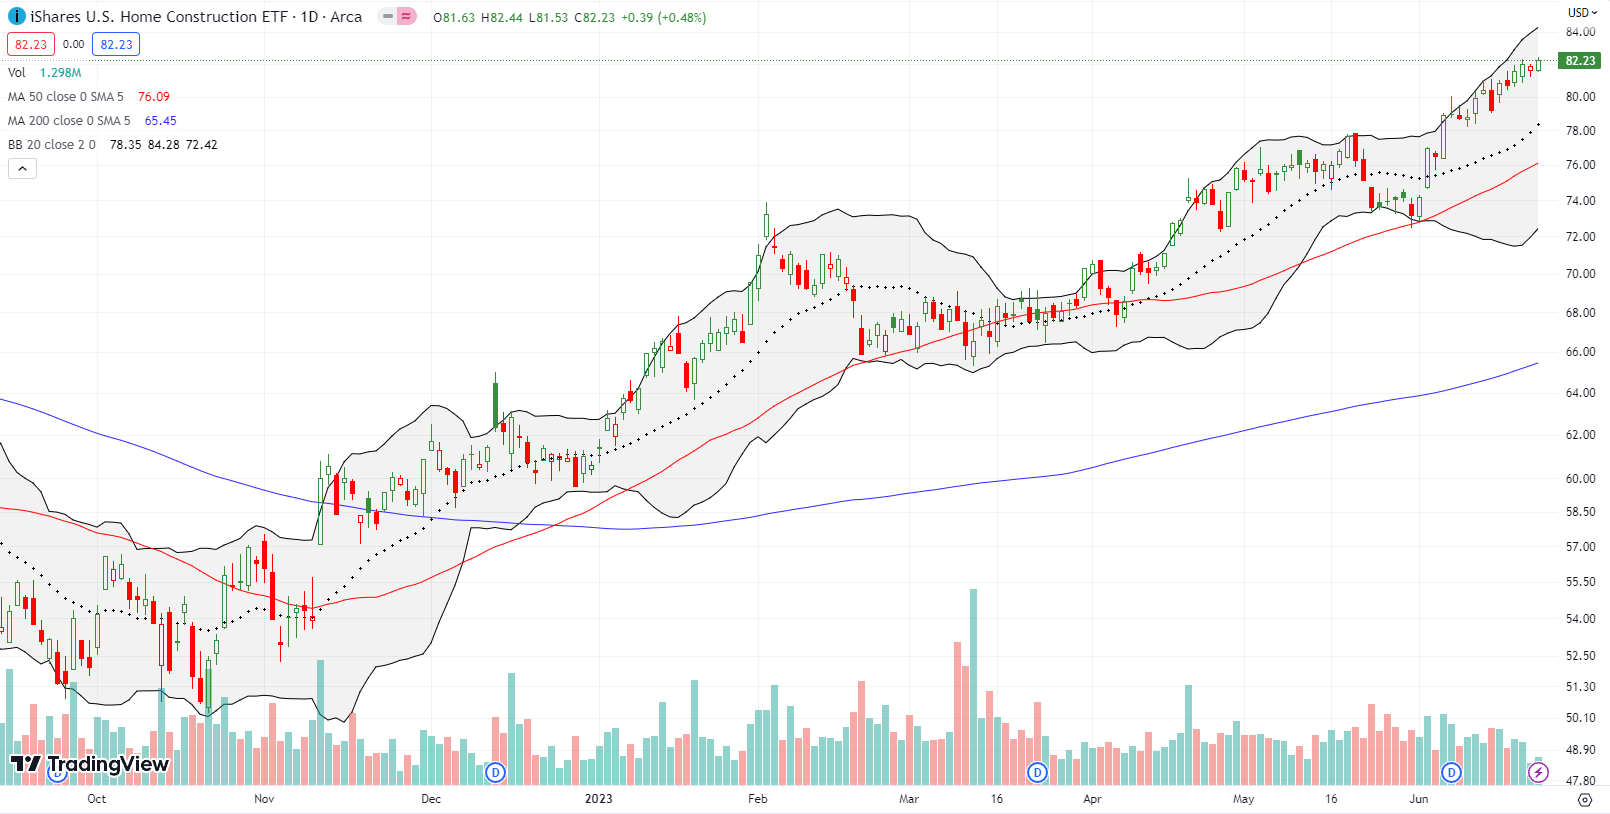
Speaking of economic developments that have confounded conventional economic thinking. The housing market remains resilient. Home builders are finding ways to hold profitability and even rekindle revenue growth. While the housing market is still in a recession in terms of year-over-year sales declines, the current momentum looks like the signature of a robust recovery and NOT the prelude to a general economic recession.
The iShares US Home Construction ETF (ITB) trades close to its all-time high set in late December, 2021. ITB’s 1.9% gain for the week means that the out-performance versus the S&P 500 characteristic of the seasonally strong period for home builder stocks continues well beyond the typical conclusion of the season! This strength has pretty much blown up the short trade on ITB proposed by CNBC Options action in late May. Strike another chord of caution against picking tops in strong uptrends.
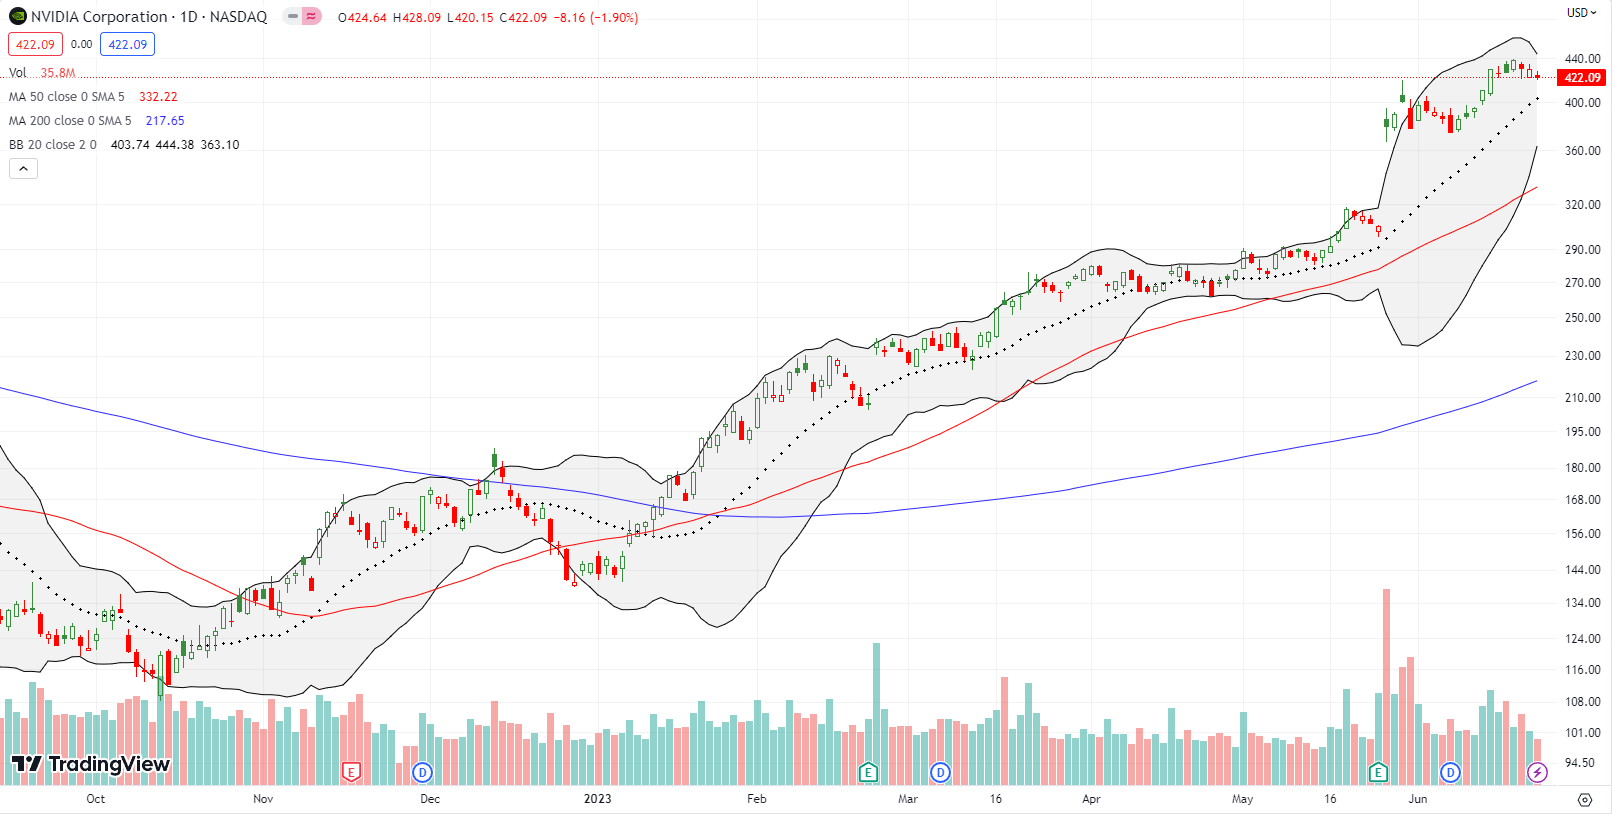
All eyes turn to NVIDIA Corporation (NVDA) as the current representative of bullish sentiment in the market. NVDA experienced a fade off its all-time high with a looming test of 20DMA support. Perhaps more importantly, the Bollinger Bands (BBs) are closing in for what looks like a fresh BB-squeeze. The last BB-squeeze resolved into a 24.4% post-earnings surge. I expect the resolution to the coming squeeze to be almost as important but not nearly as large. It is hard to get bearish on the stock market as long as NVDA looks so strong (Apple (AAPL) used to occupy top position on this mantle of sentiment).
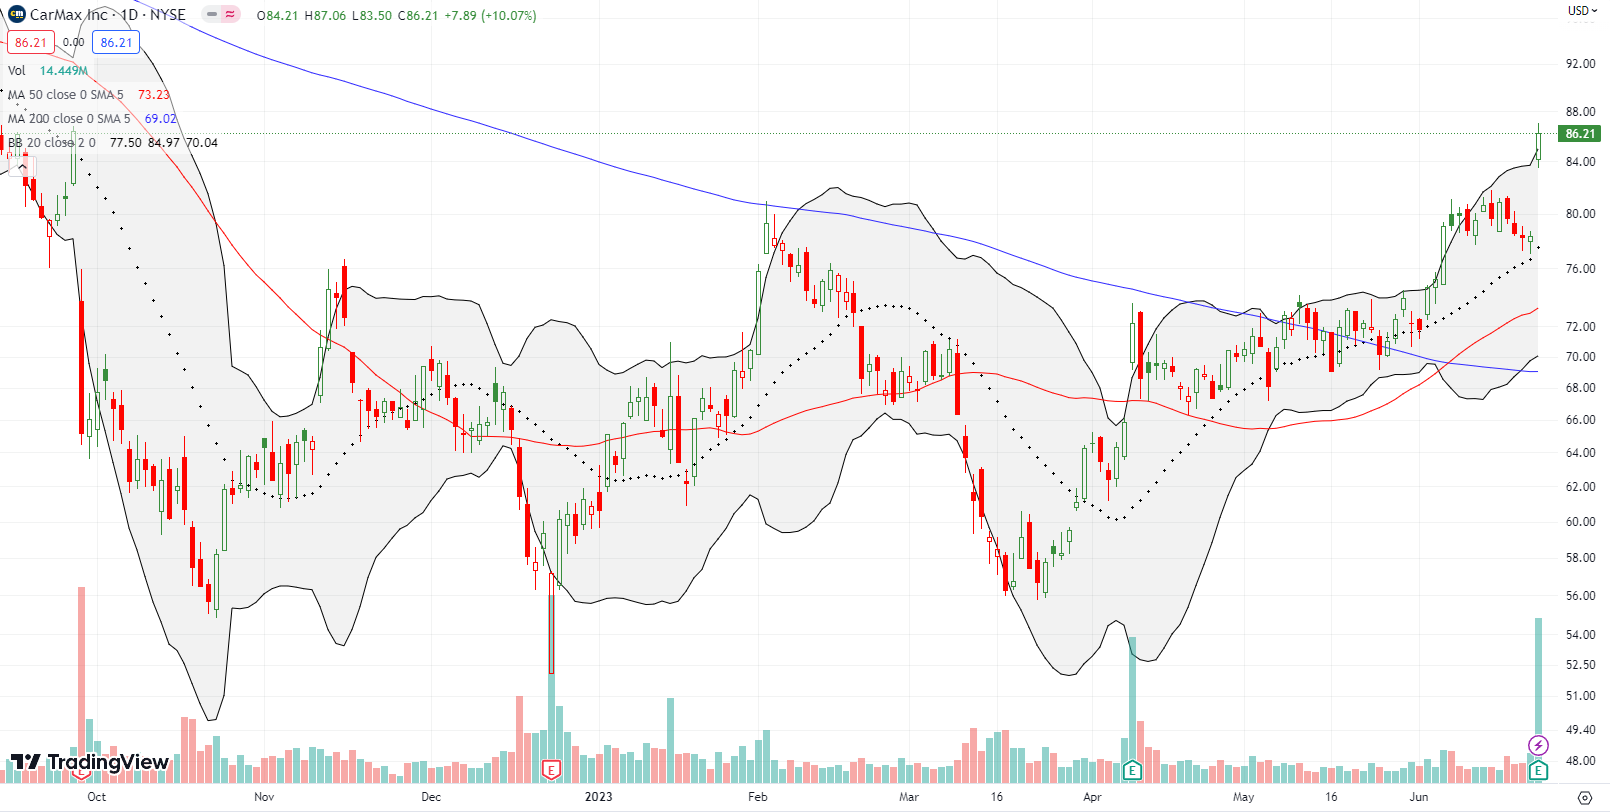
As skeptical as I have become in forecasts of economic doom, CarMax, Inc (KMX) still surprised me. The stock of the used car dealer soared 10.1% post-earnings. KMX now trades at a 9-month high. Moreover, KMX finished reversing its loss from September’s catastrophic 24.6% post-earnings collapse. Note how KMX “coyly” traded around its former 2023 high set in February after it confirmed a bullish 200DMA breakout. The stock also neatly tested 20DMA support ahead of earnings.
Be careful out there!
Footnotes
Subscribe for free to get email notifications of future posts!
“Above the 50” (AT50) uses the percentage of stocks trading above their respective 50-day moving averages (DMAs) to measure breadth in the stock market. Breadth defines the distribution of participation in a rally or sell-off. As a result, AT50 identifies extremes in market sentiment that are likely to reverse. Above the 50 is my alternative name for “MMFI” which is a symbol TradingView.com and other chart vendors use for this breadth indicator. Learn more about AT50 on my Market Breadth Resource Page. AT200, or MMTH, measures the percentage of stocks trading above their respective 200DMAs.
Active AT50 (MMFI) periods: Day #59 over 20%, Day #33 over 30%, Day #30 over 40%, Day #16 over 50%, Day #2 under 60%, Day #84 under 70%
Source for charts unless otherwise noted: TradingView.com
Full disclosure: long QQQ call spread, long IWM call spread
FOLLOW Dr. Duru’s commentary on financial markets via StockTwits, Twitter, and even Instagram!
*Charting notes: Stock prices are not adjusted for dividends. Candlestick charts use hollow bodies: open candles indicate a close higher than the open, filled candles indicate an open higher than the close.


