Stock Market Commentary
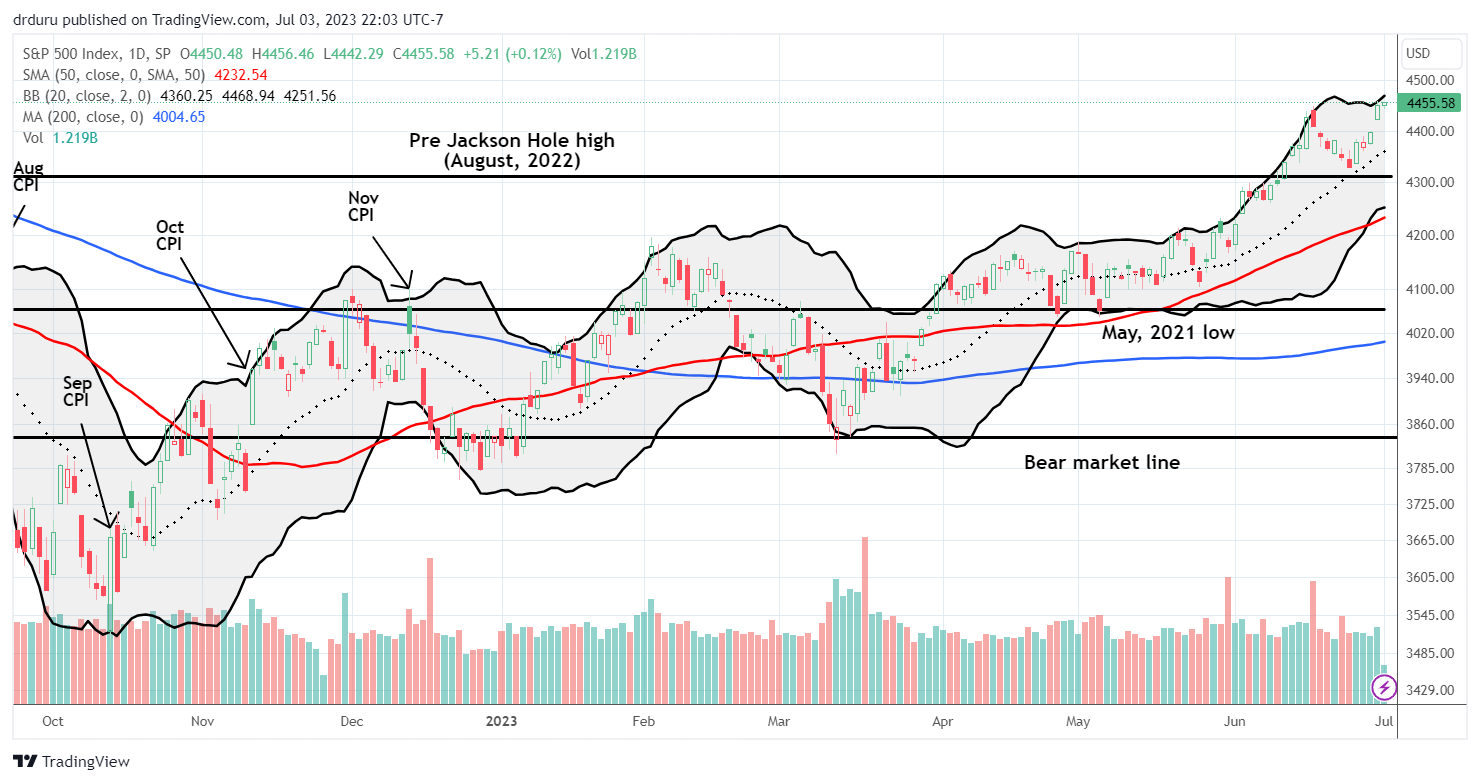
The summer of loving stocks survived its first major test. The numbers for the first half of the year put an exclamation on a rally that has defied most expectations. The S&P 500 (SPY) had its 12th best first half since at least 1933 (per Cater Braxton Worth) with a 15.9% gain and near a 14-month high. The NASDAQ (COMPQX) had its best ever first half since 1983 (per CNBC) with a 31.7% gain and a 15-month high. It is tempting to assume that the market will underperform for the rest of the year, but there are no rules or laws that dictate such price action (the numbers below from Carter Worth suggest to me there is a 50/50 chance for gains in the second half). The second half begins with the stock market itching for another scratch at overbought conditions. Accordingly, I will be monitoring the trading rules for market breadth to understand the prospects for extending the summer of loving stocks.
The Stock Market Indices
The S&P 500 (SPY) passed its first major test for the summer of loving stocks. The index started last week with a close right above converged support from the uptrending 20-day moving average (DMA) (the dashed line below) and the pre Jackson Hole high from August, 2022. The bounce from that point was poetic with the S&P 500 rallying 4 out of the last 5 days. It closed holiday shortened trading at a new 14-month high. The trading poetry gave me the confidence to aggressively go long individual stocks for swing trades. I did not buy any SPY calls (but I should have done so!).
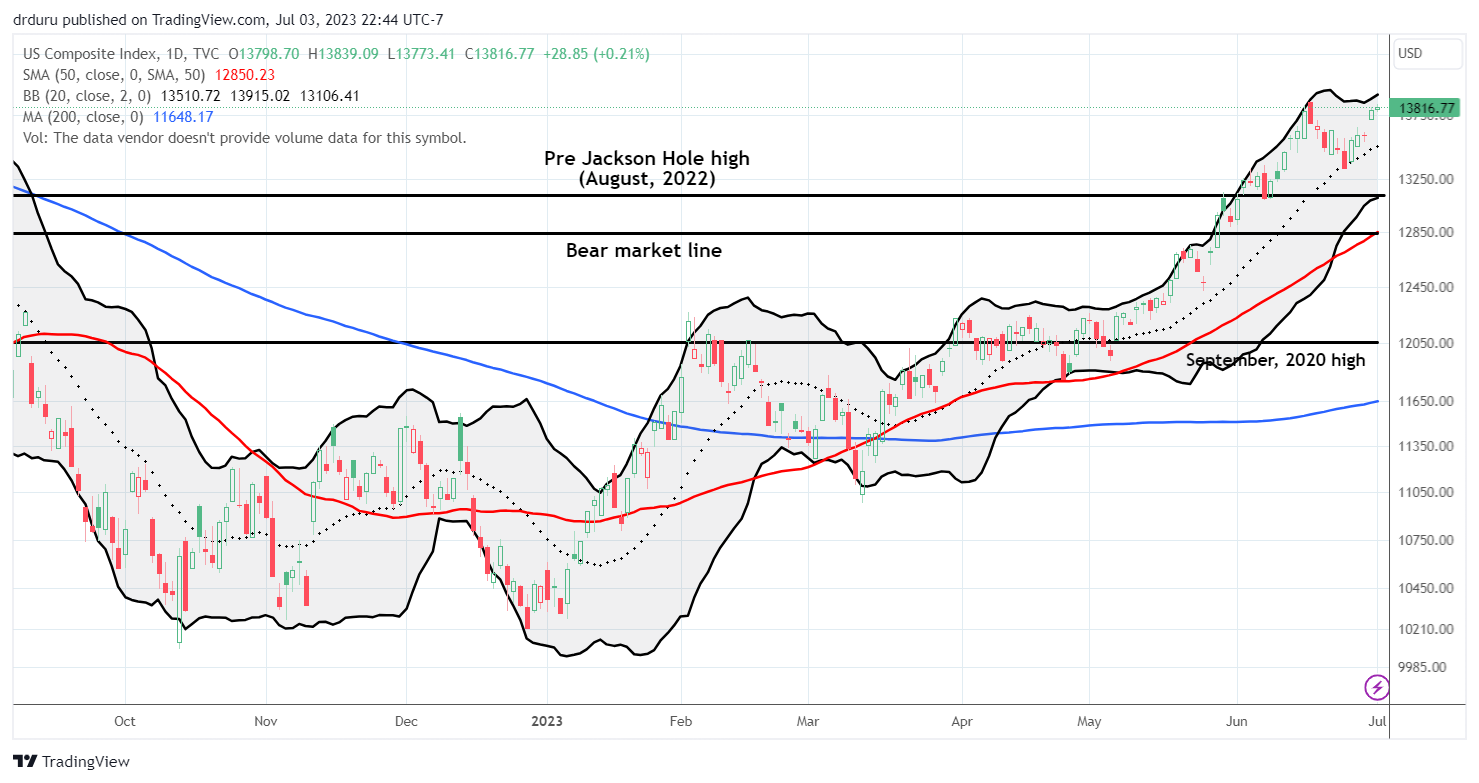
The NASDAQ (COMPQ) did the technical poetry one better than the S&P 500. The tech-laden index actually tapped 20DMA support before rebounding to a near 15-month high. I decided to take profits on my QQQ call spread given the stock market is itching for another scratch at the overbought threshold. If overbought trading begins, I will consider re-entering a QQQ call spread with a July or August expiration. I do not expect an extended overbought trading period to last beyond that. Of course, this IS an historic market!
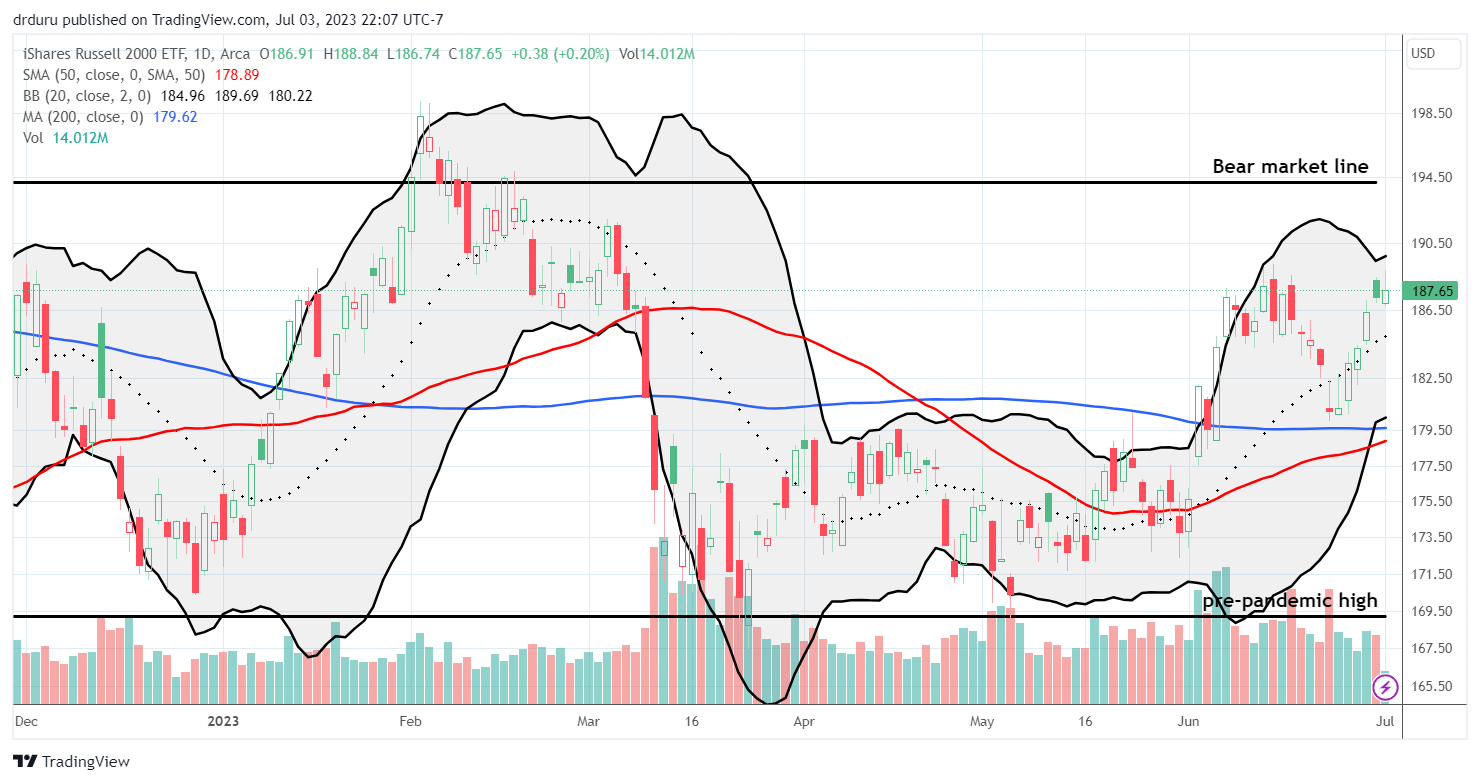
While the iShares Russell 2000 ETF (IWM) is lagging the summer of loving stocks, it still took its cue from the big test of the season. The ETF of small caps started last week rallying away from a test of 200DMA support (the blue line). However, faders took it down from 20DMA resistance. IWM took another two days to break through resistance and one more day to confirm the breakout. I was a little too eager to take profits on my IWM call spread, so I missed the rally back to resistance from the previous highs. IWM looks like it is itching for a test of the bear market line, but it must first break out from this resistance point.
The Short-Term Trading Call While Itching
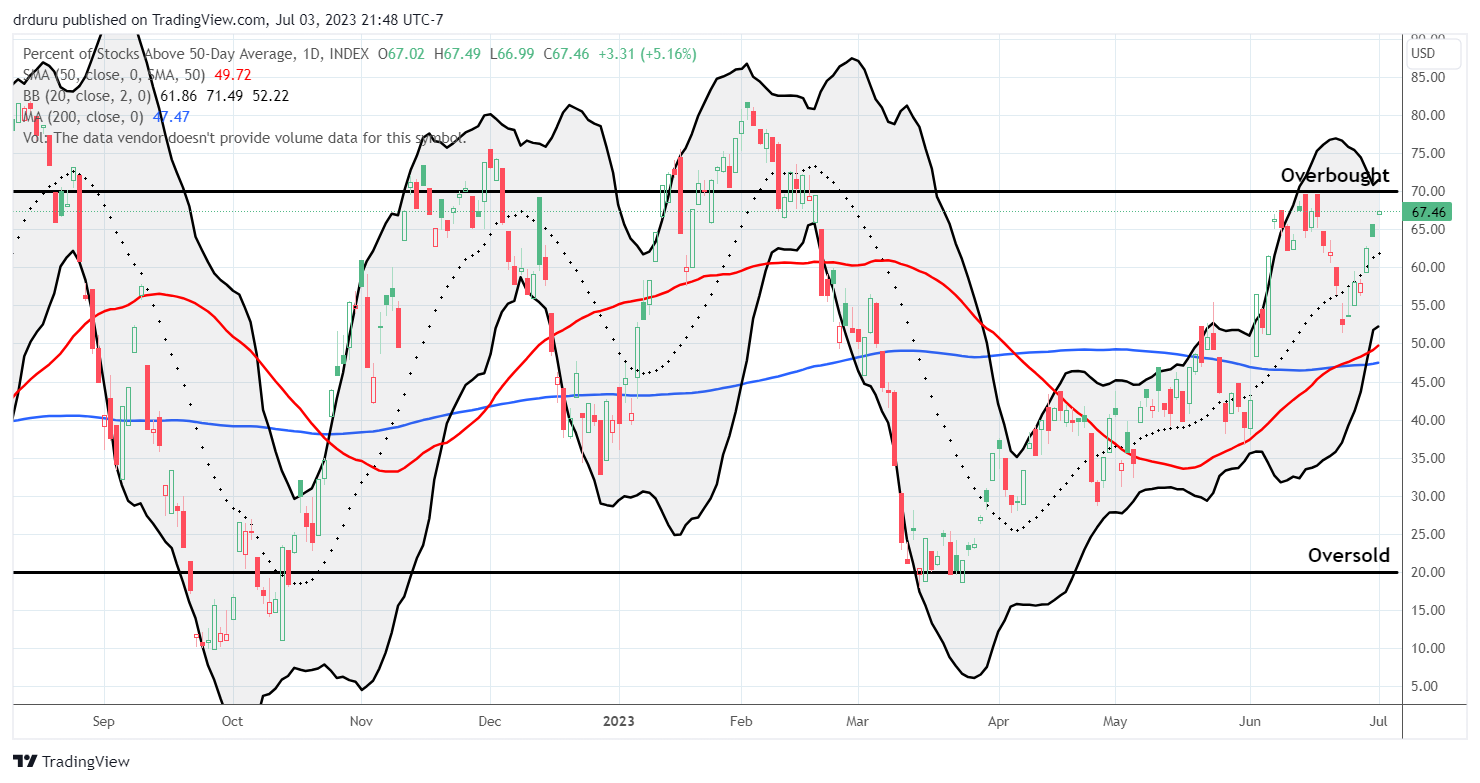
- AT50 (MMFI) = 67.5% of stocks are trading above their respective 50-day moving averages
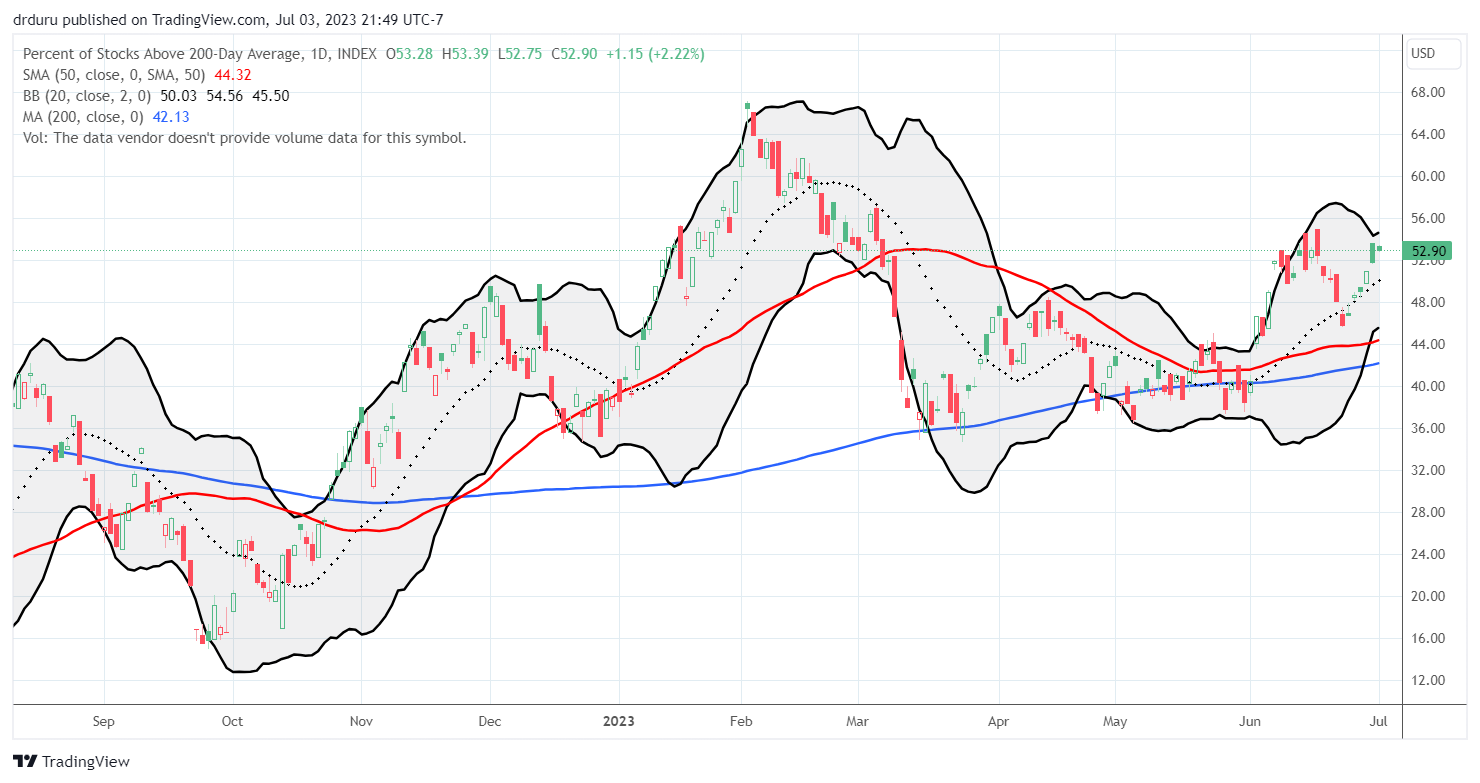
- AT200 (MMTH) = 52.9% of stocks are trading above their respective 200-day moving averages
- Short-term Trading Call: neutral
AT50 (MMFI), the percentage of stocks trading above their respective 50DMAs, closed at 67.5%. The rebound toward the overbought threshold means that my favorite technical indicator survived its own test for the summer of loving stocks. At its recent low, AT50 completely reversed the breakout from early June. Now, AT50 is itching for another scratch at the overbought threshold. The short-term trading call remains neutral even as the breakouts of the major indices increase the likelihood for extended overbought trading. Needless to say, this is not a time for making aggressive bets on the bearish side.
And now some quick updates on trades I made on the stock charts I posted in the last Market Breadth post.
Affirm Holdings, Inc (AFRM) survived a near picture-perfect test of 200DMA support. I purchased call options as a trade on a rebound. So far so good, even as AFRM fights to overcome overhead resistance from its 20DMA.
I opened and closed a swing trade on SoFi Technologies, Inc (SOFI). I bought the stock as it seemed to confirm the rebound off 20DMA support. Faders worried me as they took the stock down for a loss on the day. Buyers returned and sent SOFI back into the $9 target from the bullish analyst who marked the exact bottom for SOFI this year. Note how SOFI faded from that $9 level. It might take another bullish analyst to push SOFI through this apparent point of resistance.
I bought CarMax (KMX) as buyers stepped back into the stock after the post-earnings reversal. The rebound lasted just 2 days. Faders are back in control and look like they are itching for another try at testing 20DMA support. I will add to my position if KMX bounces from there. If not, I will take my loss and wait to see what happens at 50DMA support (the red line).
Be careful out there!
Footnotes
Subscribe for free to get email notifications of future posts!
“Above the 50” (AT50) uses the percentage of stocks trading above their respective 50-day moving averages (DMAs) to measure breadth in the stock market. Breadth defines the distribution of participation in a rally or sell-off. As a result, AT50 identifies extremes in market sentiment that are likely to reverse. Above the 50 is my alternative name for “MMFI” which is a symbol TradingView.com and other chart vendors use for this breadth indicator. Learn more about AT50 on my Market Breadth Resource Page. AT200, or MMTH, measures the percentage of stocks trading above their respective 200DMAs.
Active AT50 (MMFI) periods: Day #65 over 20%, Day #39 over 30%, Day #36 over 40%, Day #22 over 50%, Day #3 over 60%, Day #90 under 70%
Source for charts unless otherwise noted: TradingView.com
Full disclosure: long AFRM calls
FOLLOW Dr. Duru’s commentary on financial markets via StockTwits, Twitter, and even Instagram!
*Charting notes: Stock prices are not adjusted for dividends. Candlestick charts use hollow bodies: open candles indicate a close higher than the open, filled candles indicate an open higher than the close.


