

The Market Breadth Summary
- The NASDAQ lost 2% for the week while nine of eleven S&P 500 sectors gained, extending October’s rotation away from the topping AI trade.
- The S&P 500 confirmed a second 50-day moving-average breakdown, while earnings-driven selloffs damaged several AI-related stocks.
- AT50 ended the week at 41.6% and AT200 at 45.1%, leaving the short-term trading call neutral despite this improving market breadth.
- Confirmed breakouts took priority over getting cute with support in volatile AI stocks, with predefined stops central to the trading rules.
- The Federal Reserve held interest rates at 3.75%–4.00%, third-quarter GDP growth accelerated to a 3.4% annualized rate, and oil prices rose through October, providing a strong and precarious economic backdrop to start trading in the market’s seasonally strong period.
The Stock Market Summary
I have been making the case for months that the AI trade is topping. This last week’s price action added yet more confirmation. While the NASDAQ dropped 2% for the week, nine of the eleven S&P 500 sectors finished higher, led by healthcare, materials, and utilities. That divergence endured for most of October. Even as market leadership shifts, the rapid evacuation from the AI trade begs the question: should traders stay patient and buy the next breakout or get cute with support and hope that these stocks are close enough to some kind of a bottom?
I am not convinced the AI trade is finished, but I also do not think this is the environment to blithely look past the dangers right in front of us. Some of these stocks are still delivering impressive earnings and could be setting up their next breakout. Others may need considerably more time to work through overhead resistance before support becomes reliable. The broader rotation in October has also created opportunities outside technology. Thus, the question now is whether to pay up for stocks proving themselves with breakouts above key resistance or get a little cute buying support in names that have already taken a beating. As always, I am letting the price action dictate my interpretation of the technicals. Support needs confirmation and breakouts need confirmation…and AI trades need tighter downside stops.
Meanwhile, the Federal Reserve held interest rates at 3.75%–4.00%, and third-quarter GDP accelerated to a 3.4% annualized growth rate. A resilient economy is helping sustain stubbornly persistent inflation, while the steady rally in oil prices adds another source of inflationary pressure. The upcoming midterm elections promise to add more volatility to the mix. However, the resolution of elections could also provide the next excuse for the market to ignore all the other negative catalysts working against stocks.
S&P 500 (SPY)
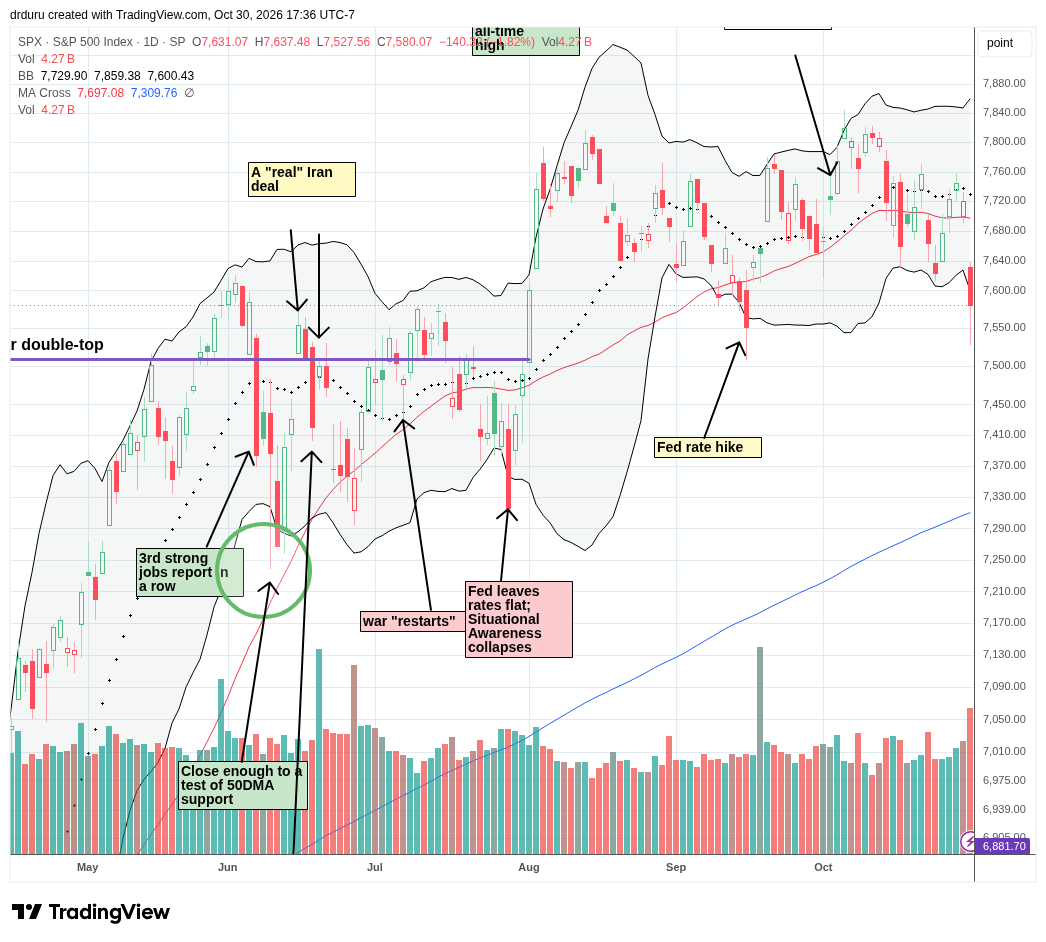
The S&P 500 (SPY) fell 0.5% on Friday and confirmed its second 50DMA (red line) breakdown in two weeks. The index has essentially gone nowhere since a sprint higher in early August. The stop and start nature of trading in the index reflects the growing hesitancy I see in the AI trade. This hesitancy has produced multiple rounds of rotation where money moves from AI to non-AI and non-tech, rinse and repeat. After the dust settles, the AI trade loses a little more steam while the stocks that are now supporting market breadth are leaving the AI trade behind.
NASDAQ (COMPQ)
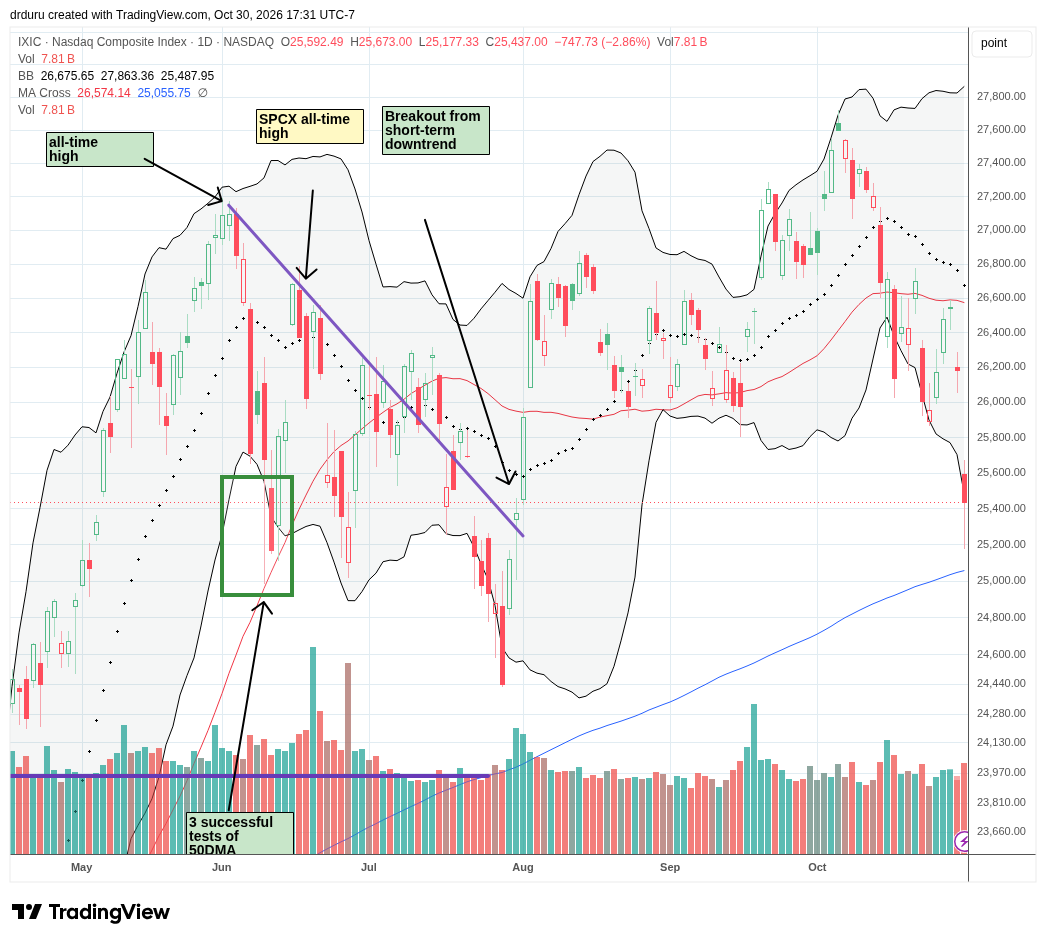
The NASDAQ set an all-time high in early October and has not been the same since. In less than two weeks, the tech-laden index cracked 50DMA support, and in another week the NASDAQ confirmed a 50DMA breakdown. Now at the lows that held as support in August and September, the NASDAQ is at risk of sliding into a direct test of 200DMA support (blue line).
iShares Russell 2000 ETF (IWM)
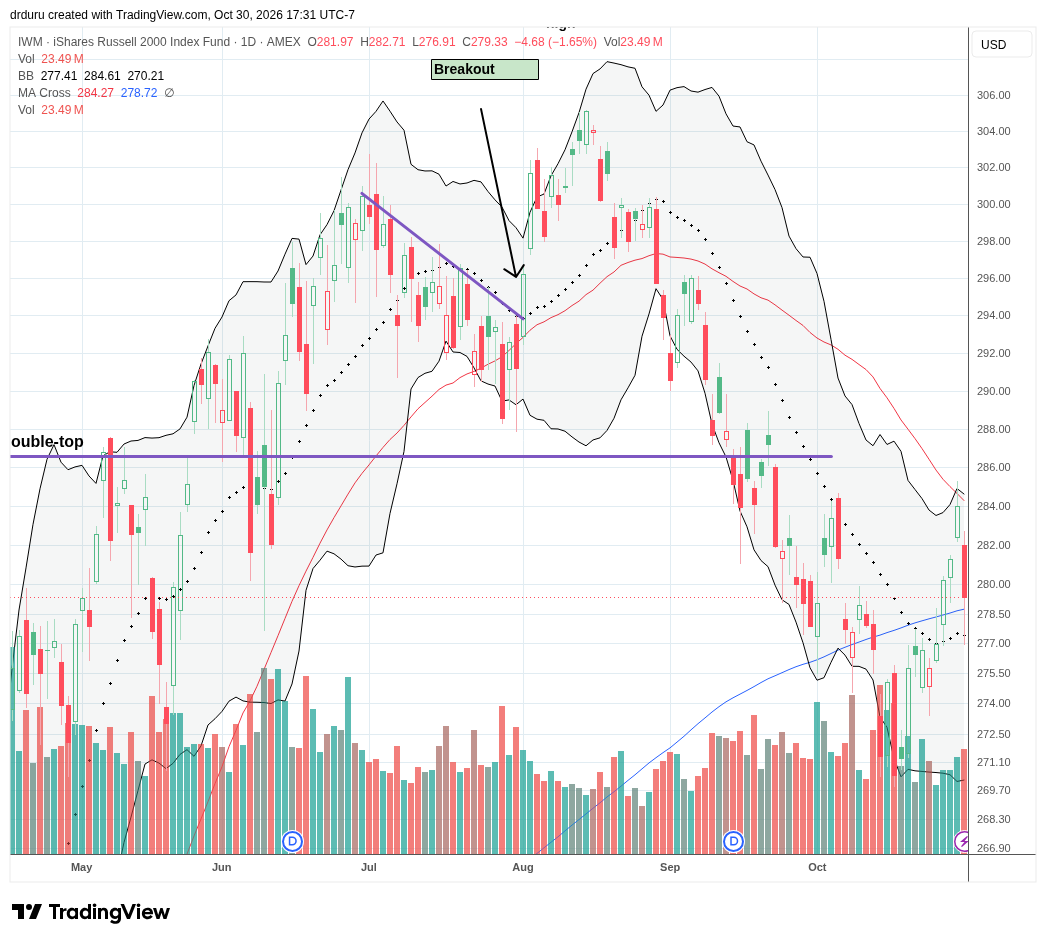
The iShares Russell 2000 ETF (IWM) remains in full bearish position. Last week, converged resistance from the 20DMA (dashed line) and 200DMA held firm. I am very surprised at the strength in market breadth given small caps stalled out in parallel. No trades for me on IWM until it overcomes 200DMA resistance.
The Short-Term Trading Call
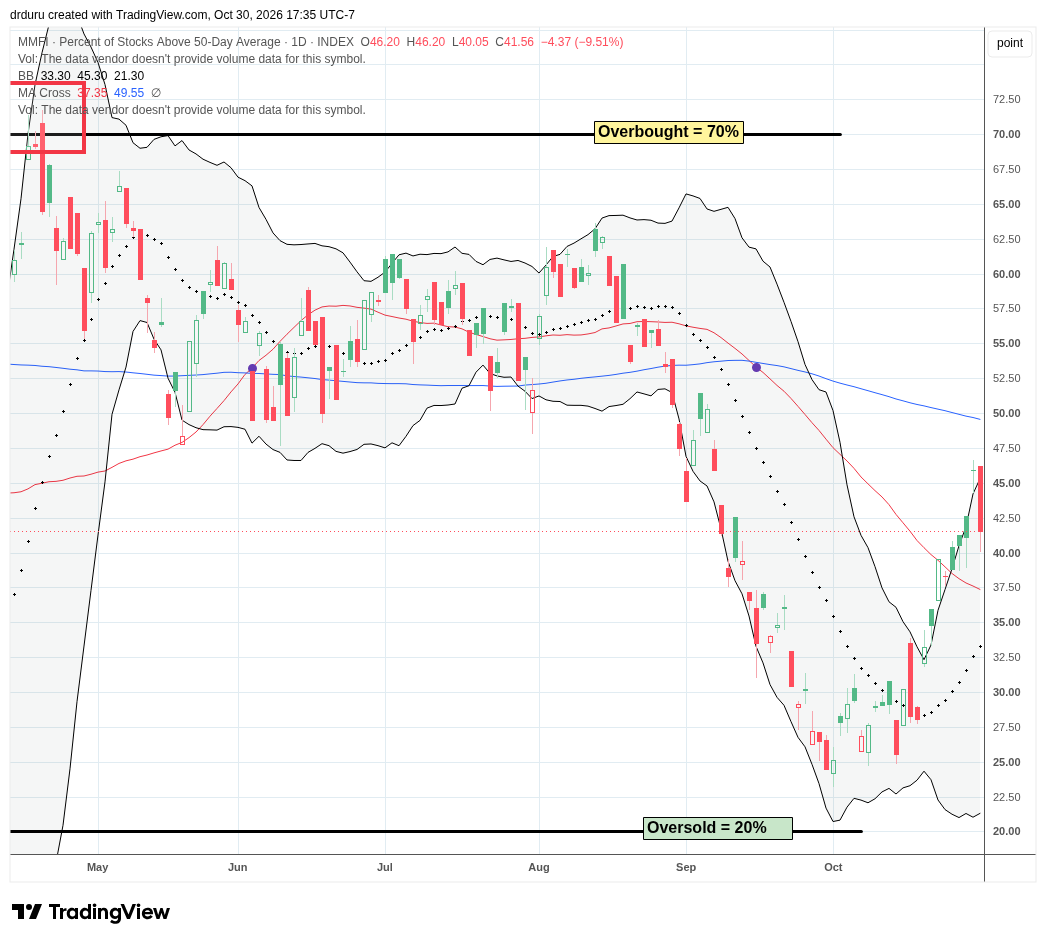
- AT50 (MMFI) = 41.6% of stocks are trading above their respective 50-day moving averages
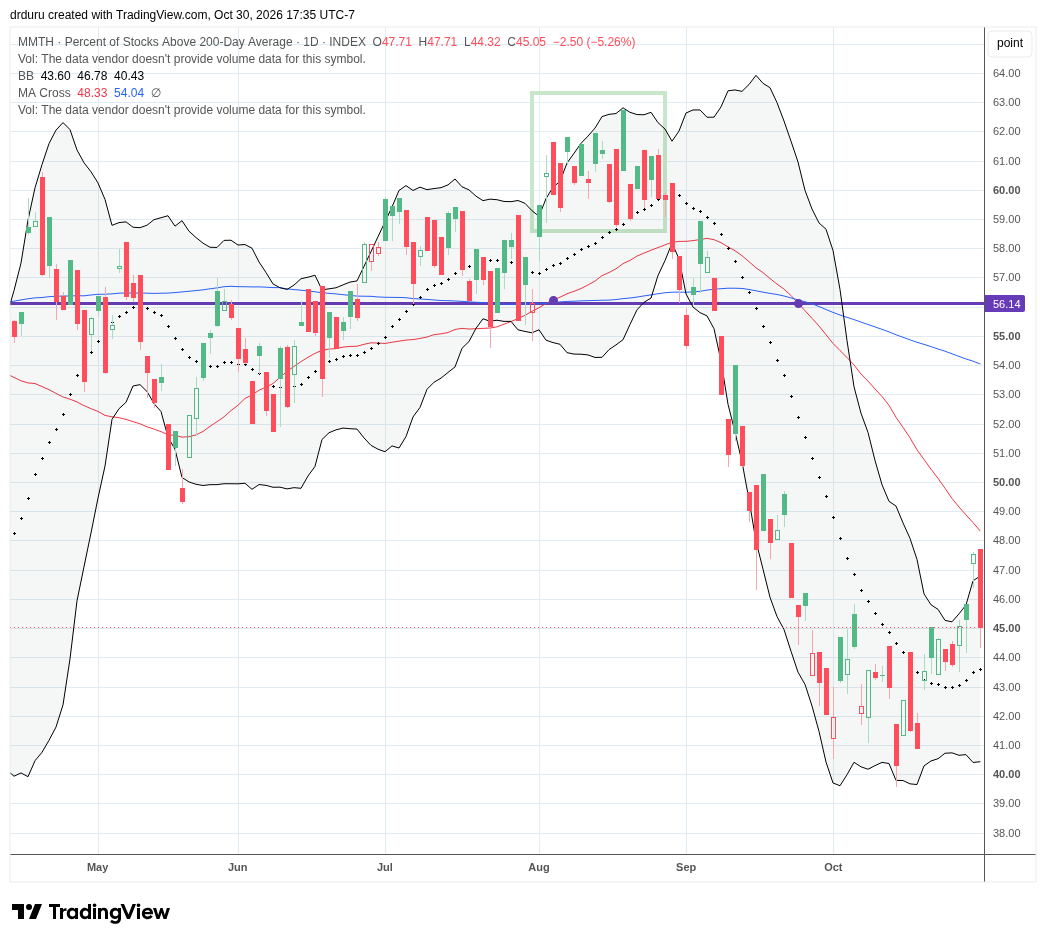
- AT200 (MMTH) = 45.1% of stocks are trading above their respective 200-day moving averages
- Short-term Trading Call: neutral
AT50 (MMFI), the percentage of stocks trading above their respective 50DMAs, closed the week at 41.6%. My favorite technical indicator followed the previous week’s 10 percentage point surge with another eight percentage point gain through Thursday. The selling on Friday was strong enough to cut the week’s gain in half. Still, AT50 remains in an uptrend in an enduring sign of the rotation out of a topping AI trade.
AT200, the percentage of stocks trading above their respective 200DMAs, added confirmation on the bullish underlying health in the stock market through Thursday. Friday’s pullback reversed the entire breakout for the week. Support at Friday’s close of 45.1% needs to hold to maintain a bullish bias for market breadth. Otherwise, I will brace for a broader pullback in the stock market, including the stocks which have been attracting money away from the topping AI trade.
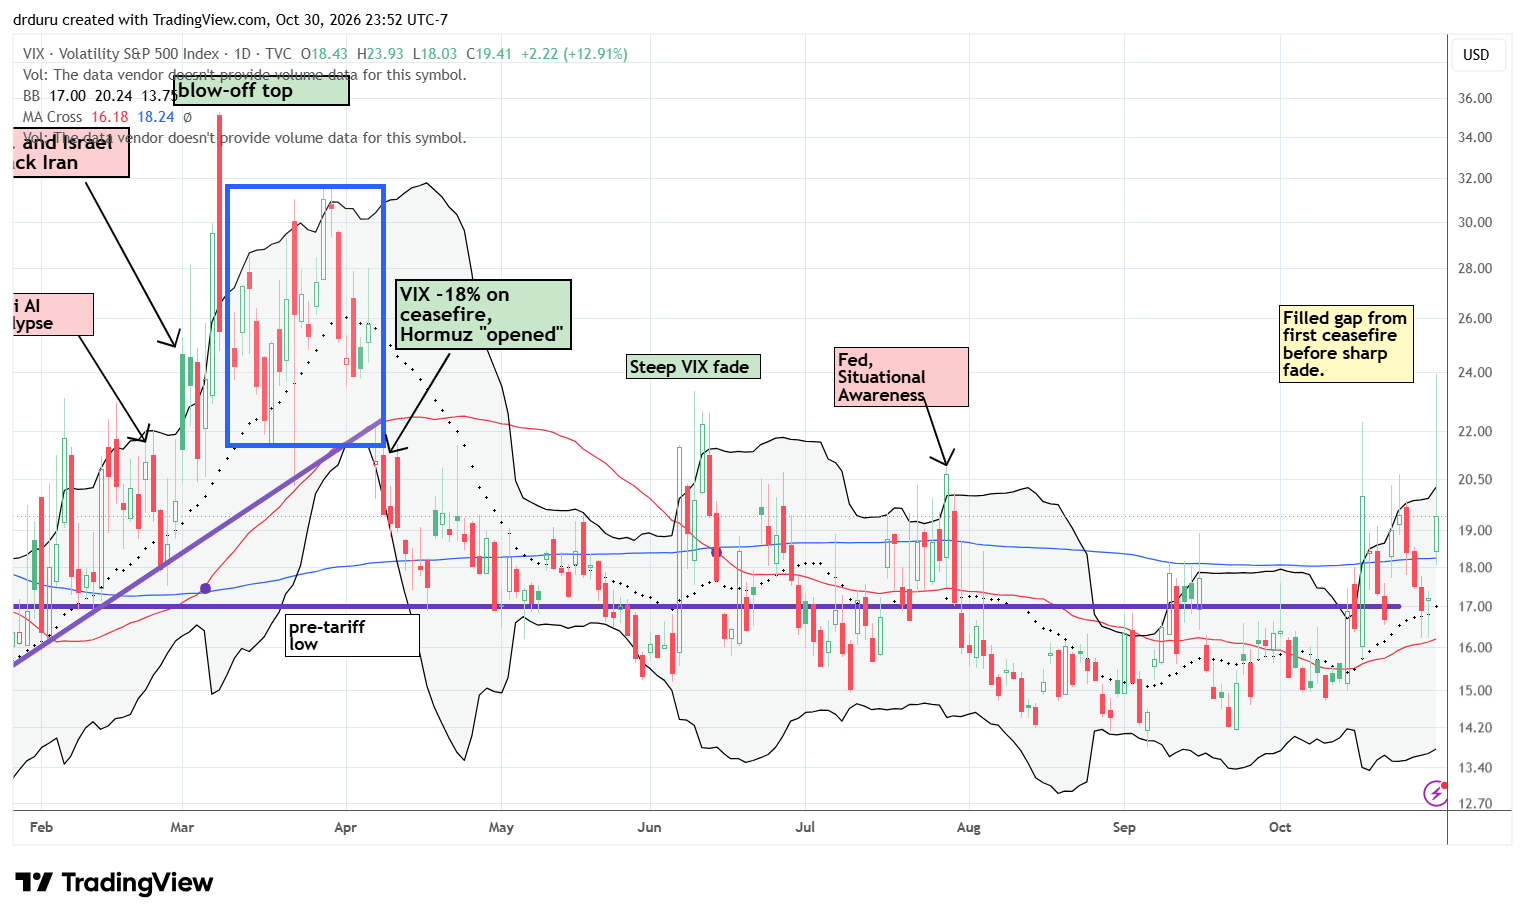
The volatility index (VIX) had another volatile week. Friday’s 12.9% gain belies a major fade from the intraday high. At one point, the VIX traded at 24, a level that nearly closed the gap down from the first cease fire in the Iran war. With the VIX closing below the highs of October, I have slightly more confidence that the market is ready to charge ahead in what is its seasonally strong period (from November through April).
Even with the seasonally strong period ahead, the strength of market breadth in October suggests that short-term gains will be modest. I am using the following rules to guide my trading through at least the end of the year:
- Avoid new positions in stocks ahead of their earnings report.
- Focus buys of individual stocks on breakouts, especially moves that end downtrends.
- Maintain a bias against getting cute with support for highly volatile stocks, especially those in the topping AI trade (I present some notable exceptions below).
- Getting cute with support is ok for ETFs and indices given the reduced risk profile.
- Predefine stop loss points and remain disciplined on cutting losses short.
- Treat AI stocks like trades, not investments, until breakouts lead to the end of downtrends and topping patterns.
In Case You Missed It….
I made a fortuitous trade when I took profits in my latest cycle on the 20% rule for the iShares MSCI Brazil ETF (EWZ). Lula ended up winning the presidency and EWZ promptly plunged 19.8%. I bought right back into EWZ.
The Equities
VanEck Semiconductor ETF (SMH)
Description: The VanEck Semiconductor ETF tracks an index of major U.S.-listed semiconductor companies involved in chip design, manufacturing, and related technologies.
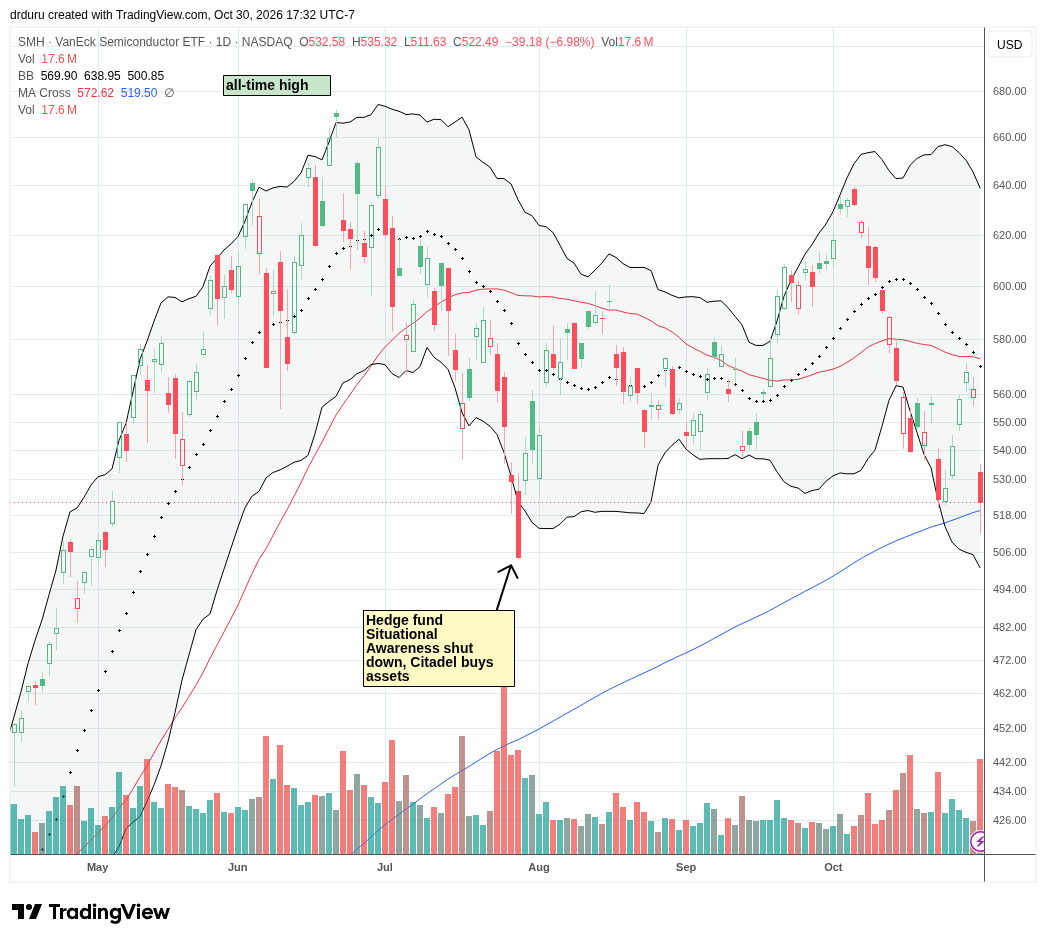
Technical Status: Buyers just barely saved the VanEck Semiconductor ETF (SMH) from a bearish 200DMA breakdown on Friday’s 7.0% loss.
Trade Commentary: Sitting at the center of the AI trade, SMH offered a confirmation of a topping trade. The ETF started the week in relief rally mode with three days of gains and a surge away from 200DMA support. However, it stalled right under 50DMA resistance and INTC’s earnings disaster helped SMH fall right back toward 200DMA support. Given buyers barely saved SMH from a 200DMA breakdown and a test of July’s Situational Awareness low, I am not interested in getting cute with support here. I am content to wait for SMH to reestablish bullishness with a 50DMA breakout.
Alphabet Inc. (GOOG)
Description: Alphabet is the parent company of Google and operates businesses spanning internet search, digital advertising, cloud computing, and artificial intelligence.
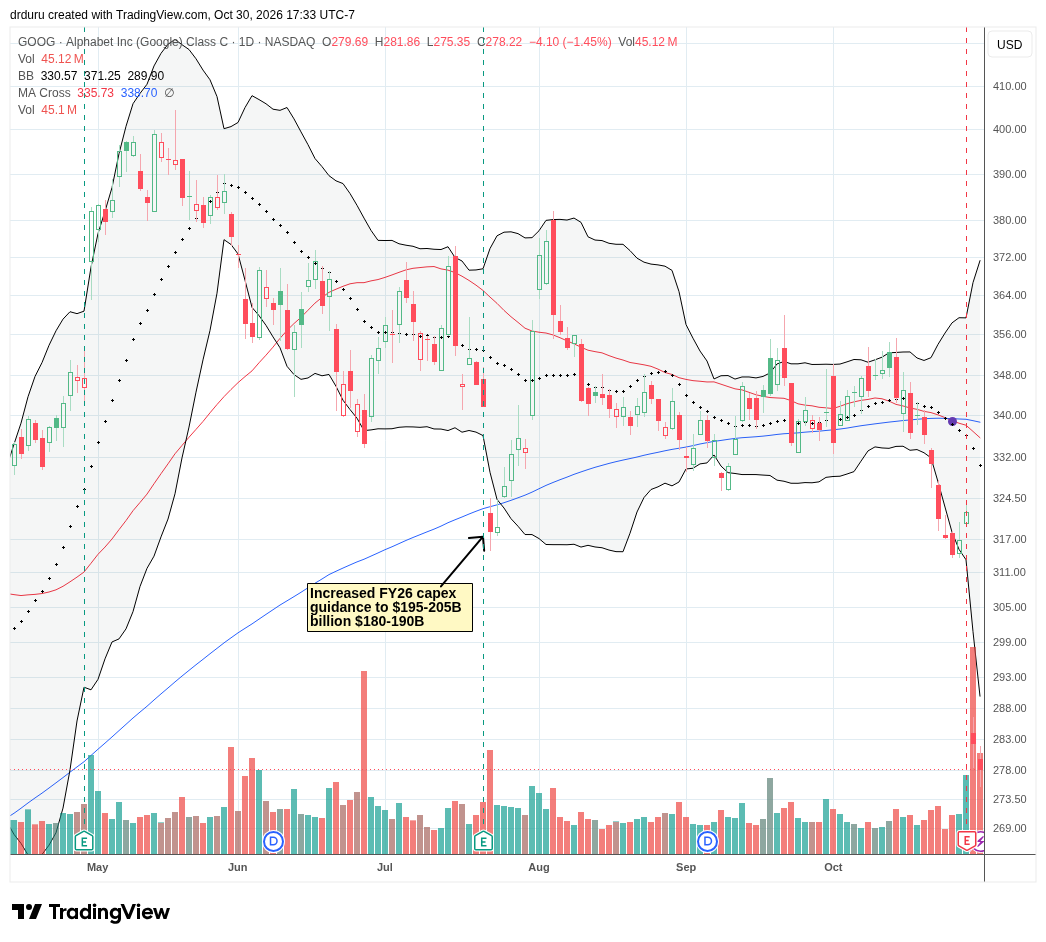
Technical Status: Alphabet Inc (GOOG) sellers followed up an historic 12.3%, half a trillion, post-earnings loss with a 1.5% loss and push toward the year’s low set in March.
Trade Commentary: Alphabet’s October 28 earnings became one of several defining tests of the AI investment thesis. Despite substantial growth in Google Cloud, weaker-than-expected advertising results and another ambitious capital spending outlook seemed to raise concerns about the financial returns from AI spending. GOOG’s subsequent 12.3% post-earnings loss was the stock’s largest ever one-day decline. The half a trillion dollar loss in value fully plunged GOOG into bearish territory. My fears about the technical deterioration in the stock played out in just about the worst possible fashion. With the stock precariously avoiding a test of its low for the year set in March, I am clinging to my long-term investment. I also tried a speculative short-term trade on a relief bounce toward at least the lower Bollinger Band (BB). (Kyla Scanlon did a funny bit on Google’s earnings combined with dry commentary on the Fed’s non-action last week).
Vertiv Holdings Co. (VRT)
Description: Vertiv provides power management, thermal management, and infrastructure systems supporting data centers, communications networks, and critical digital operations.
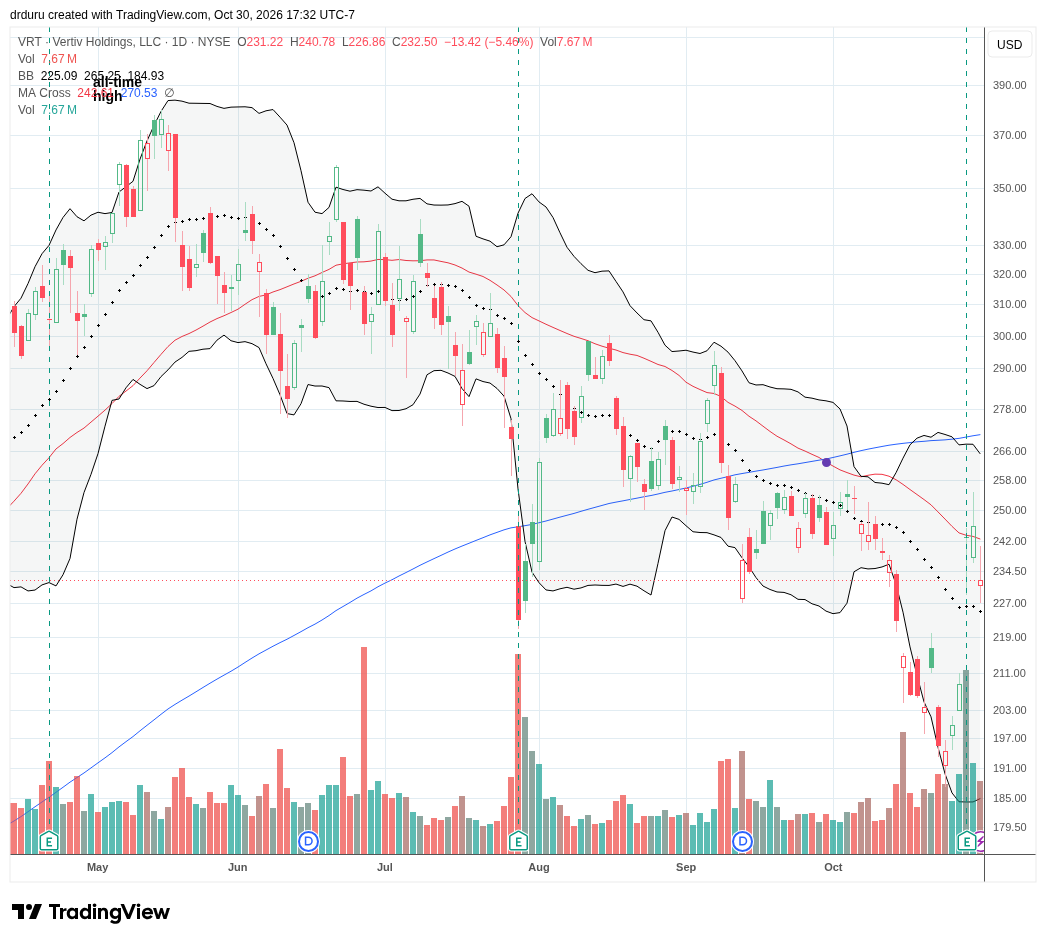
Technical Status: Vertiv Holdings Co. (VRT) rebounded with Thursday’s 16.5% post-earnings gain but Friday’s selling confirmed 50DMA resistance.
Trade Commentary: Vertiv held up its end of the bargain to support the AI trade. My favorite individual stock in the sector roared higher post-earnings although Friday’s pullback reestablished downtrendng resistance from its 50-day moving average (DMA) (the red line). The company reported October 28 third-quarter revenue growth of 61%, organic orders growth exceeding 100%, and adjusted earnings-per-share growth of 78%. Most importantly, management raised its full-year outlook. While I love the results, I am staying patient and will not reenter VRT until it reestablishes a bullish technical position with a 200DMA breakout.
Sandisk Corporation (SNDK)
Description: Sandisk develops and manufactures flash memory, solid-state storage, and related data-storage technologies for consumer, enterprise, and data-center markets.
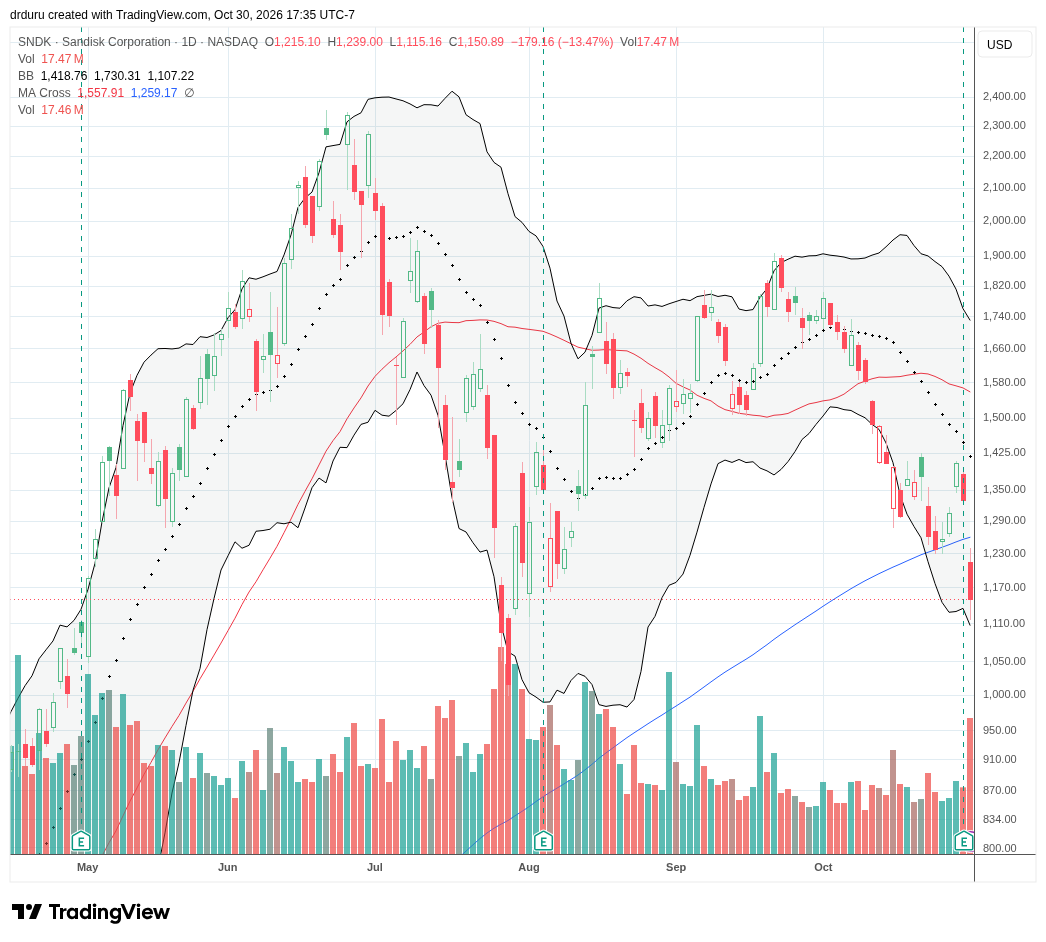
Technical Status: Sandisk Corporation (SNDK) lost 13.5% post-earnings and suffered a bearish 200DMA breakdown.
Trade Commentary: Sandisk’s October 29 earnings illustrated the contrast between accelerating AI demand and increasingly fragile investor sentiment creating a top in the AI trade. Fiscal first-quarter revenue reached $11 billion, up 23% sequentially, while data-center revenue increased 61% from the preceding quarter. Management projected another sequential revenue increase and announced an eight-for-one stock split. Despite this news, SNDK still plunged 13.5% post-earnings and closed below its 200DMA for the first time since reentering the public markets. While SNDK is now in rare bearish territory, it has yet to breach its Situational Awareness low from July. Given the proximity to the round $1000 number, I would consider getting cute with support with the stock extended well below its 200DMA at that point.
Roundhill Memory ETF (DRAM)
Description: The Roundhill Memory ETF is an actively managed fund investing in companies involved in semiconductor memory and data-storage technologies, including DRAM, high-bandwidth memory, and NAND flash.
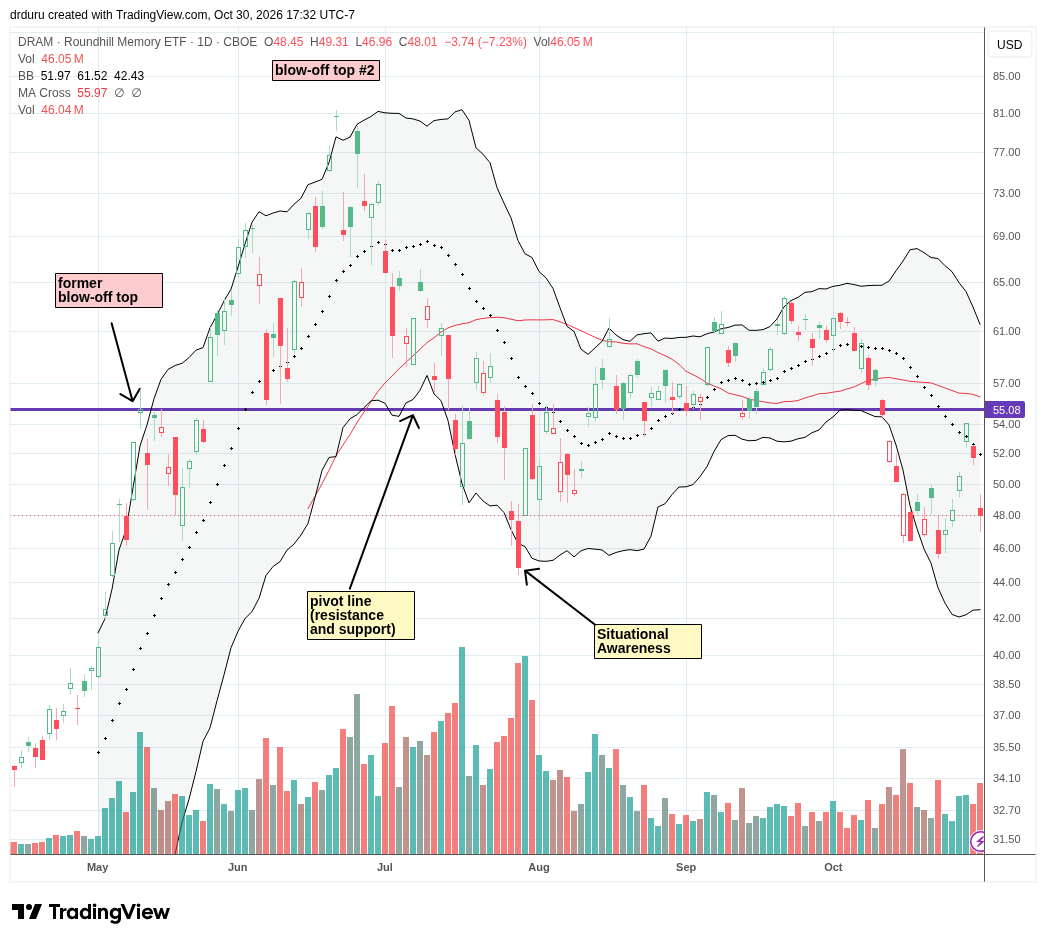
Technical Status: The Roundhill Memory ETF (DRAM) lost 7.2%, falling away from resistance from a former blow-off top.
Trade Commentary: DRAM fell in sympathy with SNDK’s plunge. While the ETF of memory stocks fell away from critical resistance from its former blow-off top in May, I like the amount of support available around $46. Note buyers refused to let DRAM fall below that level at the October lows. And of course those lows coincide with the July Situational Awareness low.
VistaShares Artificial Intelligence Supercycle ETF (AIS)
Description: The VistaShares Artificial Intelligence Supercycle ETF is an actively managed fund providing exposure to companies participating in artificial intelligence infrastructure, computing, and related technologies.
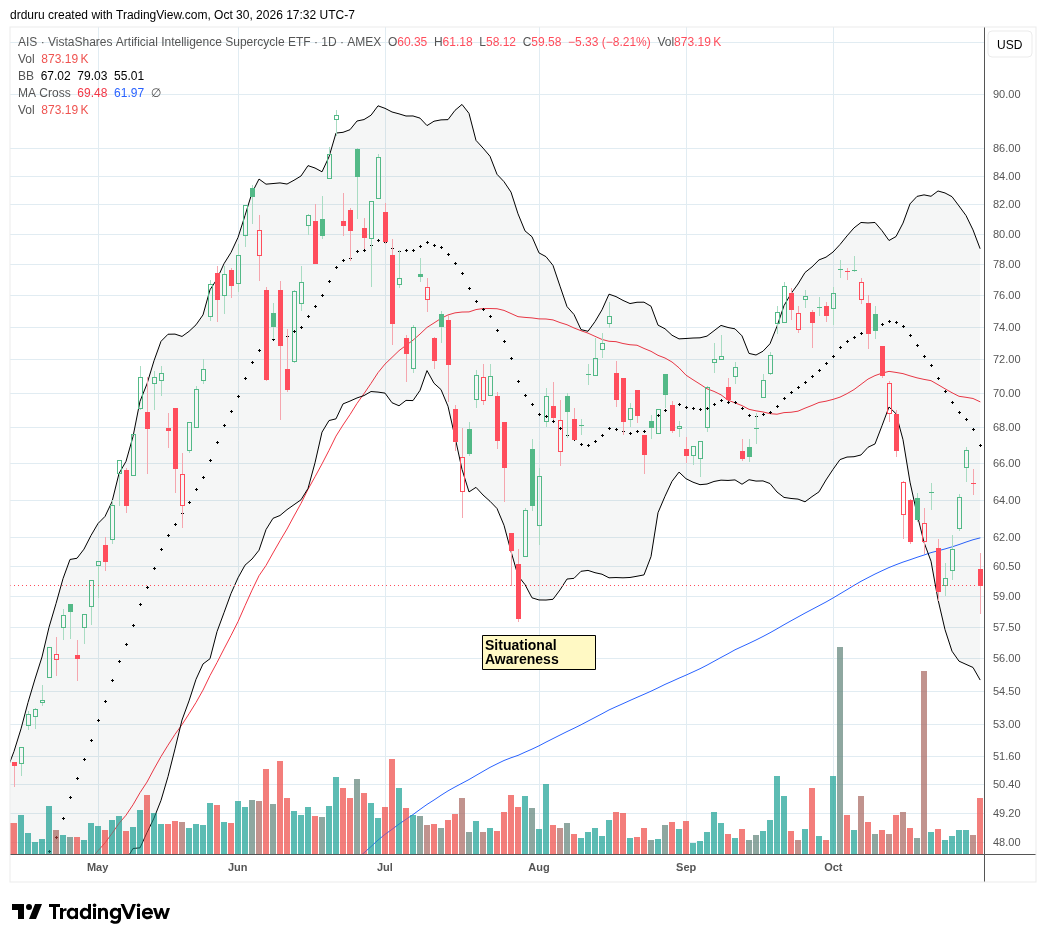
Technical Status: The VistaShares Artificial Intelligence Supercycle ETF (AIS) suffered a bearish 200DMA breakdown with an 8.2% loss. Buyers pulled the ETF away from the Situational Awareness closing low.
Trade Commentary: AIS provides a broad perspective on the AI trade with components including computing infrastructure, memory, power systems, and other components of AI deployment. Thus, its second 200DMA breakdown in two weeks creates a bright red warning flag on the AI trade. Buyers prevented a confirming bearish close below the July Situation Awareness low, but support looks tenuous. A lower close will push me out of my recent AIS purchase and motivate me to expand my retreat from a topping AI trade. To the upside, I am a profit-taker near 50DMA resistance.
Intel Corporation (INTC)
Description: Intel designs and manufactures semiconductor processors and related computing technologies while developing a semiconductor foundry business.
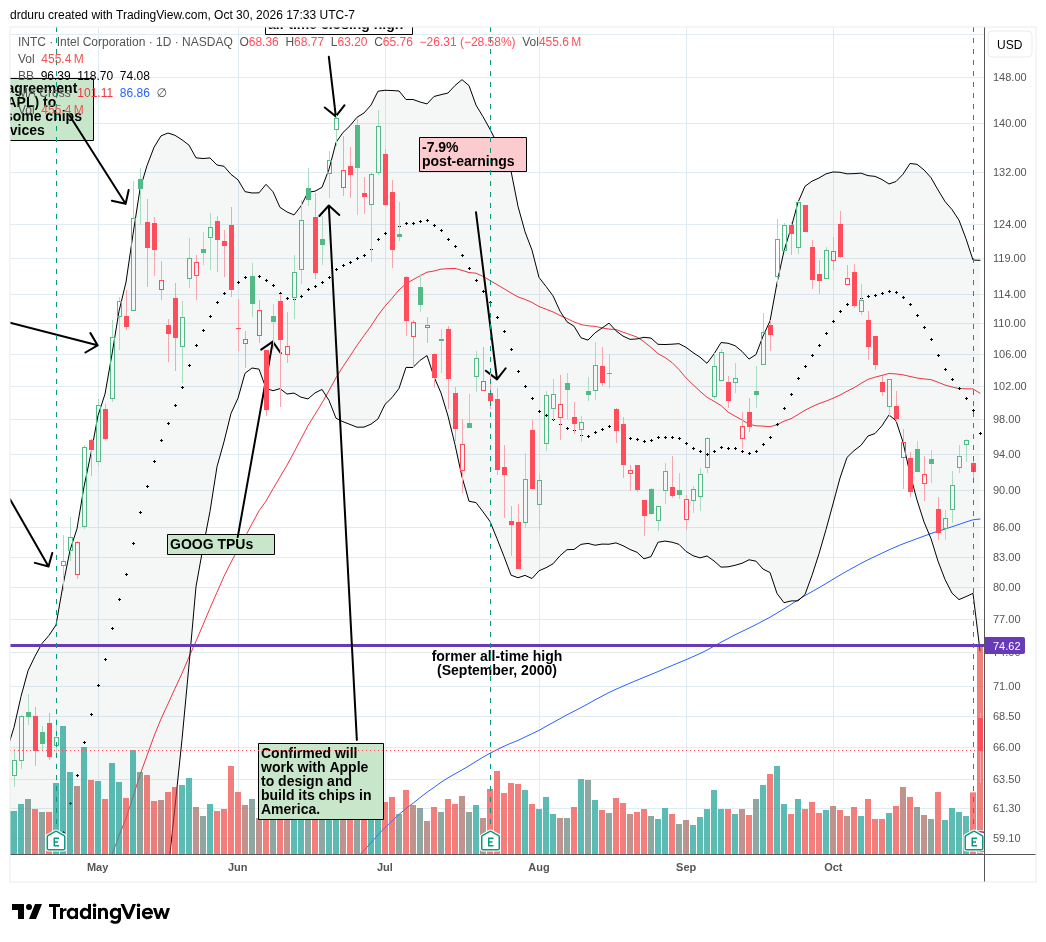
Technical Status: Intel Corporation (INTC) suffered an historic 28.6% post-earnings loss and reversed all its gains from April’s post-earnings surge.
Trade Commentary: Intel delivered the week’s most dramatic semiconductor earnings reaction; perhaps it will be the most dramatic for this earnings season. The company’s October 29 report included disappointing fourth-quarter guidance, with concerns about personal-computer demand, manufacturing execution, and cash requirements dominating revenue growth. INTC’s resulting 28.6% post-earnings plunge was the stock’s largest one-day loss since 1974! I am guessing the downside move was exaggerated by INTC’s extremely high valuation. Even after the price collapse, INTC still has a forward non-GAAP P/E of 44.
After slicing through 200DMA support (which held perfectly the prior week) and $75 support from the previous historic all-time high from the dot com bubble, INTC looks quite precarious. The stock slammed into support at $65 which represents a complete reversal from the April post-earnings surge. The stock can hardly get more bearish at this point, especially with further valuation compression likely ahead. When buyers show interest again, I would consider getting cute with support for a trade back to or close to what is now $75 resistance.
Innodata Inc. (INOD)
Description: Innodata provides data engineering, annotation, model evaluation, and related services supporting artificial intelligence development and enterprise information processing.
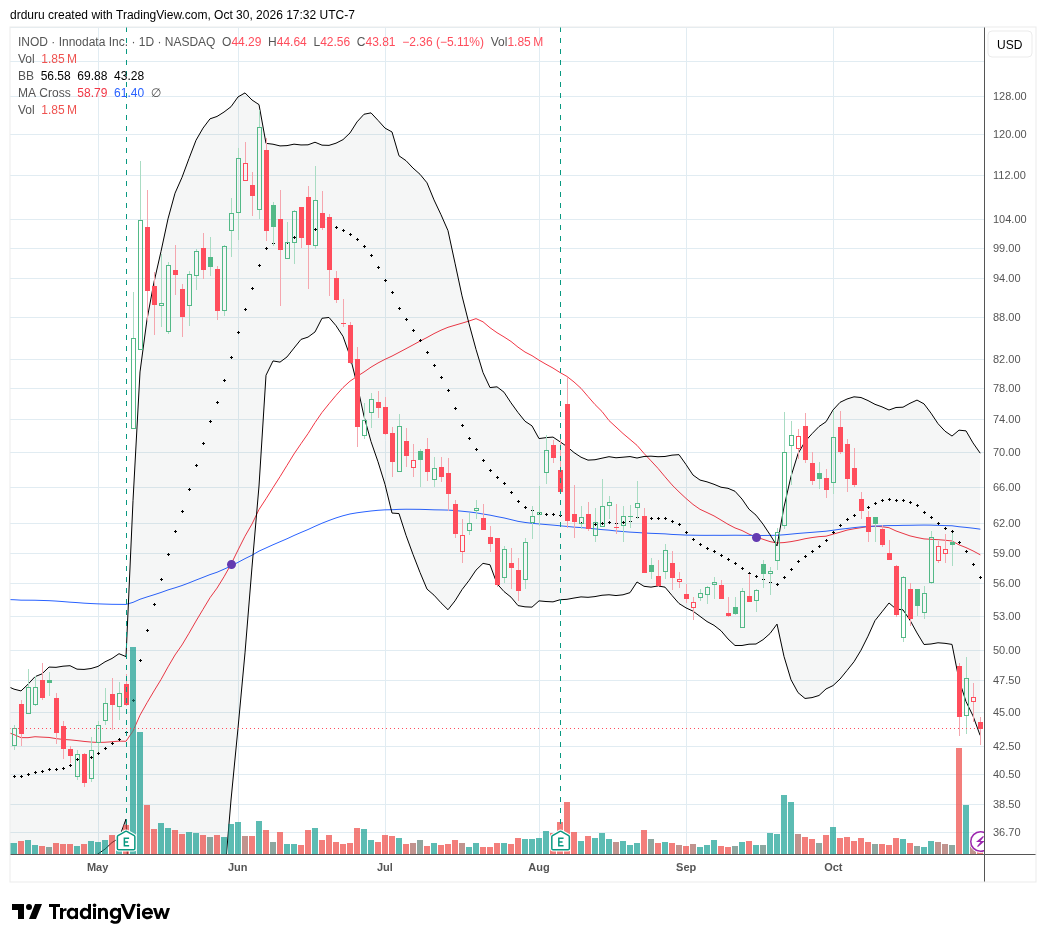
Technical Status: Innodata Inc. (INOD) suffered a 25.2% loss on Tuesday that finished reversing gains from May’s post-earnings surge.
Trade Commentary: Innodata delivered a warning about the risks beneath the AI services growth narrative. Reports emerged about abrupt layoffs affecting workers in India and the Philippines following an apparent reduction in business assignments. The reports raised concerns about the stability of customer demand. In an environment of bearish AI sentiment, this kind of bad news was enough to tank INOD by 25.2% on Tuesday. A rebound attempt on Wednesday was quickly reversed the rest of the week. With May’s post-earnings 86% surge now fully reversed, I am looking for an entry point to trade the next turn in trader sentiment to the upside.
ServiceNow Inc. (NOW)
Description: ServiceNow provides cloud-based enterprise software for digital workflows, IT service management, automation, and artificial intelligence applications.
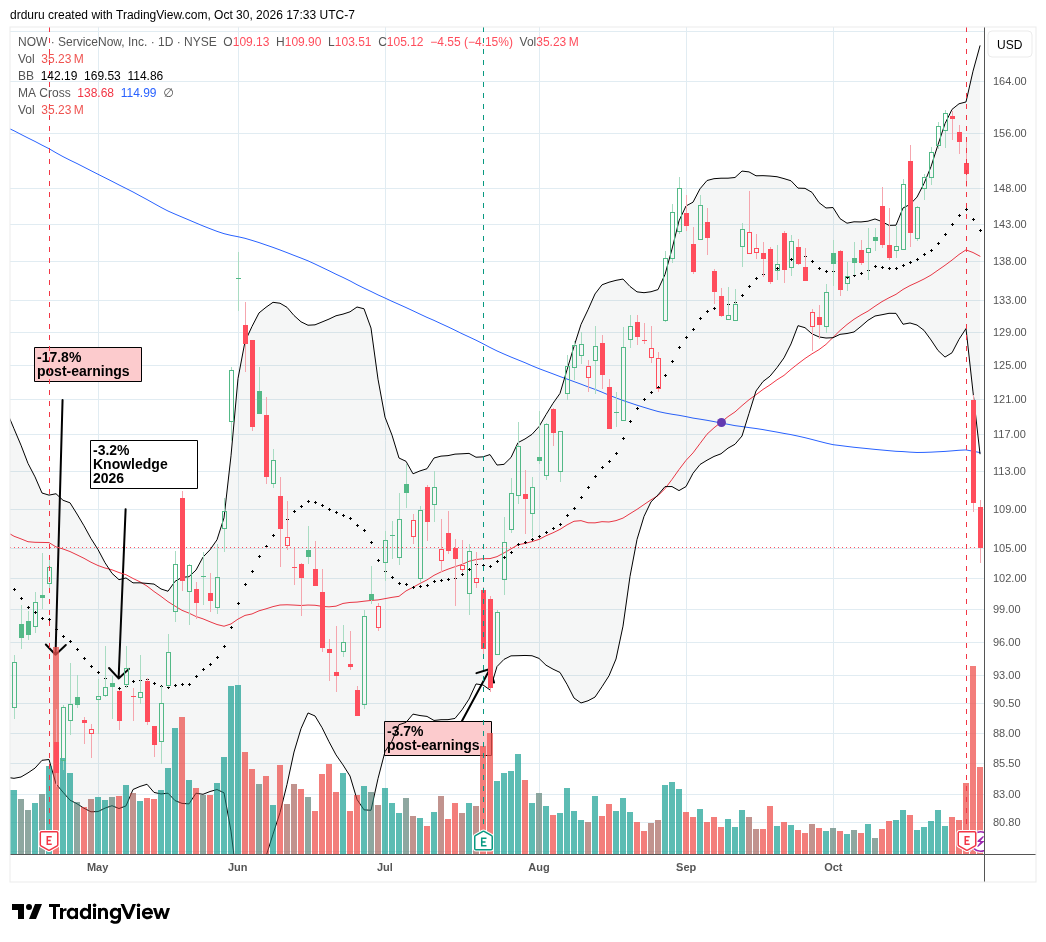
Technical Status: ServiceNow Inc. (NOW) suffered its largest one-day loss with a 27.0% post-earnings plunge and bearish 200DMA breakdown. Sellers followed up with a 4.2% loss the next day.
Trade Commentary: ServiceNow’s October 28 earnings report demonstrated continued enterprise demand for workflow automation and AI-enabled software. Subscription revenue increased 21% to nearly $4 billion, while current remaining performance obligations reached $13.65 billion. Management raised its 2026 AI annual contract value target to $1.7 billion, approximately 70% above its target at the beginning of the year. However, none of this good news was enough to stay the sellers. They took NOW down for its biggest one-day loss ever. The follow-up selling on Friday removed any interest I might have had in adding to my shares in the middle of the latest panic over NOW. So now I will just bide my time again in what is one of my last core positions in the PAIROS trade. I will release soon an updated analysis for NOW.
Atlassian Corporation (TEAM)
Description: Atlassian develops collaboration, project management, and software development tools used by business and technology teams.
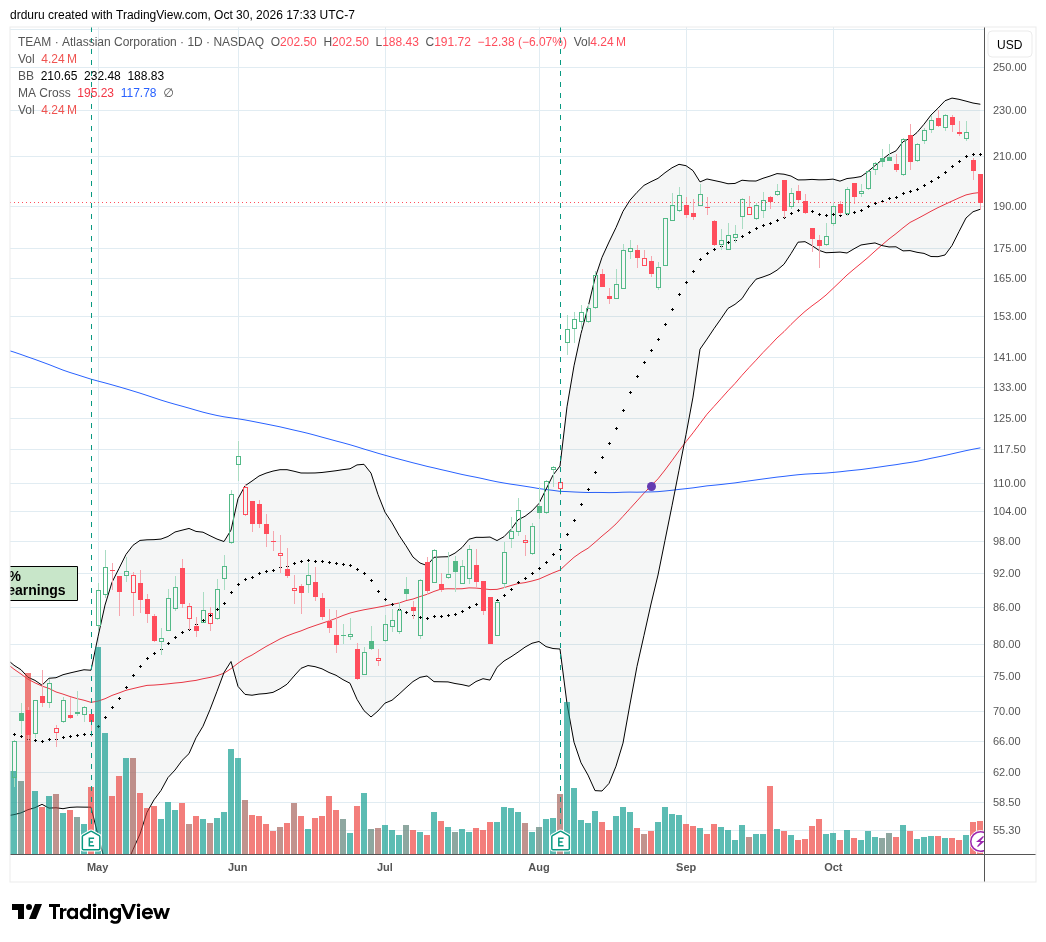
Technical Status: Atlassian Corporation (TEAM) fell in sympathy with NOW and suffered a 50DMA breakdown on a 6.1% loss.
Trade Commentary: Atlassian introduced its Context Quality Score framework on October 29, expanding its effort to improve the performance of enterprise AI applications. The technology evaluates the completeness, connectedness, and relevance of information supplied to AI systems, highlighting an opportunity beyond selling computing infrastructure. However, such news was not enough to prevent contagion from the selling in NOW. Two days of selling in sympathy dragged TEAM into a 50DMA breakdown. It is ironic that I took premature profits in TEAM and thus promoted NOW, by default, to a core PAIROS holding. I still have no near-term plans to get back into TEAM, but NOW’s outsized selling has me even more interested in watching the post-earnings reaction for TEAM!
QUALCOMM Incorporated (QCOM)
Description: Qualcomm designs wireless communication chips, mobile computing processors, and related semiconductor technologies while licensing intellectual property.
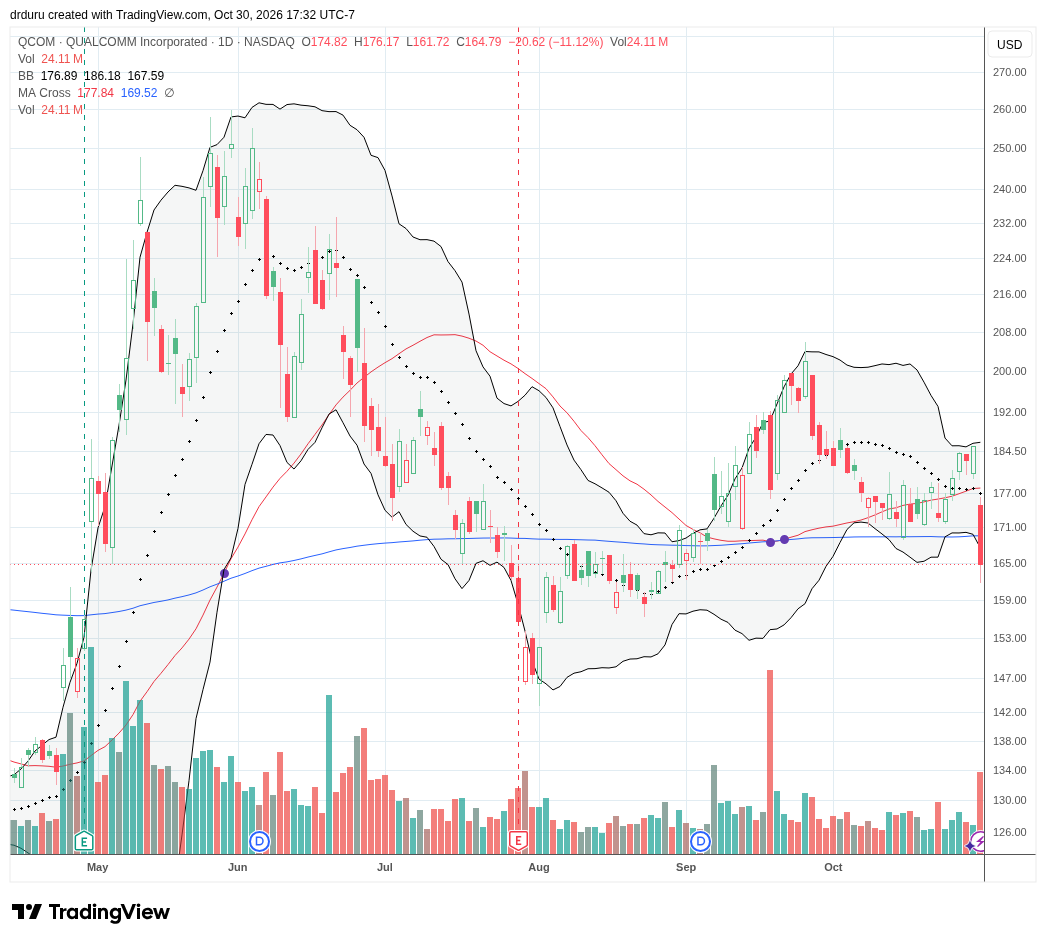
Technical Status: QUALCOMM Incorporated (QCOM) lost support at its 200DMA with an 11.1% plunge.
Trade Commentary: QCOM fell in sympathy with INTC and in the process returned to a bearish position below both its 50DMA and 200DMA. Before INTC’s earnings the stock was looking good for a fresh rally. Now I am preparing to limit my losses in the stock if it makes a lower close.
Reddit Inc. (RDDT)
Description: Reddit operates an online community platform where users create, share, and discuss content across topic-based forums supported primarily by advertising.
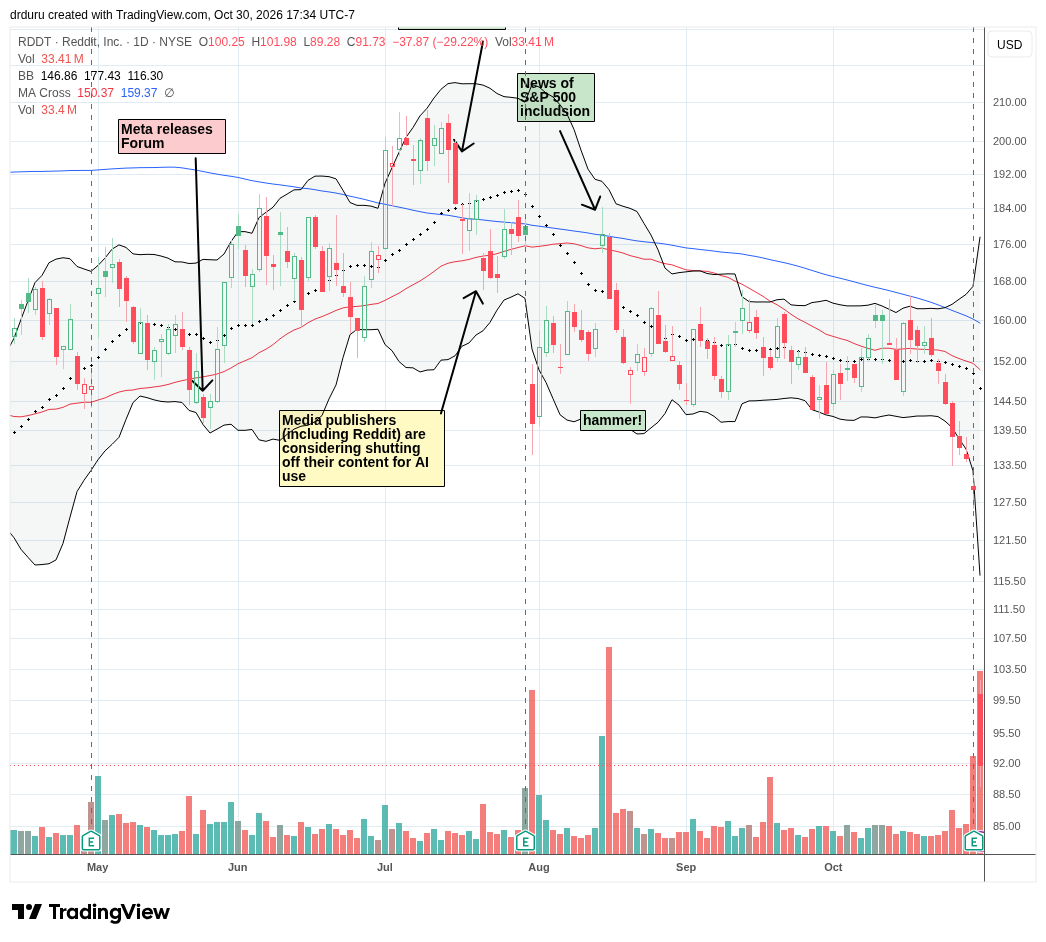
Technical Status: Reddit Inc. (RDDT) collapsed with a 29.2% post-earnings loss and an 18-month low.
Trade Commentary: Reddit’s October 29 earnings report highlighted the difference between rapid monetization and slowing audience growth. Quarterly revenue increased 53% to $895 million, while daily active unique users grew 12% to 130.3 million. Despite impressive revenue and profitability growth, investors focused on weaker audience trends and concerns about declining traffic referrals from Google. I worked in digital media for a long time, and I know all too well the dilemma Reddit faces when trying to monetize traffic from low quality organic search referrals. Now, AI summaries have forced RDDT’s hand to focus its business model on logged in users. It’s a high-risk gambit that invalidates my previous bull case. Fortunately the technicals motivated me to take profits and then to stay away from the stock, so I avoided this disaster. RDDT should rebound at least to its lower Bollinger Band if investor sentiment improves in the short-term.
Twilio Inc. (TWLO)
Description: Twilio provides cloud communications software and APIs enabling businesses to manage customer interactions across messaging, voice, email, and digital channels.
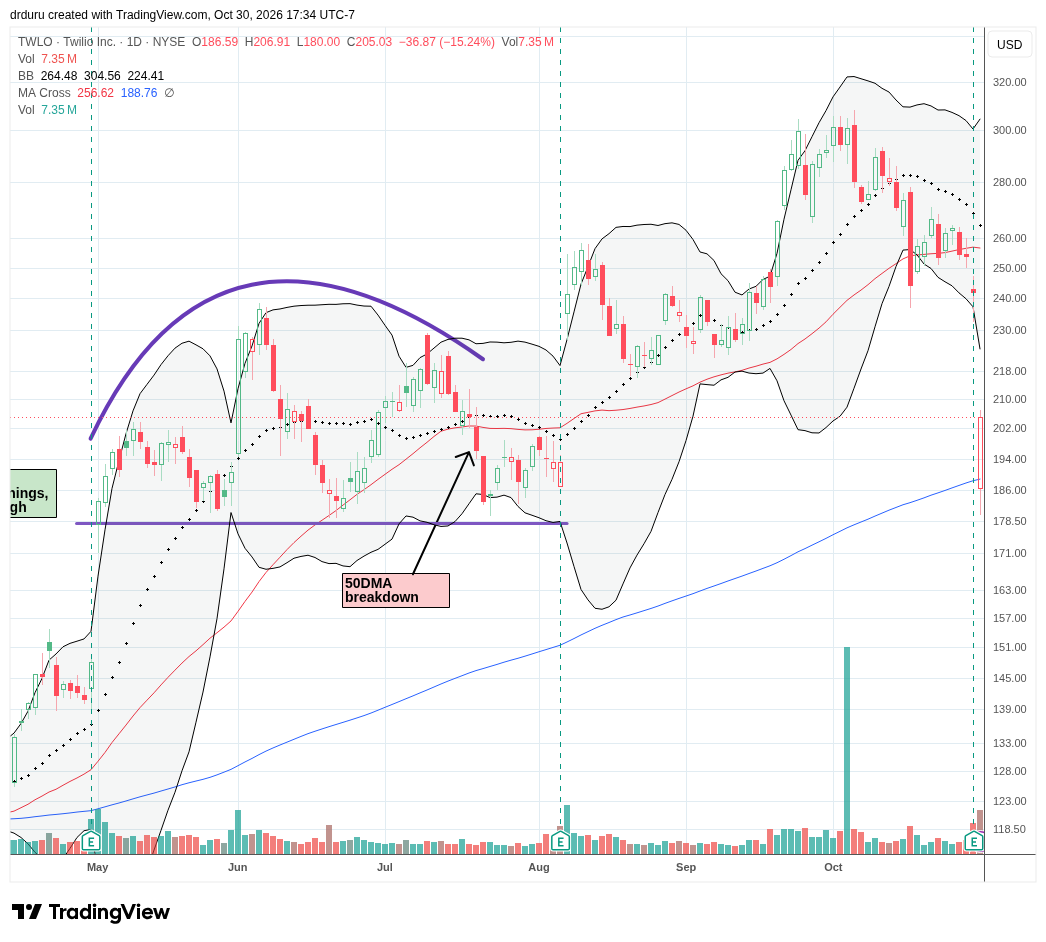
Technical Status: Twilio Inc. (TWLO) survived 200DMA support after a net 15.2% post-earnings loss that at one point finished reversing August’s post-earnings surge.
Trade Commentary: Twilio reported earnings on October 29 and delivered quarterly revenue of $1.56 billion, representing 20% year-over-year growth. Management increased its full-year revenue growth outlook and raised expectations for operating income and free cash flow. Yet, TWLO joined the broader technology weakness following earnings. If I had TWLO on my radar, I would have speculated on an intraday bounce from 200DMA support given TWLO’s earnings look fine. I have the stock at the top of my shopping list in the coming week as a stock worth getting cute with support. Note that, ironically enough, TWLO is already below the previously invalidated topping pattern that had me concerned over the summer.
Amplify Cybersecurity ETF (HACK)
Description: The Amplify Cybersecurity ETF invests in companies providing cybersecurity software, hardware, network protection, and related digital security services.
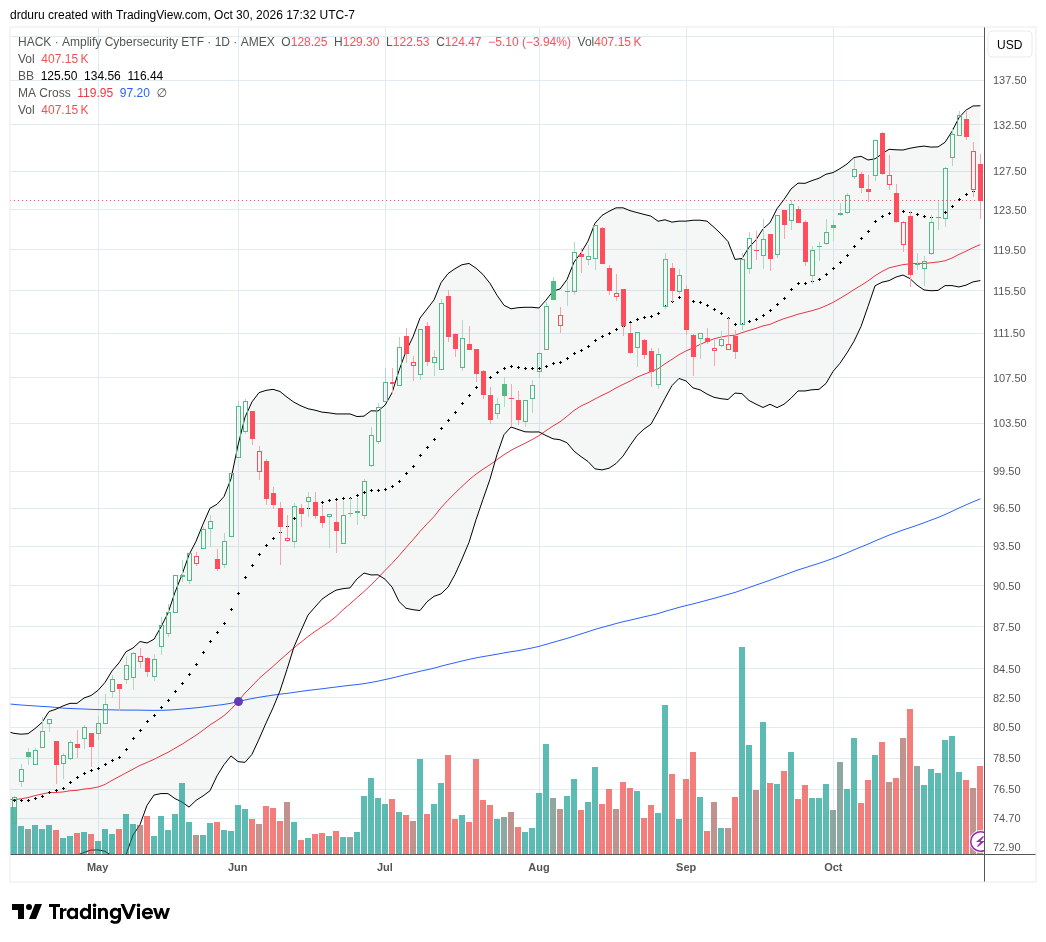
Technical Status: Amplify Cybersecurity ETF (HACK) repeated its pattern of rebounding off 50DMA support and promptly reversing after an all-time high.
Trade Commentary: HACK has provided a surprisingly consistent trade for the past several months: buy at or near the 50DMA and sell at or near the next all-time high. I finally got wise to the pattern for two trades. The last one I tried to hold out for a continuation rally. Instead, my trailing stop was tripped on Thursday’s pullback. Now I wait for the next test of 50DMA support.
Caterpillar Inc. (CAT)
Description: Caterpillar manufactures construction and mining equipment, industrial engines, power-generation systems, and related machinery.
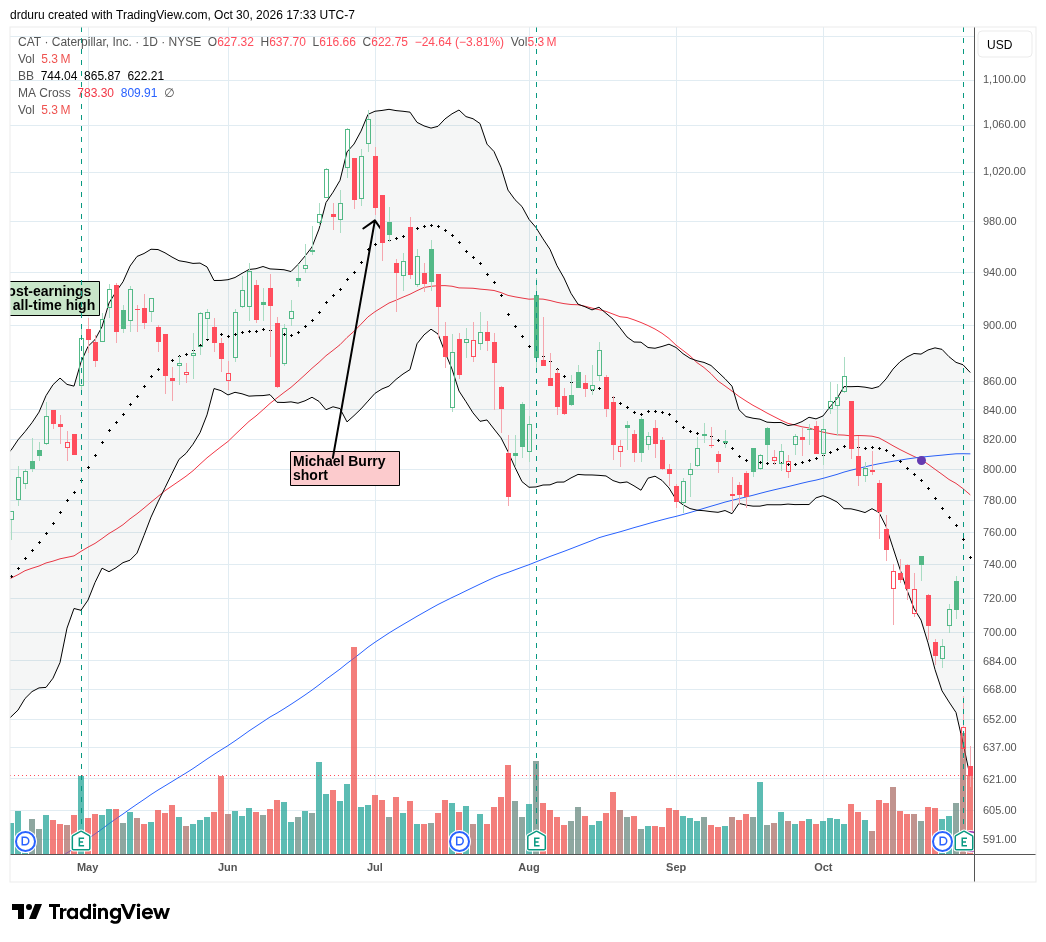
Technical Status: Caterpillar Inc. (CAT) lost 9.3% post-earnings and Friday’s follow-up selling pushed the stock to its last all-time high of 2025.
Trade Commentary: Caterpillar’s October 29 earnings report showed third-quarter sales increased 17% to $20.7 billion. Management highlighted strong order rates and a record backlog, supporting demand across its industrial businesses. As a reminder of how CAT entered into the AI trade, the company announced that “power generation grew 75%, driven by continued very strong demand for turbines and large reciprocating engines used in data center applications.” However, analyst questions during the conference call revealed broad disappointment with trends and guidance. CAT’s resulting 9.3% post-earnings loss further confirmed its top and validated the short thesis Michael Burry made shortly after CAT’s all-time high in June.
I am of course glad that I stopped out of my CAT position well ahead of earnings. This episode is one more reminder of the importance of trading rules. With CAT deep in bearish territory, I see no need to rush back into the stock. Friday’s gap down and 3.8% loss demonstrated that motivated sellers remain active. CAT also almost reversed all of its gains for 2026. At its all-time high, CAT was up 85.7% for the year, a near double almost wiped out.
ATI Inc. (ATI)
Description: ATI produces specialty materials and advanced alloys used in aerospace, defense, energy, and other industrial applications.
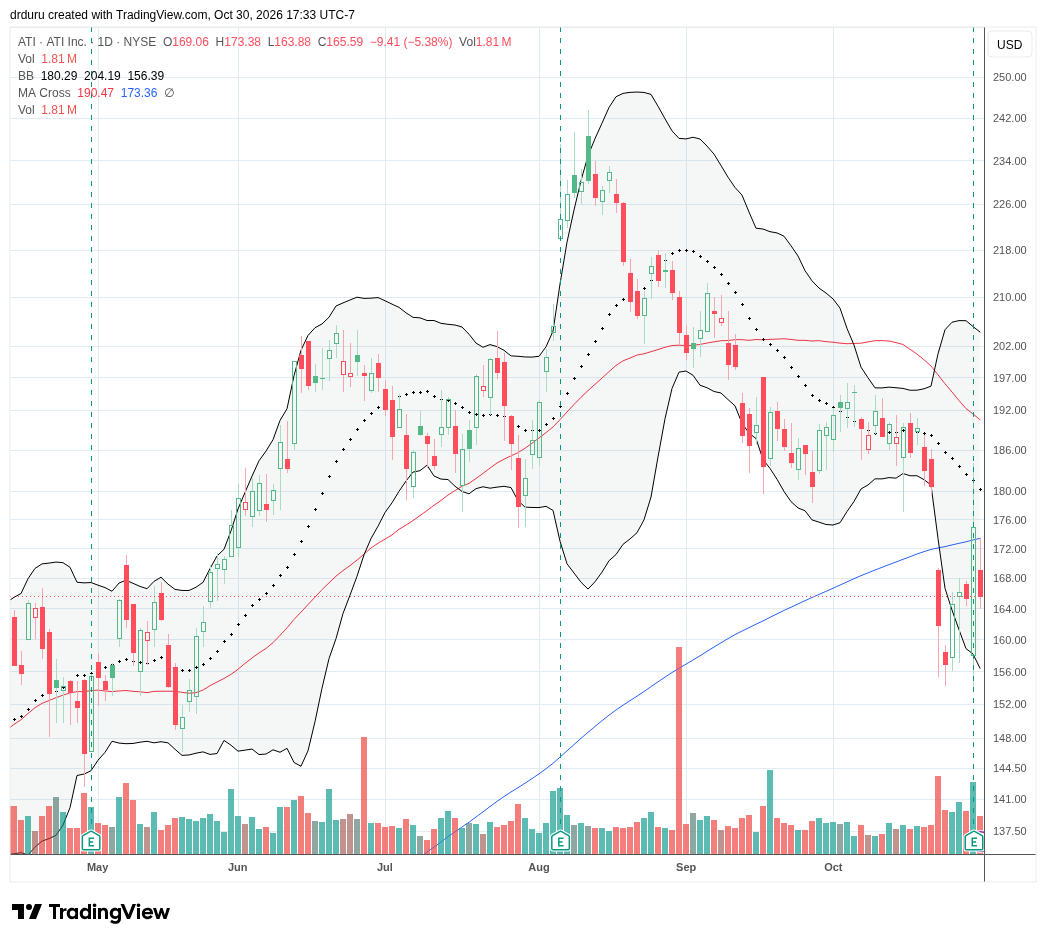
Technical Status: ATI Inc (ATI) survived an initial post-earnings gap down but 200DMA resistance held and Friday’s 5.4% loss took the stock back to its pre-earnings close.
Trade Commentary: ATI reported earnings on October 29. Q3 revenue increased 26% year-over-year to $1.42 billion, adjusted EBITDA rose substantially, and management raised its full-year adjusted EBITDA outlook. The strength reflects demand supported by long-term agreements and differentiated aerospace and defense materials capabilities. While I am disappointed in ATI’s breakdown since a strong post-earnings response in August, I am hanging on to the long-term case that the specialty materials supplied by companies like ATI will become increasingly critical components to a re-industrializing economy.
Cameco Corporation (CCJ)
Description: Cameco is a nuclear energy company involved in uranium production, fuel services, and investments in nuclear power technology and services.
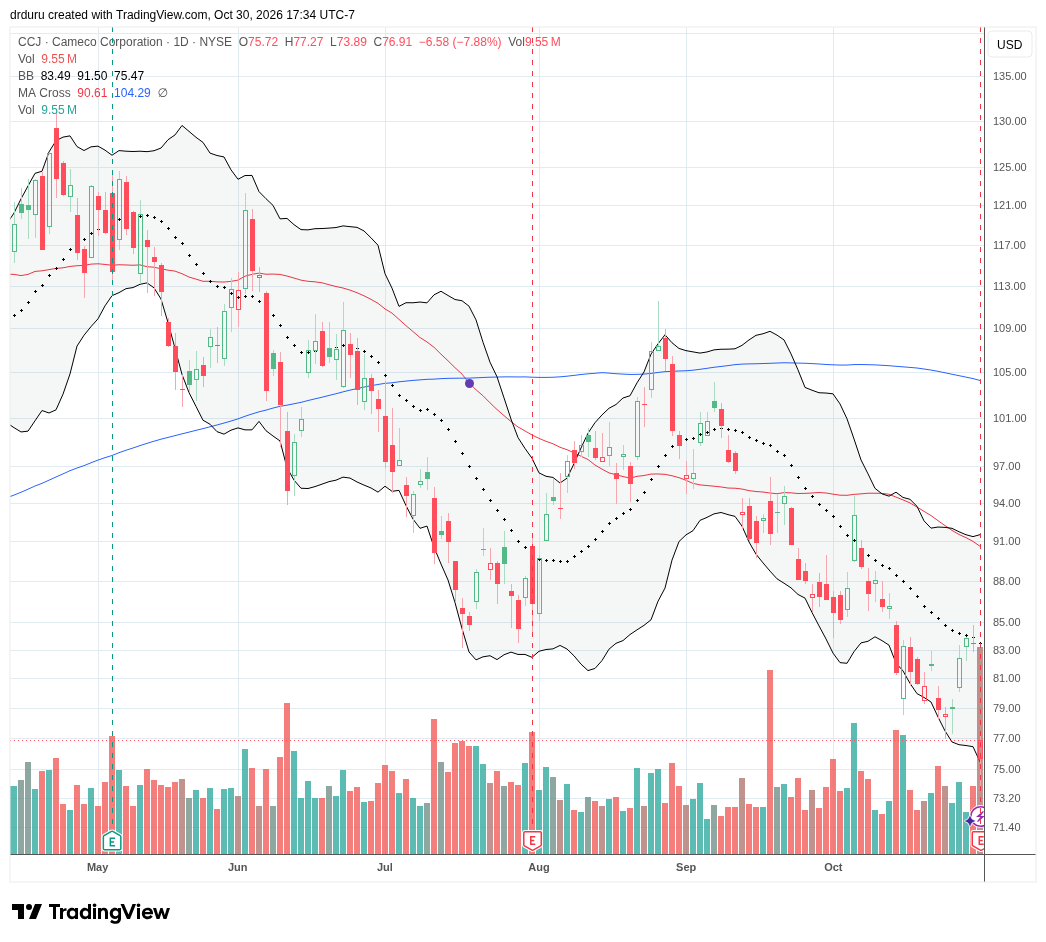
Technical Status: Cameco Corporation (CCJ) lost 7.9% post-earnings and closed at a 13-month low.
Trade Commentary: Cameco’s October 30 earnings report reinforced the long-term nuclear energy investment narrative while highlighting near-term operating challenges. Management indicated that performance remained aligned with its operating expectations, although production costs and timing affected financial comparisons. CCJ received fresh interest as an AI trade given the accelerating power needs for the AI infrastructure buildout. CCJ also bears the imprint of a topping trade. The stock had a strong run the first few weeks of January to an all-time high and has trended downward ever since. The year-to-date downtrade makes CCJ an unattractive stock to buy at support. Instead, I prefer to wait for a 50DMA, even a 200DMA, breakout. Note the fakeout above the 200DMA in August as a point of caution.
Robinhood Markets Inc. (HOOD)
Description: Robinhood operates a financial services platform offering brokerage, trading, investment, and related products to retail customers.
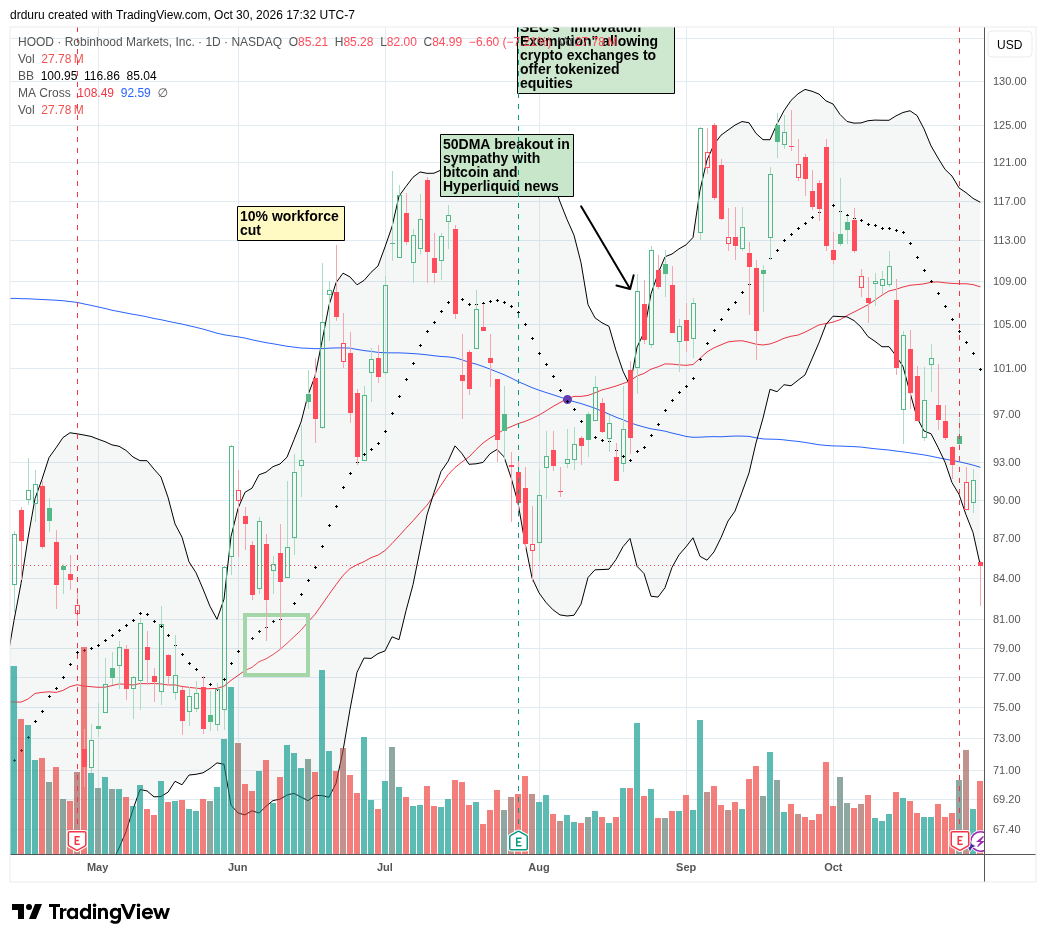
Technical Status: Robinhood Markets Inc. (HOOD) suffered a bearish post-earnings 200DMA breakdown and closed the week at a 4+ month low.
Trade Commentary: Robinhood reported earnings on October 27. Quarterly revenue increased 12% year-over-year to $1.4 billion on October 27. The company also reported $16 billion in net deposits and a record 5.2 million Gold subscribers. However, diluted earnings per share declined 16% year over year, contributing to the motivated post-earnings selling. Friday’s 7.2% loss came in the wake of a costly cryptocurrency hack on Binance. That over-reaction put HOOD on my buy list for the coming week, especially given buying from the intraday low created a hammer bottoming pattern.
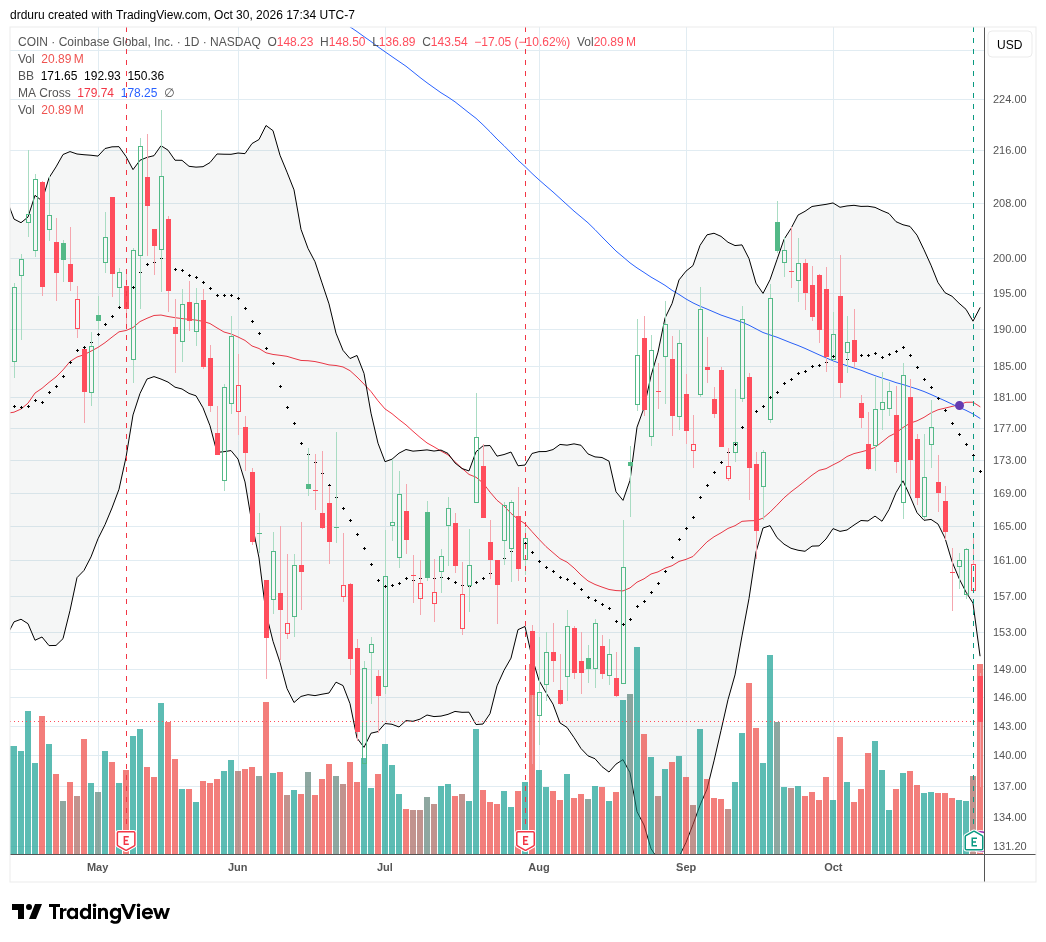
Coinbase Global Inc. (COIN)
Description: Coinbase operates a digital asset financial services platform offering cryptocurrency trading, custody, institutional services, and related financial products.
Technical Status: Coinbase Global Inc. (COIN) lost 10.6% post-earnings and closed at the bottom of this year’s trading range.
Trade Commentary: Coinbase reported earnings on October 29 with Q3 net income of $719 million and adjusted EBITDA of $333 million, up 60% sequentially. However, a substantial portion of reported profit reflected gains on digital asset holdings rather than recurring operating income. Management highlighted gains in crypto trading market share, record paid subscription levels, and expanding prediction-market activity. Nevertheless, the Binance hack helped take COIN down for a post-earnings visit to the bottom of a near year-long trading range. I am not interested in getting cute at support here because I cannot sort out how much of Friday’s loss is just an over-reaction to the Binance hack whereas HOOD already seems to pay a full post-earnings penance.
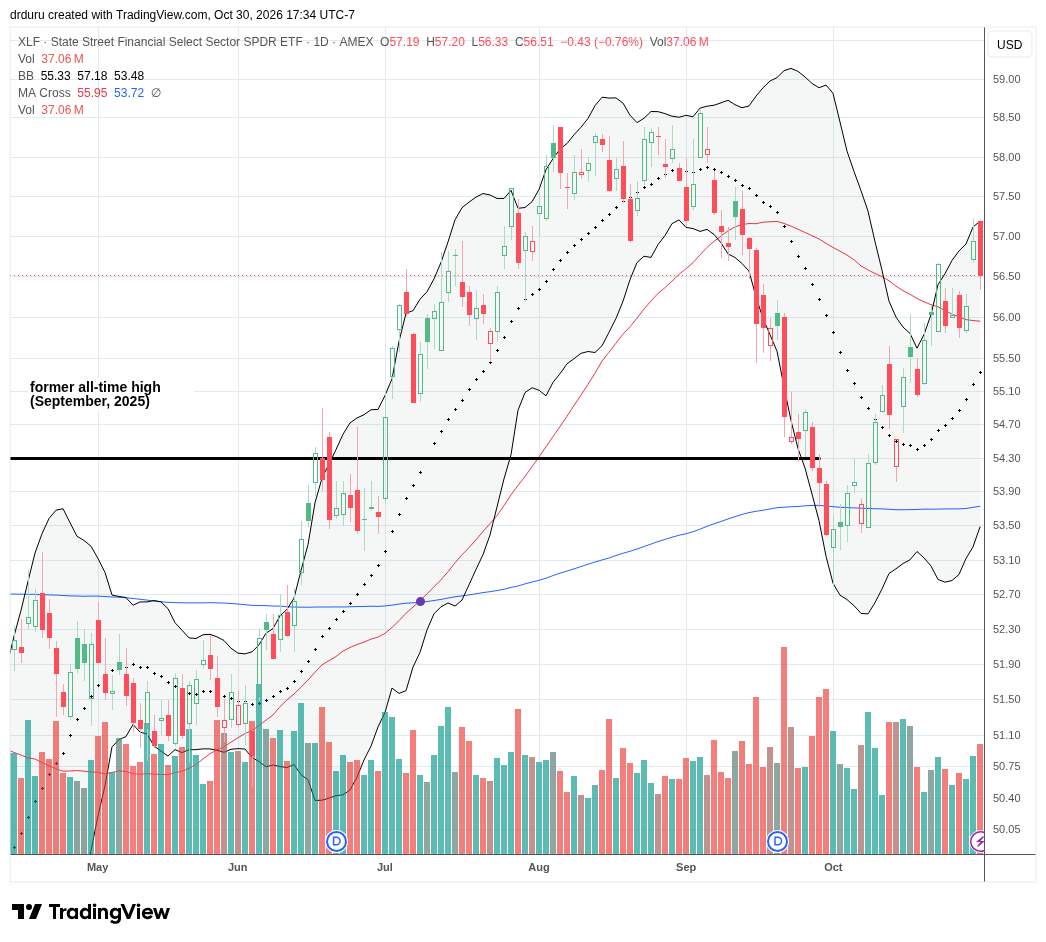
Financial Select Sector SPDR ETF (XLF)
Description: The Financial Select Sector SPDR ETF tracks major U.S. financial companies within the S&P 500, including banks, insurers, capital markets businesses, and financial services firms.
Technical Status: Financial Select Sector SPDR ETF (XLF) finally confirmed its 50DMA breakout but Friday’s 0.8% reversal may have signaled the end of the momentum.
Trade Commentary: XLF added to the rally in market breadth by confirming its 50DMA breakout on Thursday. Friday’s pullback may have ended momentum. Still, given how well XLF’s 50DMA held as support, I am interested in speculating on support holding again.
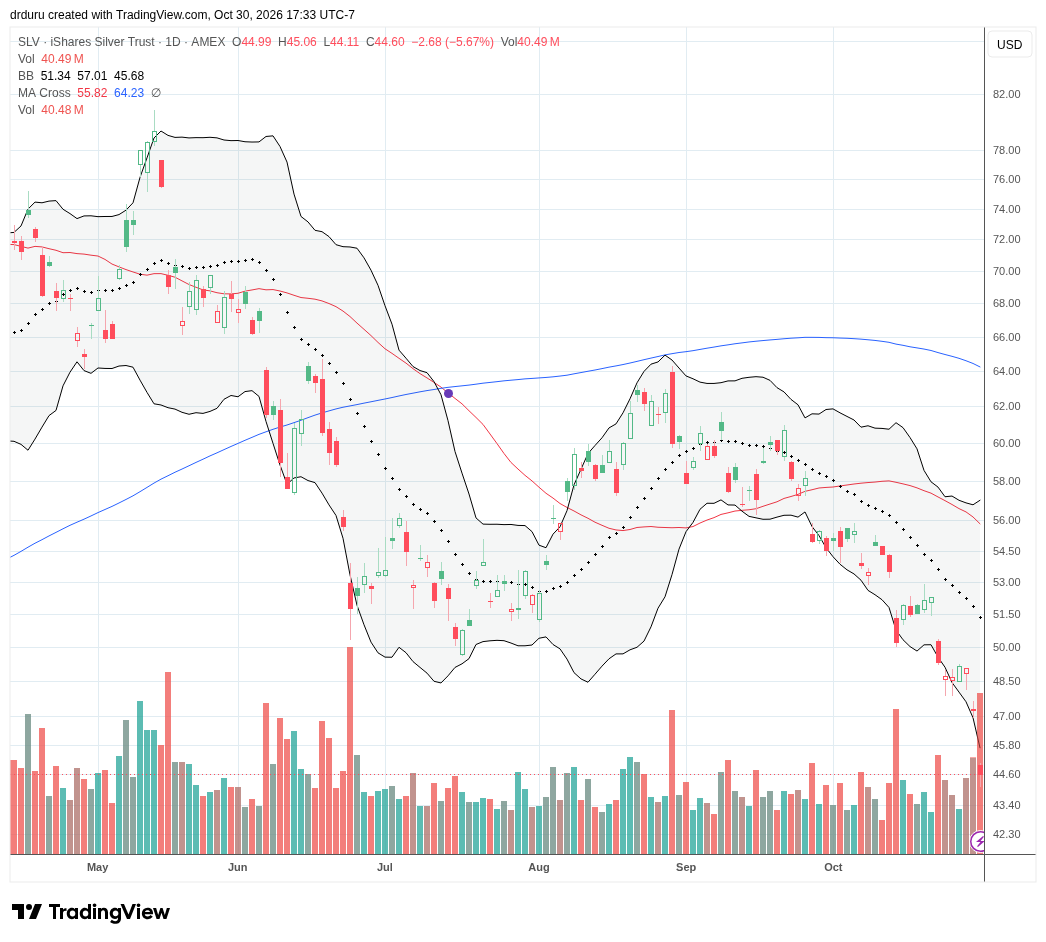
iShares Silver Trust (SLV)
Description: The iShares Silver Trust is a physically backed investment vehicle designed to reflect the performance of silver prices, less trust expenses.
Technical Status: The iShares Silver Trust (SLV) plunged 5.7% to an 11-month low.
Trade Commentary: In late September, I was prepared to buy SLV on a confirmed breakout. That confirmation never arrived and instead SLV’s downtrend immediately resumed. Friday’s plunge accelerated that downtrend. The trading in SLV shows the classic problem with parabolic price action. Since its all-time high at the tail-end of a parabolic January, SLV is down about 58%. SLV even delivered a rare warning about the on-going collapse by plunging 28.5% off the all-time high. SPDR Gold Shares (GLD) has suffered a similar fate.
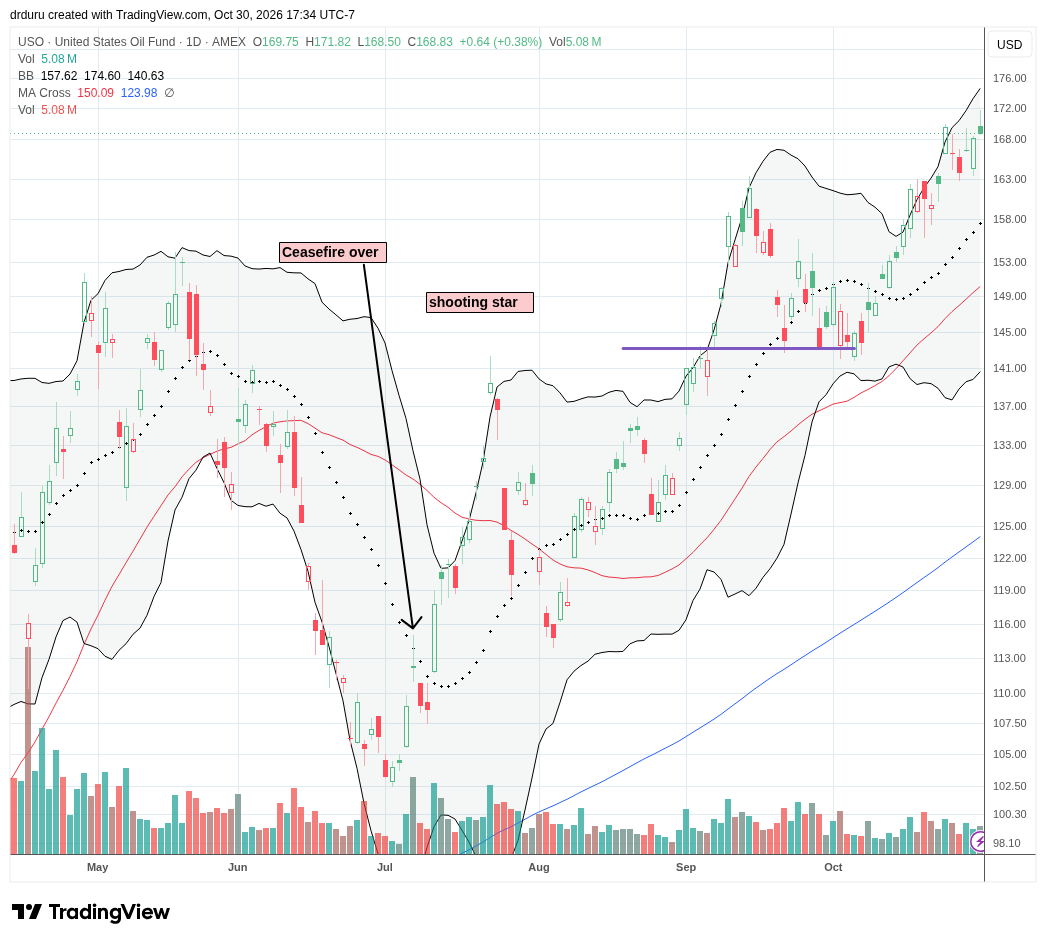
United States Oil Fund (USO)
Description: The United States Oil Fund is a commodity investment fund designed to track daily percentage changes in near-term West Texas Intermediate crude oil futures through holdings of oil-related futures contracts and other investments.
Technical Status: United States Oil Fund (USO) rallied all October to an 11-year high.
Trade Commentary: When I look at October’s persistent rally in oil, I am both surprised that bond yields have gone the opposite way and that the damage in October was mostly contained to high-tech and the AI trade. The market seems to be looking past these ever higher oil prices to a day when oil returns to pre-war levels. I hope to have puts in place for that moment because the next slide in oil prices should be swift. My current November $145/$135 put spread is unlikely to be the position to experience such a slide.
Fair Isaac Corporation (FICO)
Description: Fair Isaac develops credit scoring systems, predictive analytics, and decision management software used by financial institutions and other businesses.
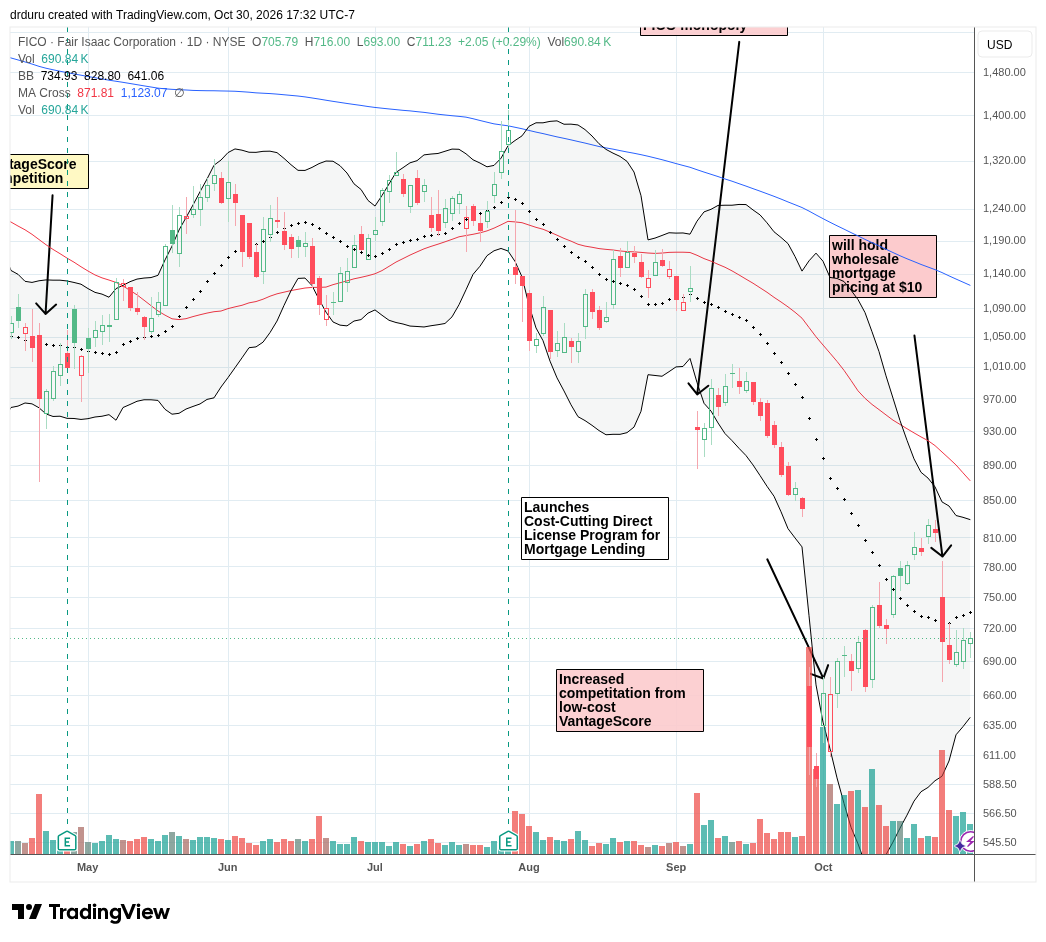
Technical Status: Fair Isaac Corporation (FICO) abruptly ended its recovery momentum with a 13.2% gap down on news of the company’s latest pricing strategy.
Trade Commentary: Just when it seemed FICO could be turning the corner, another negative news headline tanked the stock. The stock lost 13.2% after the company announced its latest pricing strategy. Wells Fargo downgraded the shares on October 26, arguing that the company’s decision to maintain preferred-program pricing limited a potential earnings growth opportunity. The decision to prioritize program adoption over higher pricing introduced questions about future earnings leverage. I am still not interested in speculating on a buy.
DoorDash Inc. (DASH)
Description: DoorDash operates a local commerce platform connecting consumers, merchants, and delivery providers across restaurant, grocery, retail, and related services.
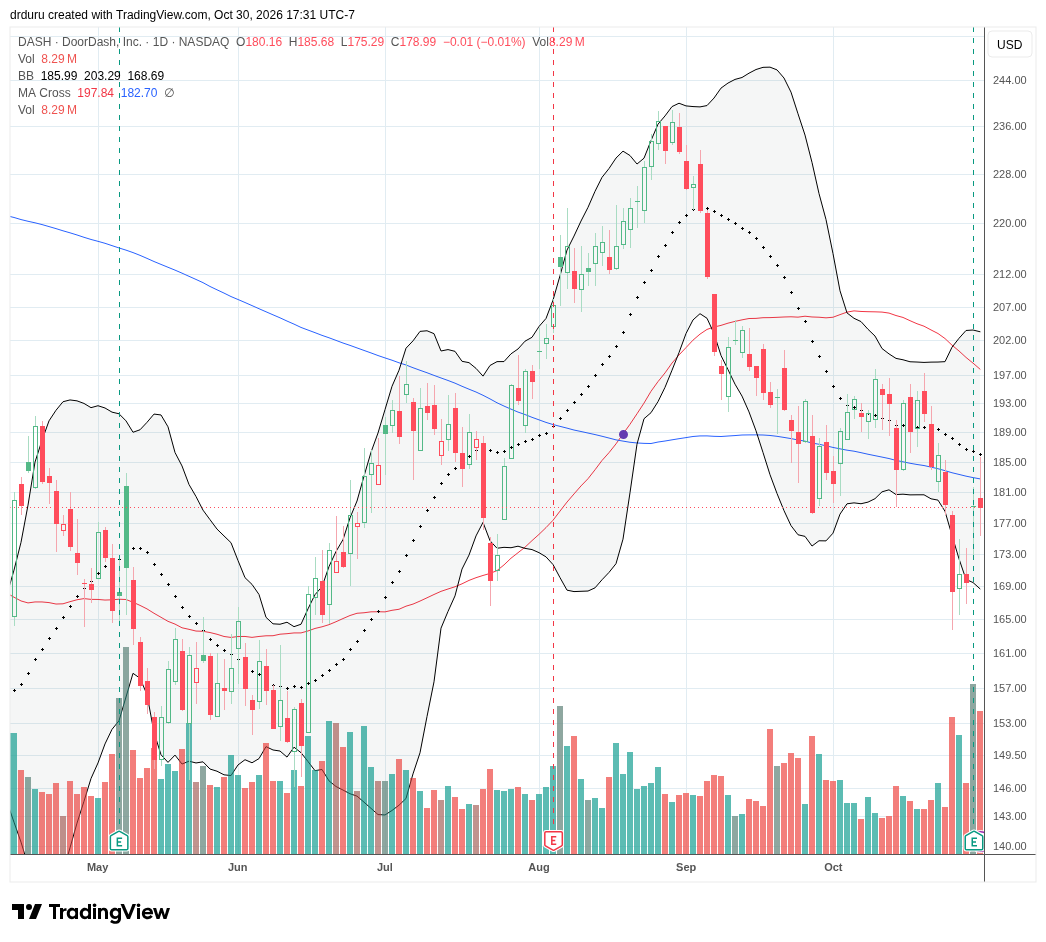
Technical Status: DoorDash Inc (DASH) bounced 5.6% post-earnings but failed at 200DMA resistance.
Trade Commentary: DoorDash reported earnings on October 29 and delivered strong marketplace growth and announced an agreement to acquire Instacart for approximately $17 billion. The combination would significantly expand the company’s grocery and local commerce operations, but it also introduces questions about financing, integration, and the return on additional investment. The resulting rebound almost saved the stock from its recent bearish 200DMA breakdown. Support at the July lows held but the August highs still look like a top. I have a position and am looking for an exit at 50DMA resistance.
Roblox Corporation (RBLX)
Description: Roblox operates an interactive digital platform where users create, share, and participate in immersive games and virtual experiences.
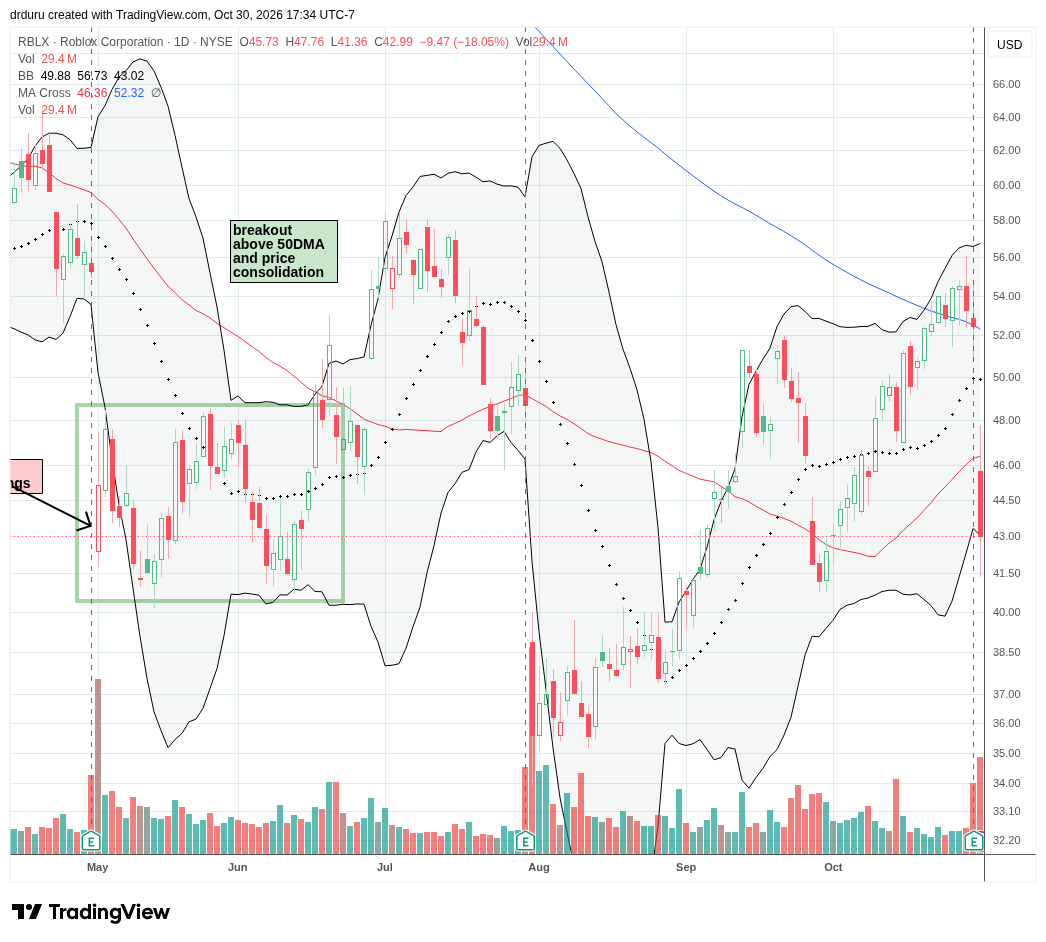
Technical Status: Roblox Corporation (RBLX) fell back to its September breakdown low with an 18.1% post-earnings loss and 50DMA breakdown.
Trade Commentary: I was hopeful about RBLX a month ago. Roblox reported Q3 results on October 29 and apparently created investor concerns about bookings momentum and user engagement. The small positive about RBLX came from the bounce from the intraday low. The stock held support from the late September pullback. I will take a loss if support breaks. If I did not have a position, I would not get cute at support and buy shares.
Coursera Inc. (COUR)
Description: Coursera operates an online education platform offering courses, professional certificates, degree programs, and workforce training through educational and industry partners.
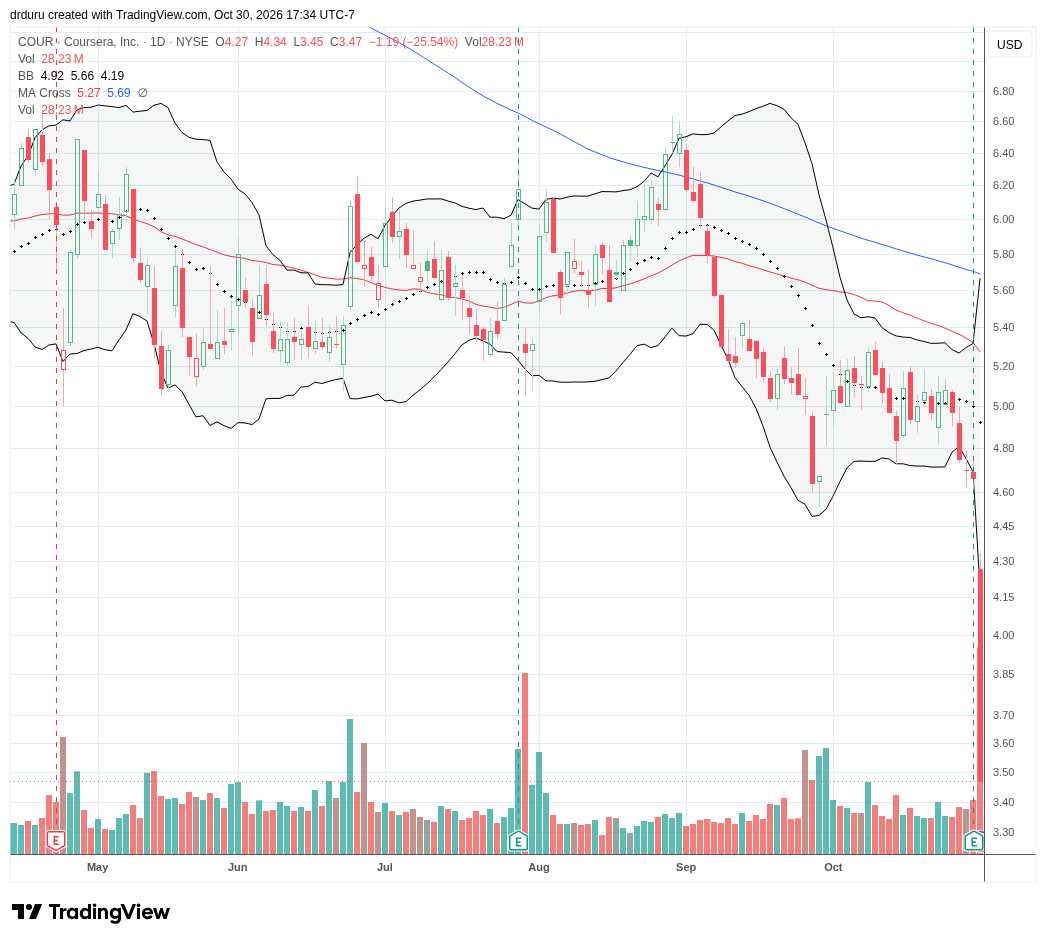
Technical Status: Coursera Inc. (COUR) plunged 25.5% post-earnings to an all-time low.
Trade Commentary: COUR went back on my buy list 6 months ago. Thank goodness the trade never triggered. Coursera reported earnings on October 29 with quarterly revenue of approximately $377 million and narrowed its full-year revenue outlook. Management also highlighted accelerated integration savings and previewed Project Helix, an AI-native skills platform designed to connect learning with verified professional capabilities. However, expectations for “consumer to decelerate further given softer leading funnel indicators” helped to sour investor sentiment and sent the stock crashing to an all-time low. I also took interest in management claiming that “using an AI chatbot actually is harmful for learning.” Thus it seems that COUR is feeling the pressure from AI-driven substitutes for its courses.
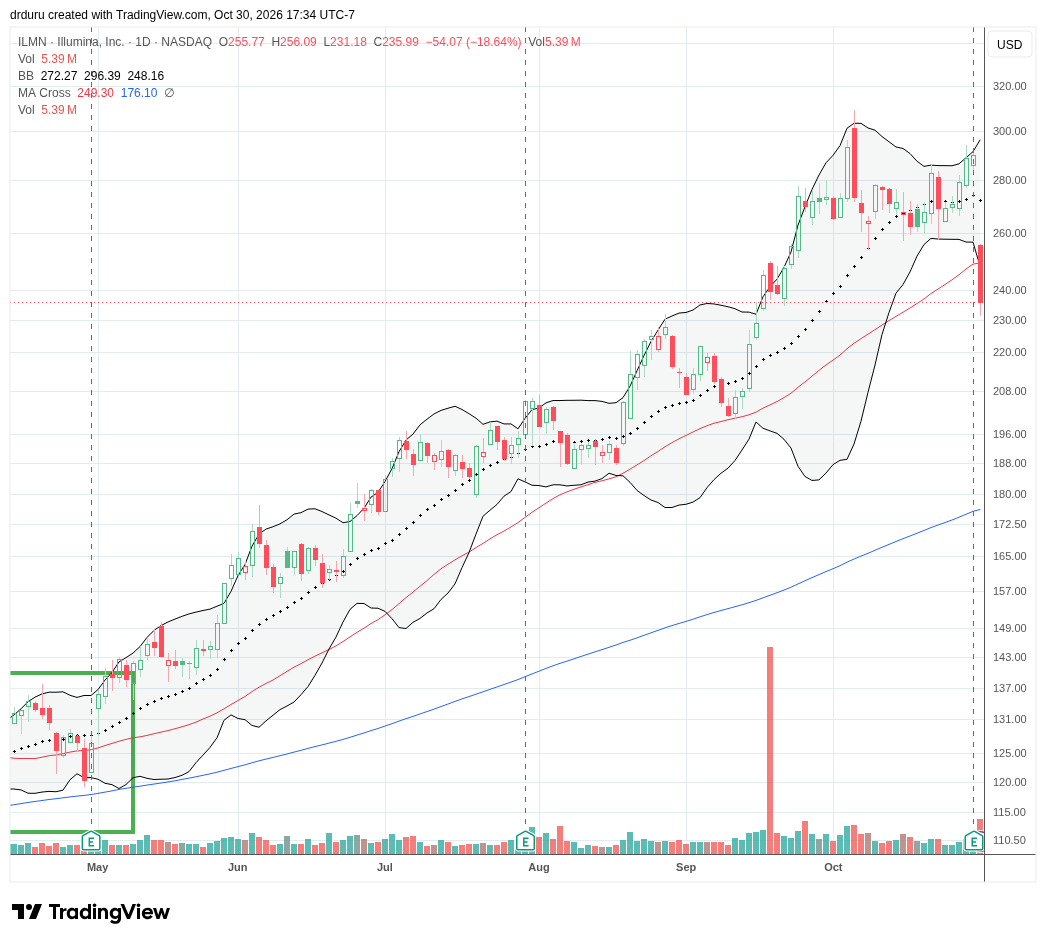
Illumina Inc. (ILMN)
Description: Illumina develops DNA sequencing systems, genomic analysis instruments, consumables, and related technologies for research and clinical applications.
Technical Status: Illumina Inc. (ILMN) suffered a 50DMA breakdown with an 18.6% post-earnings loss.
Trade Commentary: My concerns over ILMN now appear warranted. Illumina’s October 29 earnings report showed that Q3 revenue increased 4.2% to $1.13 billion, supported by clinical demand and strong NovaSeq X placements. Management raised its full-year revenue and earnings outlook. Yet, the stock still plunged 18.6% with a 50DMA breakdown that confirms the recent top in the stock. Analyst questions during the conference call pointed to skepticism about the outlook that could explain the abrupt evacuation from the stock.
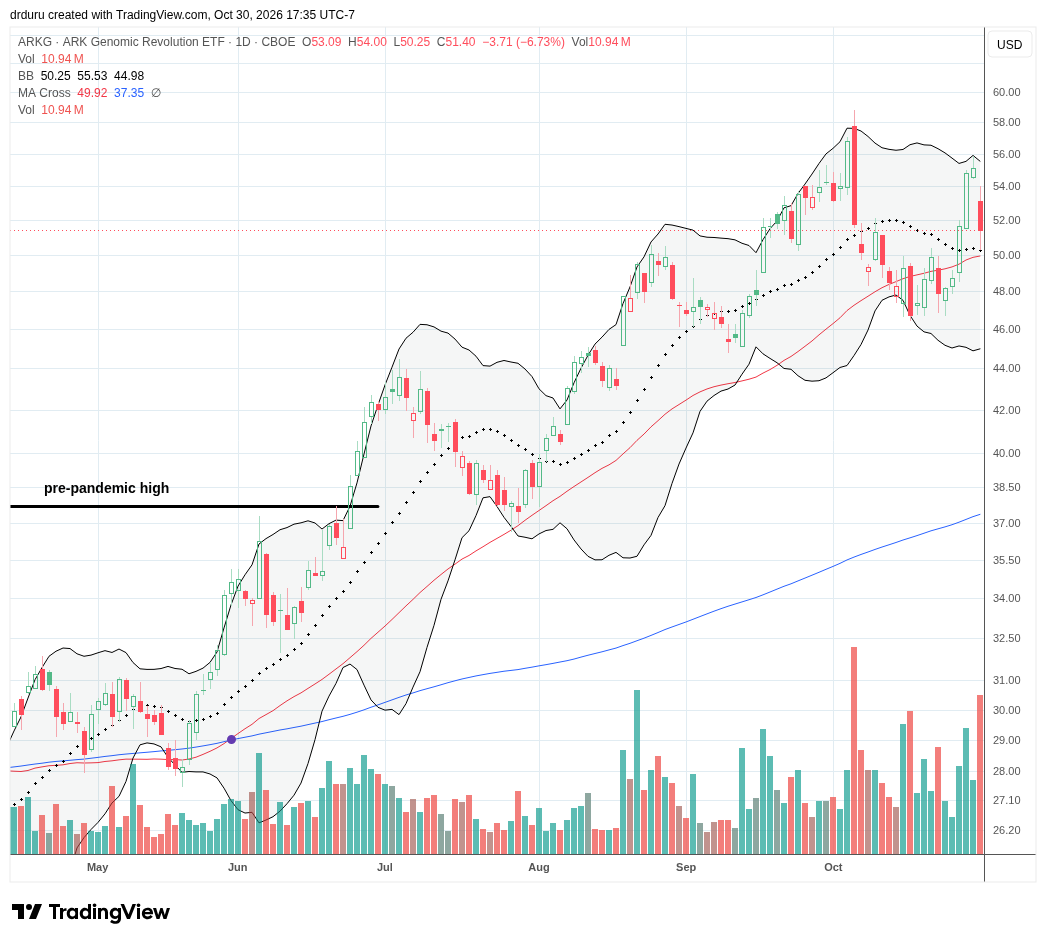
ARK Genomic Revolution ETF (ARKG)
Description: The ARK Genomic Revolution ETF is an actively managed investment fund focused on companies developing or benefiting from advances in genomics, biotechnology, and related healthcare technologies.
Technical Status: The ARK Genomic Revolution ETF (ARKG) bounced off 50DMA support before a 6.7% loss that ended its uptrend momentum.
Trade Commentary: Two weeks ago, ARKG provided a good setup for a short. That point turned out to be the closing low for this cycle. I stubbornly held on to the short given the clear topping pattern from the bearish engulfing on October 6th (that day marked selling across a broad swatch of healthcare-related stocks like ILMN). Notably, ARKG’s surge last week stopped short of the topping pattern at the all-time high. The rebound off the 50DMA keeps the short-term bullish momentum alive.
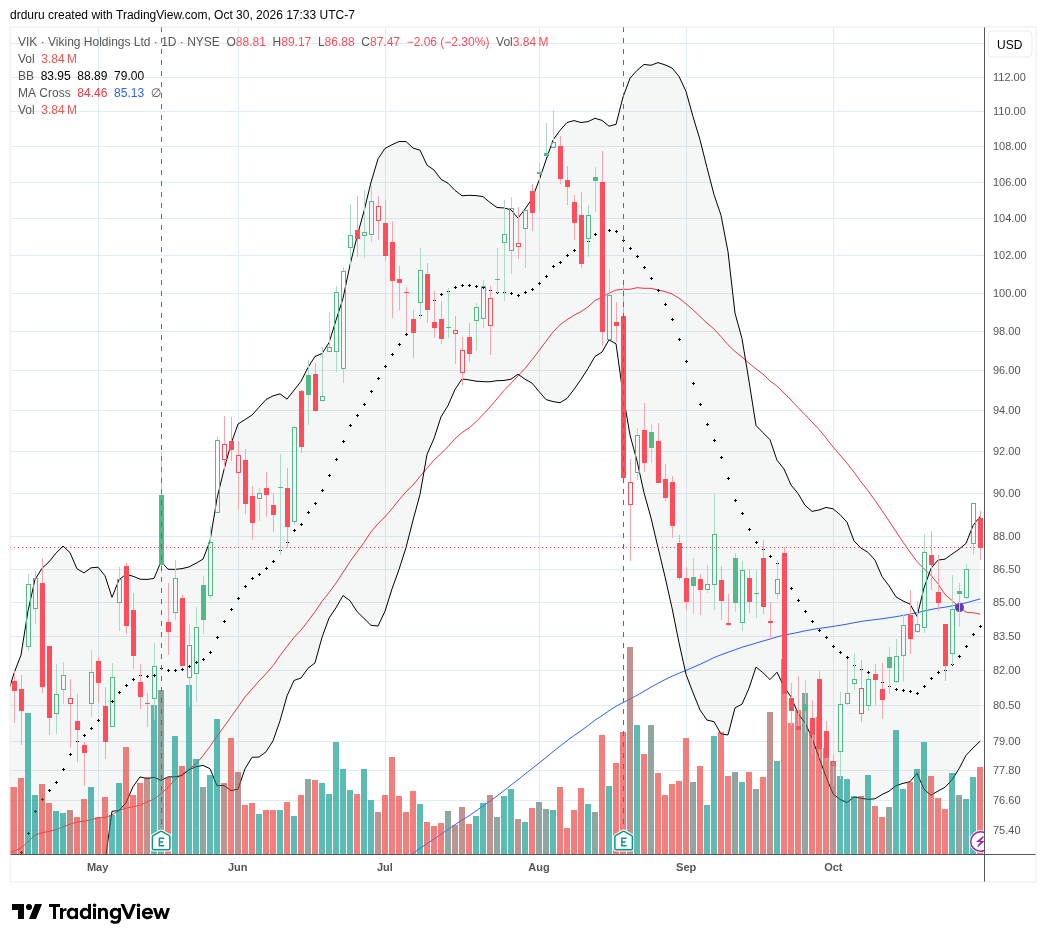
Viking Holdings Ltd. (VIK)
Description: Viking Holdings operates river, ocean, and expedition cruises serving travelers across international destinations.
Technical Status: Viking Holdings Ltd. (VIK) confirmed a breakout above its converged resistance at its 50DMA and 200DMA.
Trade Commentary: If I did not already have a trade in place on VIK, I would buy the confirmed breakout here with Friday’s 2.3% pullback providing a good risk/reward entry. VIK is one of many consumer-facing, oil-dependent stocks that performed surprisingly well in the face of oil’s rally. I expect VIK to accelerate higher once the market concludes oil has finally topped out. On October 28, Viking Holdings announced delivery of the Viking Haki, a new river vessel designed to serve European itineraries.
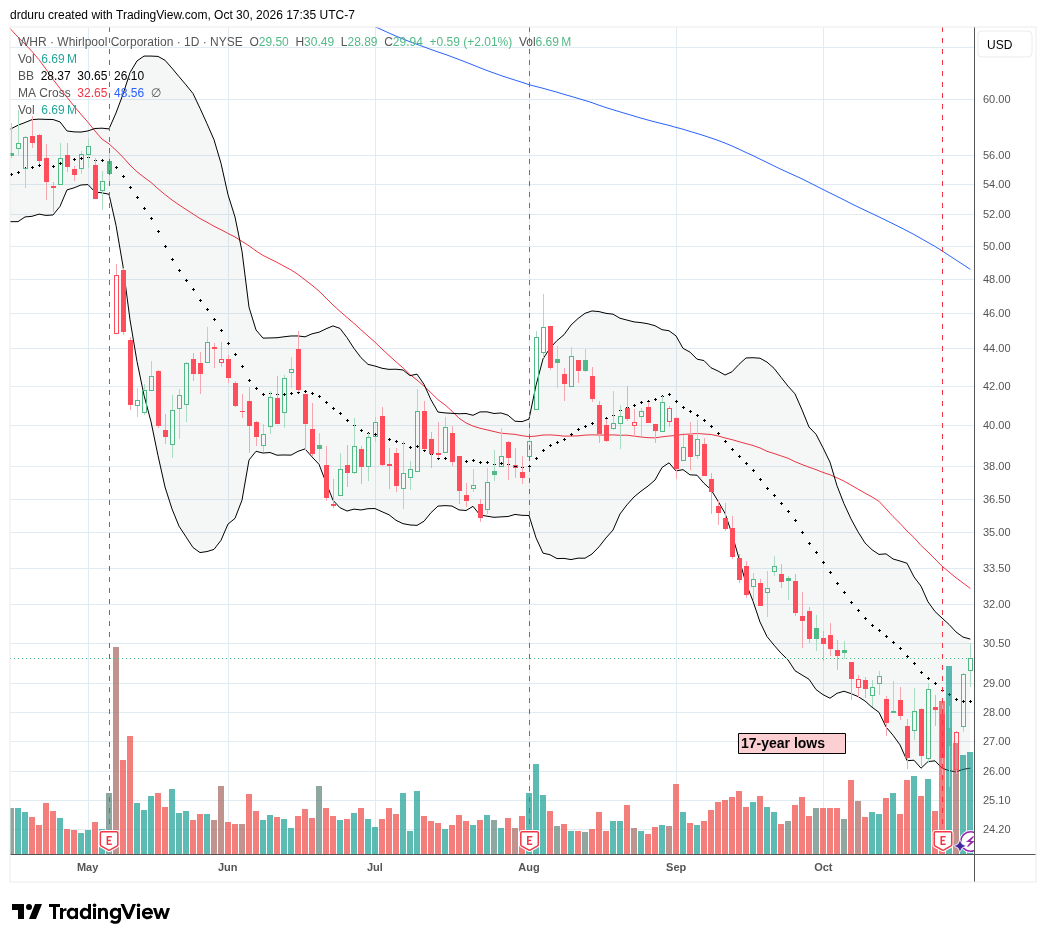
Whirlpool Corporation (WHR)
Description: Whirlpool manufactures and markets household appliances, including refrigerators, washing machines, dryers, cooking equipment, and related products.
Technical Status: Whirlpool Corporation (WHR) showed some life after readily reversing a 5.9% post-earnings loss.
Trade Commentary: Whirlpool opened the trade week with a poorly received October 26 earnings report. Q3 sales declined approximately 9% to $3.68 billion, while the company reported a GAAP loss of $3.80 per share. Management emphasized cost reductions and pricing actions, but acknowledged that the pace of demand recovery remained slower than expected. Buyers stepped in the day after the post-earnings pullback and have barely looked back. With the early signs of a bearish to bullish reversal underway, I bought shares on Friday to play for a 50DMA breakout. My stop loss is below the recent 17-year low.
Footnotes
Subscribe for free to get email notifications of future posts!
“Above the 50” (AT50) uses the percentage of stocks trading above their respective 50-day moving averages (DMAs) to measure breadth in the stock market. Breadth defines the distribution of participation in a rally or sell-off. As a result, AT50 identifies extremes in market sentiment that are likely to reverse. Above the 50 is my alternative name for “MMFI” which is a symbol TradingView.com and other chart vendors use for this breadth indicator. Learn more about AT50 on my Market Breadth Resource Page. AT200, or MMTH, measures the percentage of stocks trading above their respective 200DMAs.
Active AT50 (MMFI) periods: Day #321 over 20%, Day #9 over 30%, Day #3 over 40% (overperiod), Day #38 under 50% (underperiod), Day #54 under 60%, Day #294 under 70%
Source for charts unless otherwise noted: TradingView.com
Full disclosure: long SPY, long GOOG, long EWZ, short ARKG, long ATI, long AIS, long NOW, long QCOM, long RBLX, long USO put spread, long DASH, long VIK, long WHR
FOLLOW Dr. Duru’s commentary on financial markets via StockTwits, BlueSky, and even Instagram!
*Charting notes: Stock prices are not adjusted for dividends. Candlestick charts use hollow bodies: open candles indicate a close higher than the open, filled candles indicate an open higher than the close.
* Blog notes: I use ChatGPT to help with editing and news discovery.