

The Market Breadth Summary: Gold Shined
- Gold shined as money rotated away from technology and retail, while energy, healthcare, crypto, and precious metals gained ground.
- The S&P 500, NASDAQ, and Russell 2000 finished the week testing 20DMA support after market breadth cooled.
- AT50 lost its brief breakout and returned to its months-long trading range, while AT200 held more of its longer-term bullish structure.
- Earnings from NVDA and the Jackson Hole confab will dominate the stage this coming week.
The Stock Market Summary
Gold shined as money rotated away from tech and retail, market breadth cooled, and energy, healthcare, crypto, and precious metals took the spotlight.
The U.S. Treasury’s intervention in the government bond market helped weakened the U.S. dollar and ignited gold. The specter of the government trying to lean against financial markets to manipulate bond yields lower even as government debt soars, inflation remains too high, and the substantial spending for AI infrastructure increasingly taps debt markets provides a fertile backdrop for gold as a store of value. Cryptocurrencies also took the cue and took off with Bitcoin (BTC/USD) hitting levels last seen in May.
Tech cooled off just as Citadel finished offloading the AI-related positions it bought at a discount from Situational Awareness, the AI-focused hedge fund whose excessive leverage caused an AI crash last month. Retail cooled as major retail earnings delivered sharply divergent reactions from the stock market. The accompanying rally in healthcare and energy stocks was insufficient to maintain market breadth’s breakout.
The market rotations left all three major indices in my universe resting and testing support at their 20-day moving averages (DMAs) ahead of key earnings from NVIDIA (NVDA) and this year’s Jackson Hole confab. While this meeting of central bank governors and officials often features major policy directives, Fed Chair Kevin Warsh set expectations for a bland and low-information speech. Any deviation could spark big market moves just as it seems the market will survive the first of the three most dangerous months of the year without a major pullback.
S&P 500 (SPY)
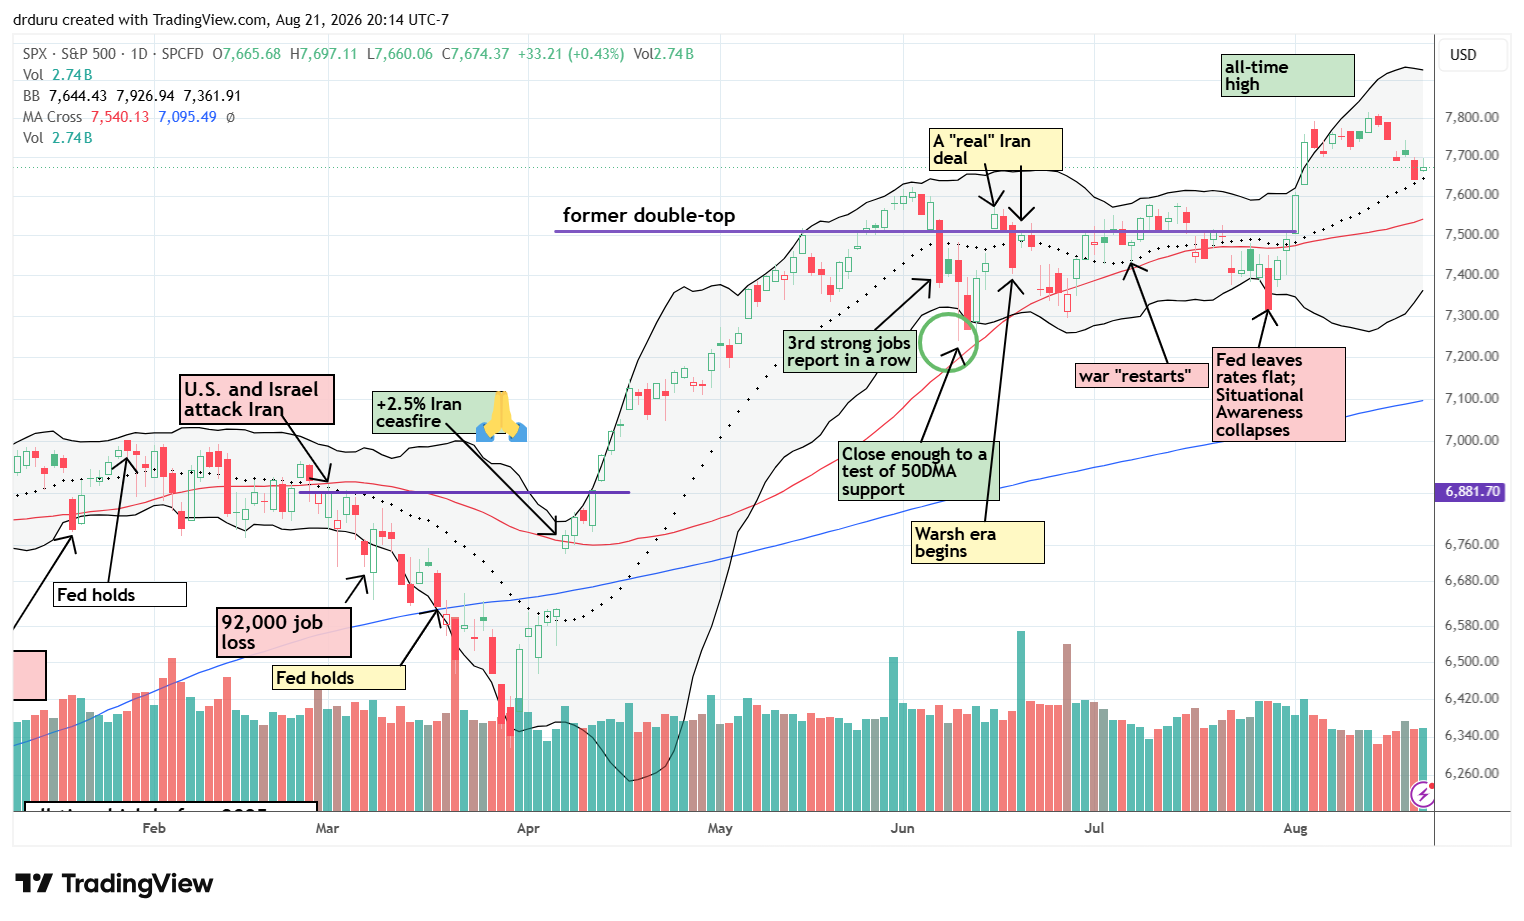
The S&P 500 (SPY) lost 1.4% for the week but found support at its uptrending 20-day moving average (DMA) (dashed line). The drift downward was so gradual I did not even realize the index lost ground for the week until after Friday’s close. A close above 7,700 would put the index right back on track to continue its rally from the breakout that began this month.
NASDAQ (COMPQ)
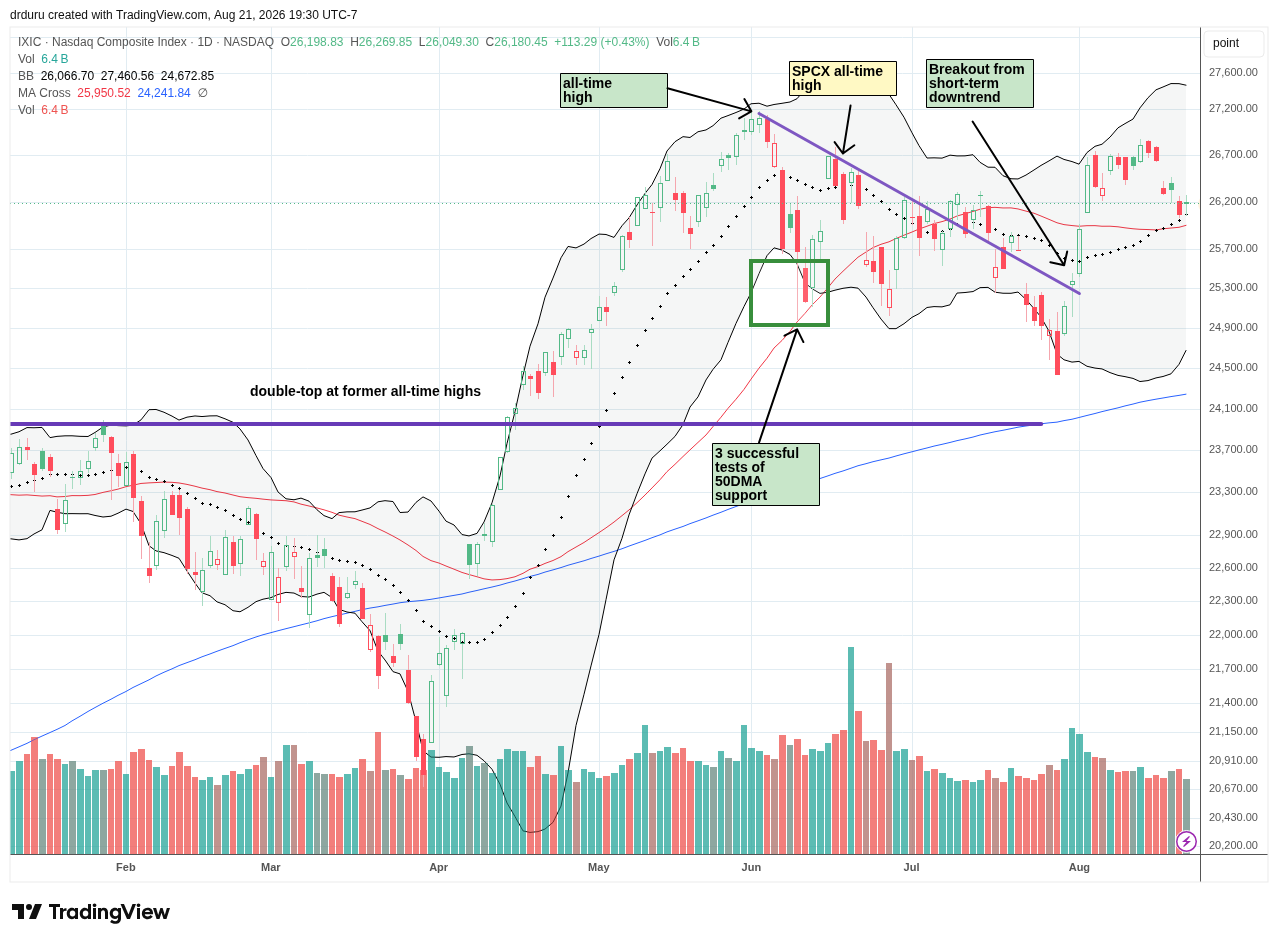
The NASDAQ (COMPQ) also gently tapped its 20DMA support. With 50DMA support close by (the red line), the tech-laden index looks ready for a strong rebound after losing 2.1% from the latest rotation out of tech. However, given the NASDAQ failed to surpass the last high (an all-time high), the index looks toppy. The completion of Citadel’s sales of its bargain-bought assets provides a symbolic ceiling as well.
iShares Russell 2000 ETF (IWM)
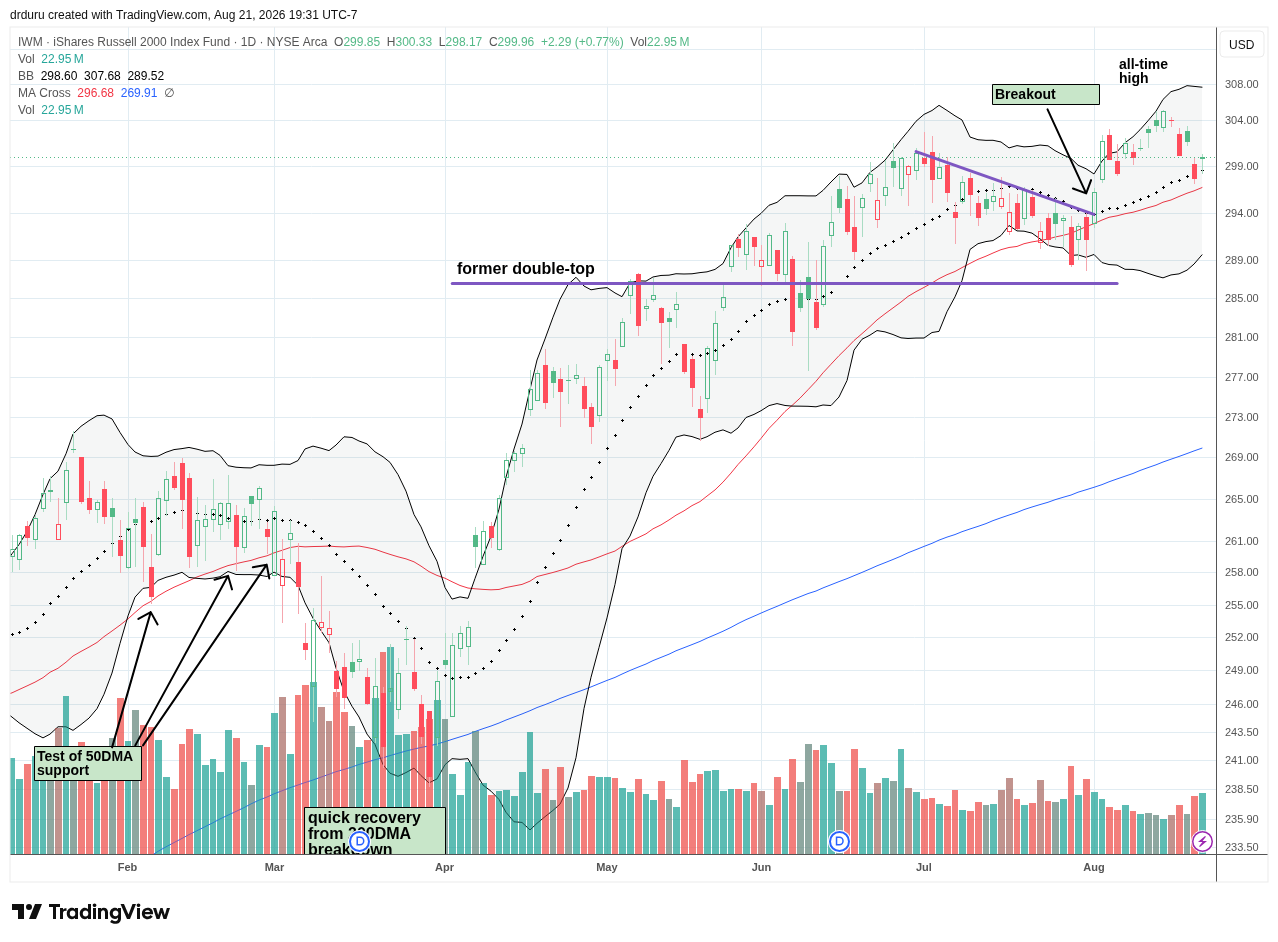
In a display of synchronized technicals, the iShares Russell 2000 ETF (IWM) also tested and bounced off 20DMA support. The ETF of small caps has the best setup for a bounce given the proximity of a 50DMA in a strong uptrend. My weekly call option trade failed last week, but I reloaded on Friday.
The Short-Term Trading Call As Gold Shined
- AT50 (MMFI) = 56.2% of stocks are trading above their respective 50-day moving averages
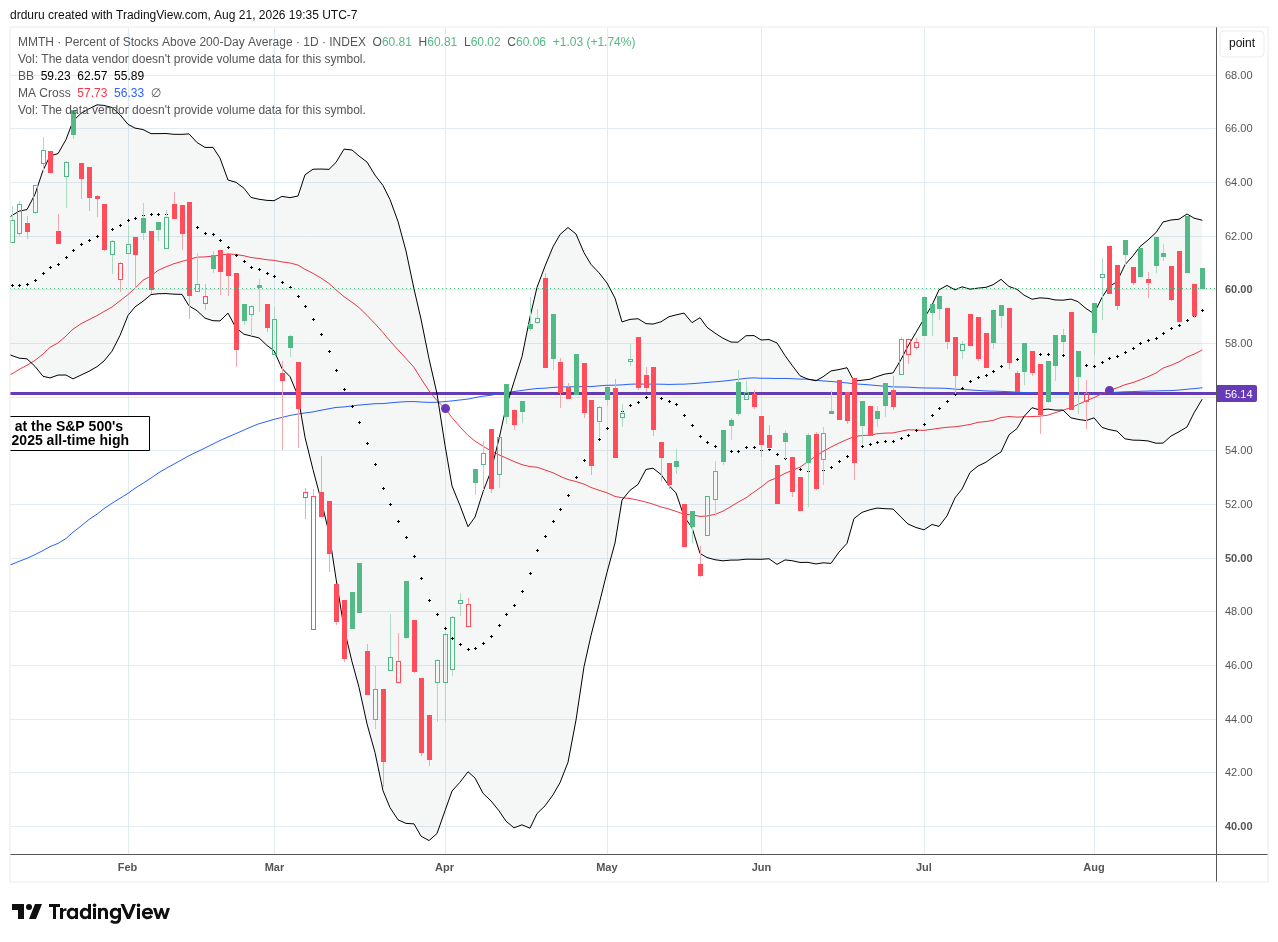
- AT200 (MMTH) = 60.1% of stocks are trading above their respective 200-day moving averages
- Short-term Trading Call: cautiously bullish
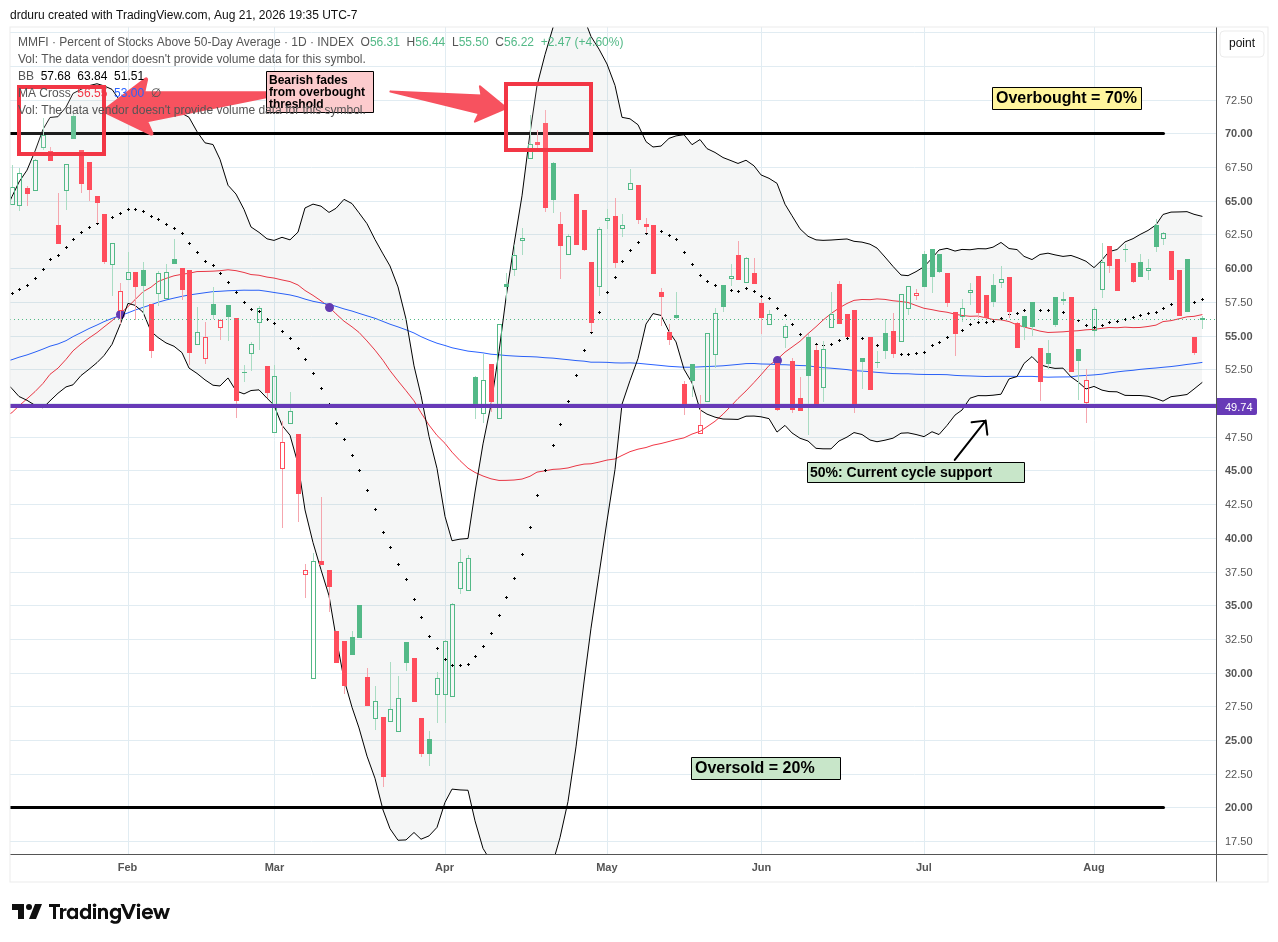
AT50 (MMFI), the percentage of stocks trading above their respective 50DMAs, closed the week at 56.2.
My favorite technical indicator achieved a clean breakout that lasted just two trading days. Like the major indices, market breadth cooled for the week. AT50 is right back to its months-long trading range and looks set to continue to churn as the market continues to rotate from one sector to the next.
AT200, the percentage of stocks trading above their respective 200DMAs, is clinging to its breakout after two trading days falling back into the former trading range. This longer-term indicator of the health of market breadth is even still in an uptrend from the May low. Thus, AT200 is the clearest signal supporting my cautiously bullish short-term trading call.
In case you missed it…
Last week I raised the insider buy alert on Kura Oncology (KURA). Thursday’s 6.5% pullback gives me a chance this week at chasing this buy signal at a better price. I also flagged gold as a buy as soon as I noted its response to the intervention in the bond market.
The Equities
SPDR Gold Shares (GLD)
Description: SPDR Gold Shares provides exposure to the price of physical gold bullion.
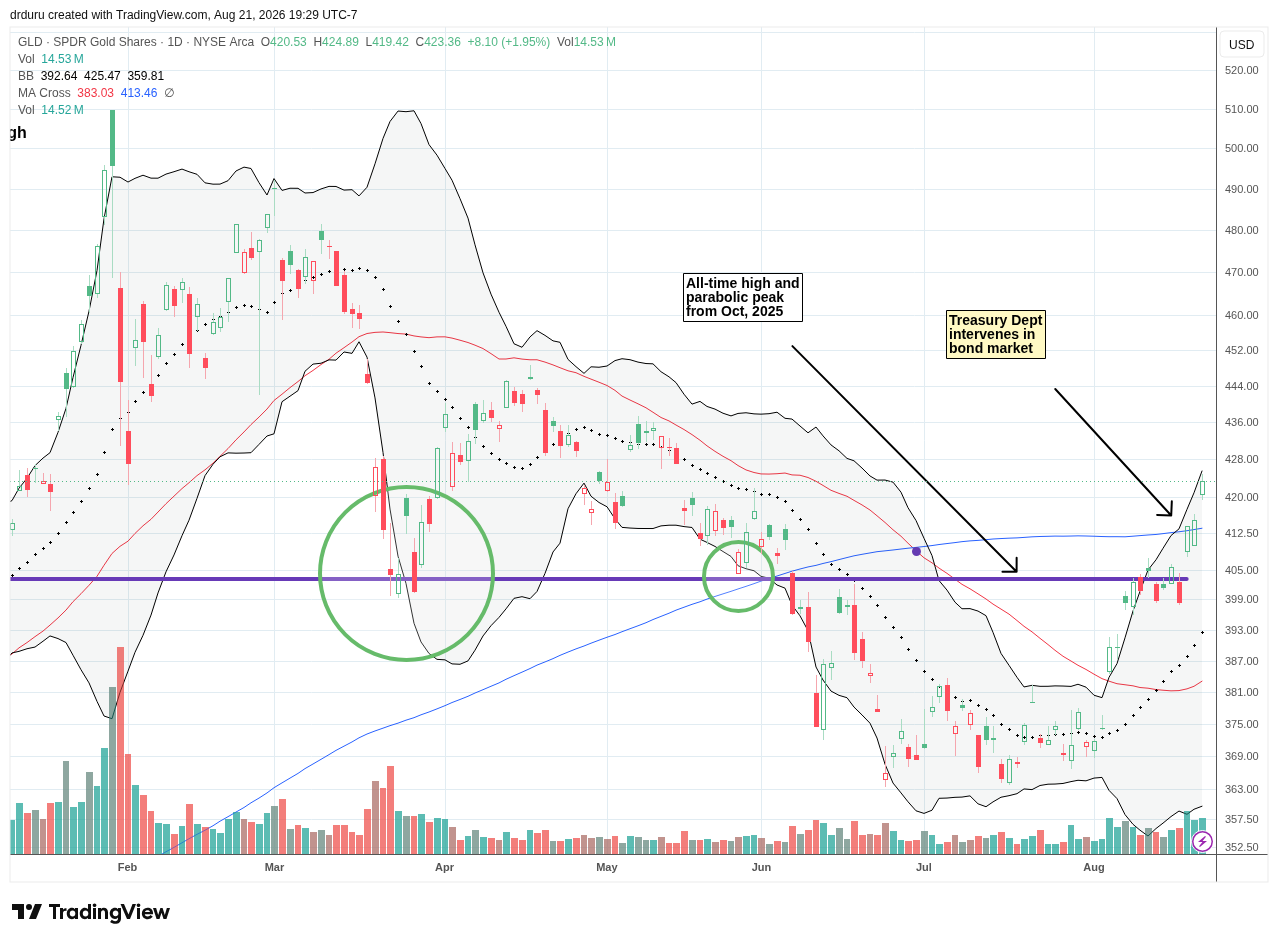
Technical Status: SPDR Gold Shares (GLD) shined with a breakout above its former October 2025 all-time high, followed by a 200DMA breakout after the Treasury Department intervened in the bond market.
Trade Commentary: Gold was one of the clearest beneficiaries of last week’s rotation as investors moved away from technology and other rate-sensitive equities. Spot gold rallied more than 5% for the week and reached a three-month high Friday as the dollar weakened following the Treasury’s expanded long-term bond buyback plans. I see a tension building as governments battle rising interest rates around the globe. In the U.S., the tension pits the Treasury’s efforts to engineer lower rates through symbolic interventions against a Federal Reserve Chair who crowned financial markets as the ultimate arbiter of interest rates.
In the meantime, I will aggressively buy gold-related trades. I should have added to my gold trade on Friday’s gap higher, so I am already behind.
iShares Silver Trust (SLV)
Description: iShares Silver Trust provides exposure to movements in the price of physical silver.
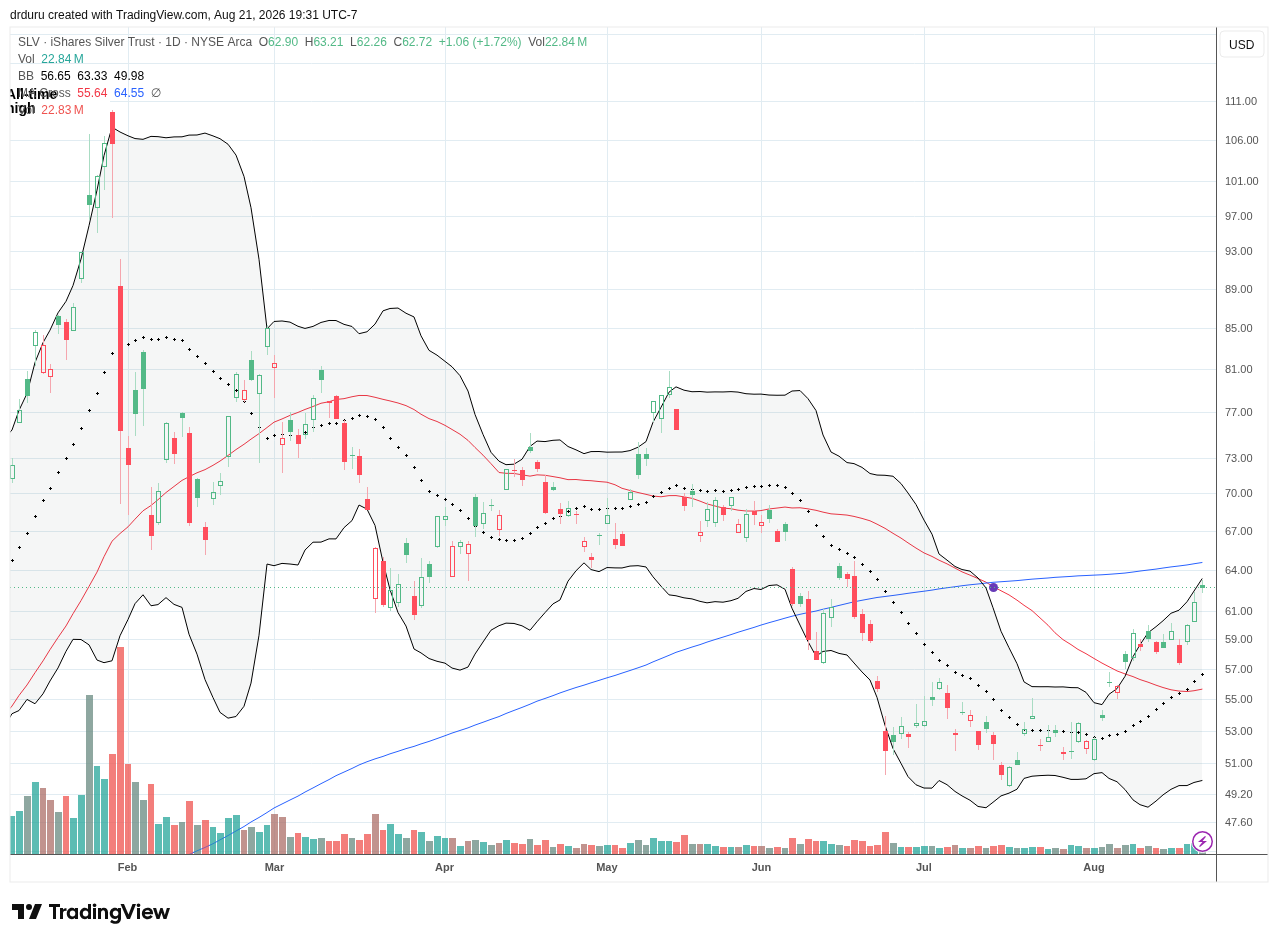
Technical Status: The iShares Silver Trust (SLV) broke out above its 50DMA, looking to test upper Bollinger Band resistance before reaching its 200DMA.
Trade Commentary: I thought I would go into the coming week with SLV call options in hand. I bought a weekly calendar call spread at the $66 strike on Thursday. Somehow, Friday’s push higher was enough to nudge my position into its initial profit point. I am assuming that implied volatility jumped. If so, the coming week could be explosive for precious metals with only the Federal Reserve’s confab at Jackson Hole looming as a potential wildcard.
Micron Technology (MU)
Description: Micron Technology develops memory and storage semiconductor products used across data centers, computing, mobile devices, and other electronics.
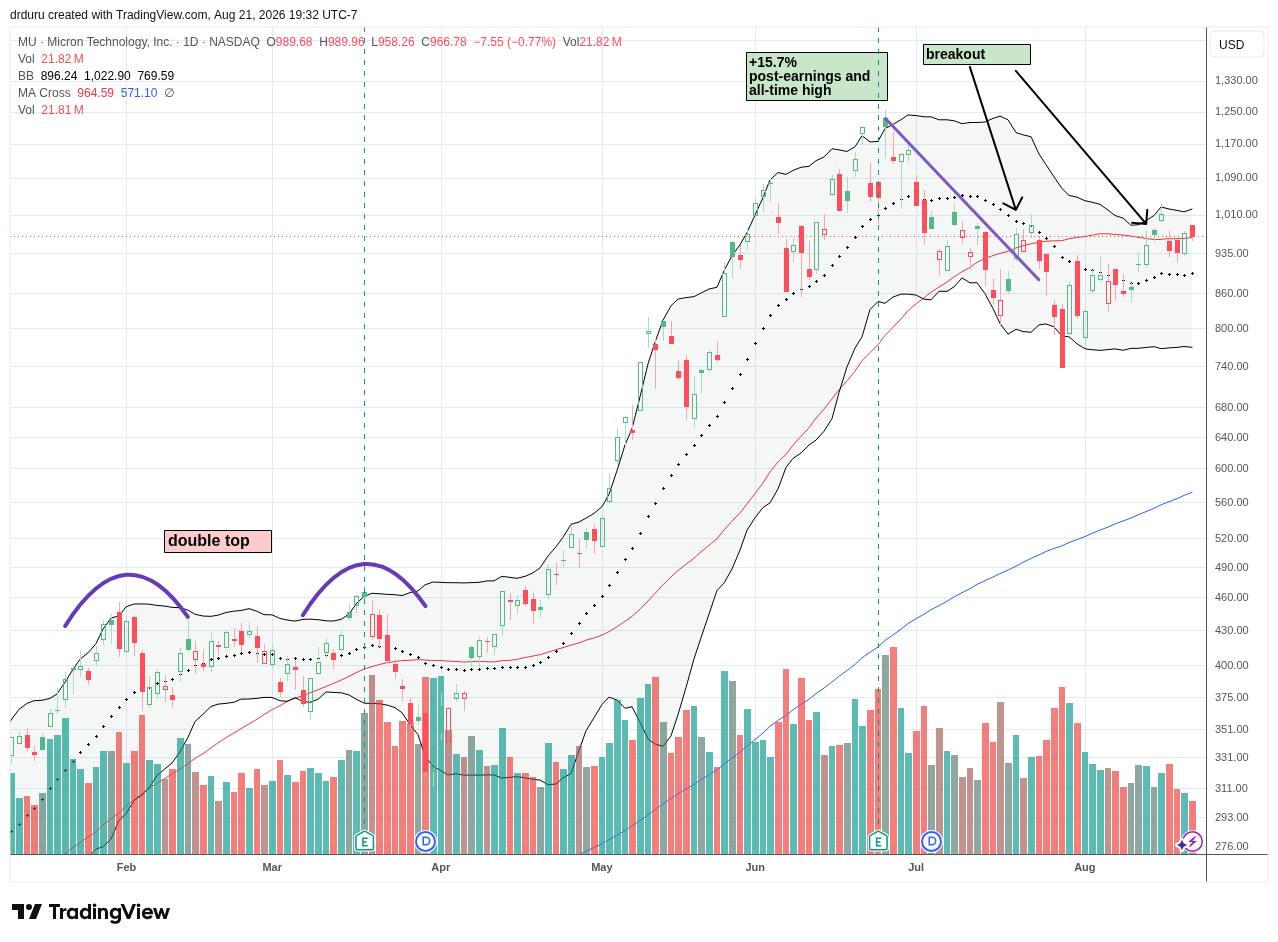
Technical Status: Micron Technology (MU) broke out above its 50DMA as part of a 7-day pivot around the important moving average.
Trade Commentary: The week started well for the tech/AI trade as MU gained 4.1% and confirmed a 50DMA breakout. I speculated on a call spread that promptly failed after MU fell 7.0% and closed below its 50DMA. After Thursday’s close above the 50DMA, I went for a pairs trade going long a weekly MU $1030/$1050 call spread and long a September SMH $520/$500 put spread. I plan to continue to trade against the SMH put spread.
Marvell Technology (MRVL)
Description: Marvell Technology develops data-infrastructure semiconductors for cloud computing, networking, storage, carrier, and custom artificial-intelligence applications.
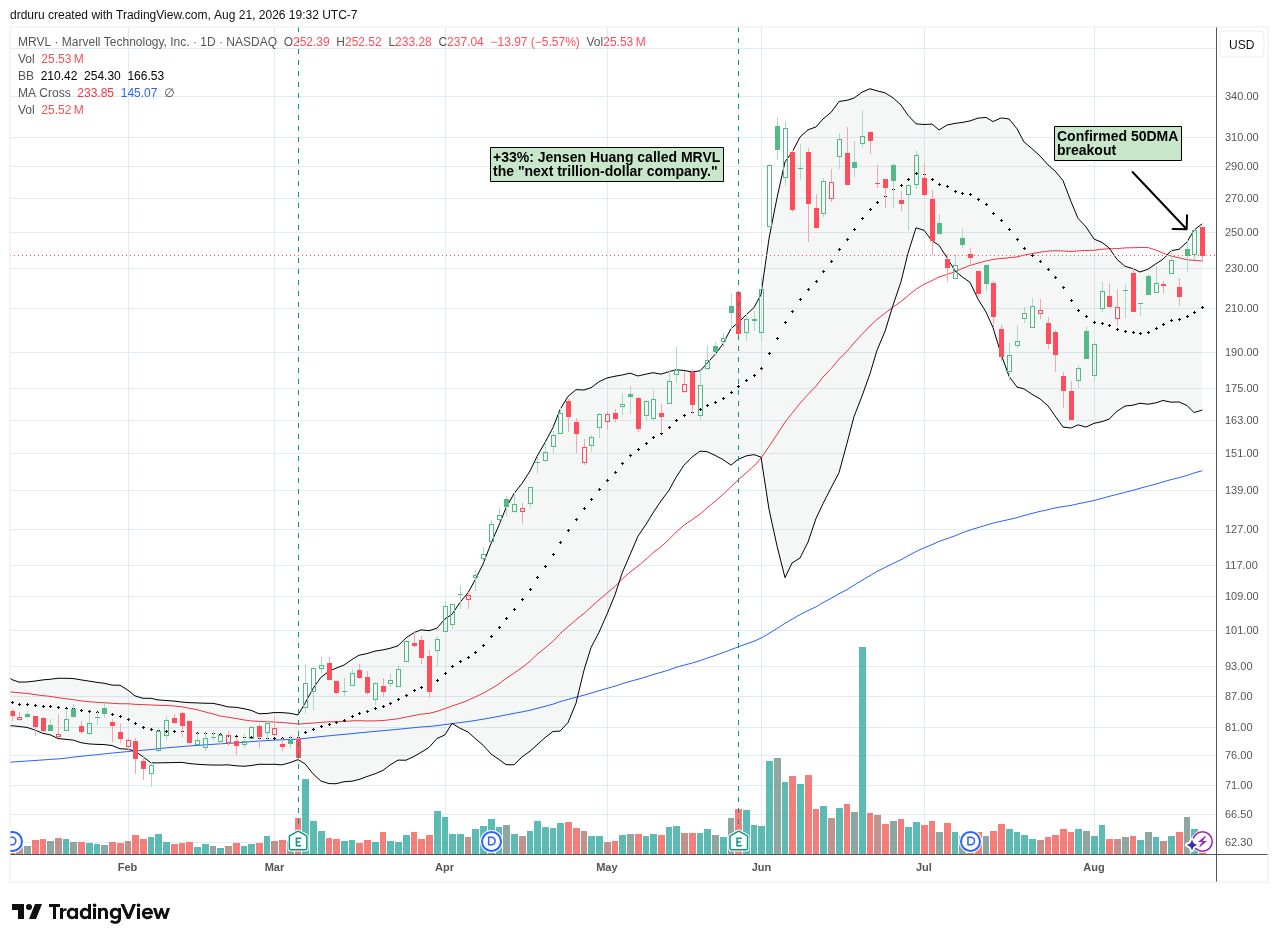
Technical Status: Marvell Technology (MRVL) confirmed a 50DMA breakout but slid back to support after a 5.6% decline.
Trade Commentary: MRVL gained 9.9% on Wednesday after announcing a chip deal with Alphabet (GOOG) and issuing warrants to the hyperscaler. Marvell expanded its custom AI-chip relationship with Google and granted Google warrants that could ultimately represent roughly $12.2 billion of Marvell stock if associated milestones are reached. Thursday’s follow-through was promptly reversed the next day. MRVL has an earnings report coming this week…
Walmart (WMT)
Description: Walmart is a global omnichannel retailer operating Walmart stores, Sam’s Club locations, e-commerce platforms, advertising, and related services.
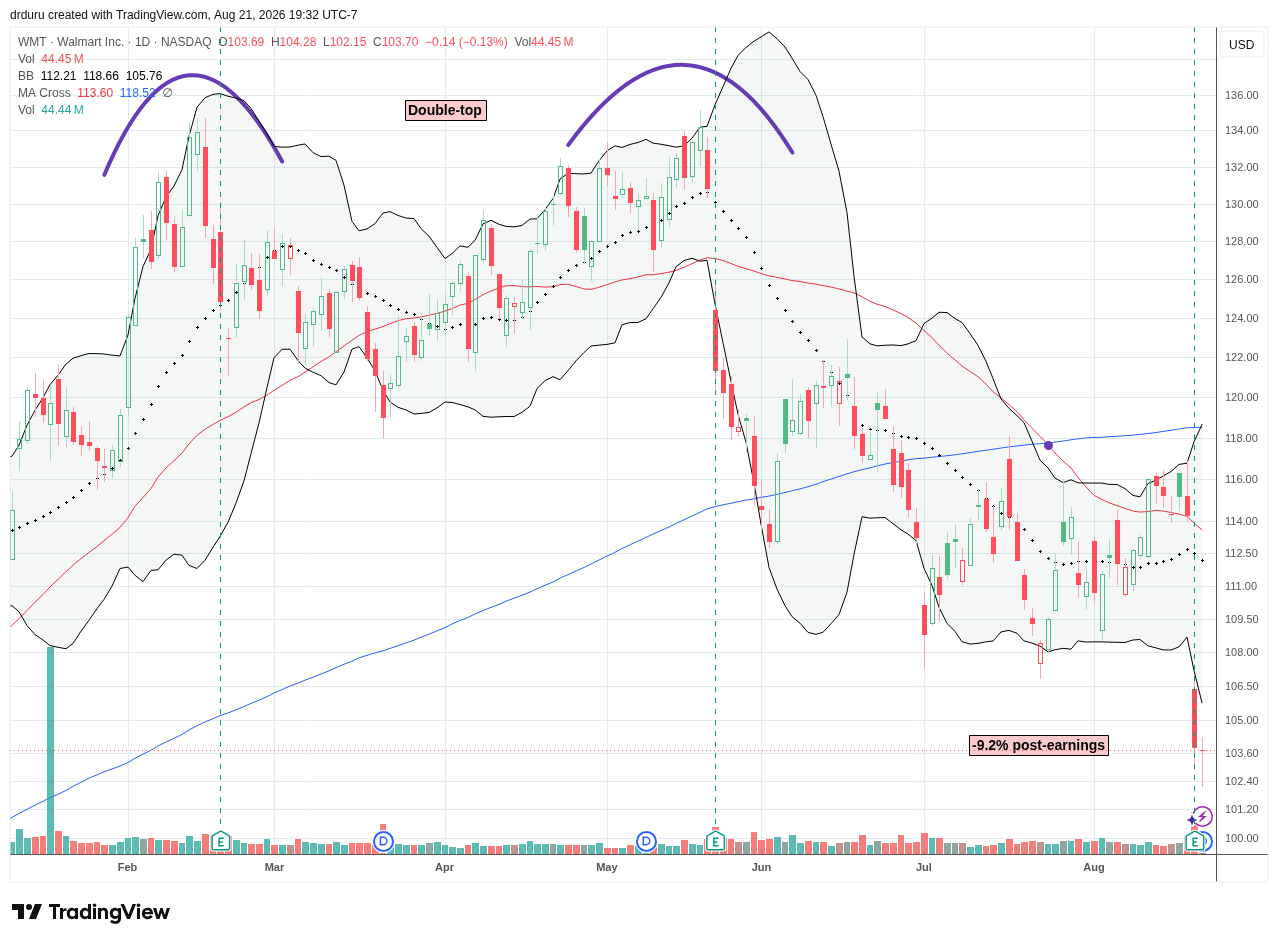
Technical Status: Walmart (WMT) crashed down below its 50DMA after a 9.2% post-earnings drop, setting a new low for the year.
Trade Commentary: Walmart became the week’s most important retail warning after U.S. comparable sales excluding fuel grew 2.6%, the company’s slowest pace in six years and below expectations. WMT imploded 9.2% despite increased EPS guidance for 2027. WMT’s extremely high valuation finally caught up to the stock as the post-earnings collapse further confirms bearish positioning at a 9-month low. The chart below also shows a distinct double-top, a ceiling I only noticed with the post-earnings calamity. Still, I am holding shares given my expectation that at some point in the foreseeable future the market will rationalize piling back in. Wall Street remains very bullish on WMT with a $128 average price target.
The TJX Companies (TJX)
Description: The TJX Companies operates off-price retail chains including TJ Maxx, Marshalls, HomeGoods, Sierra, Winners, and TK Maxx.
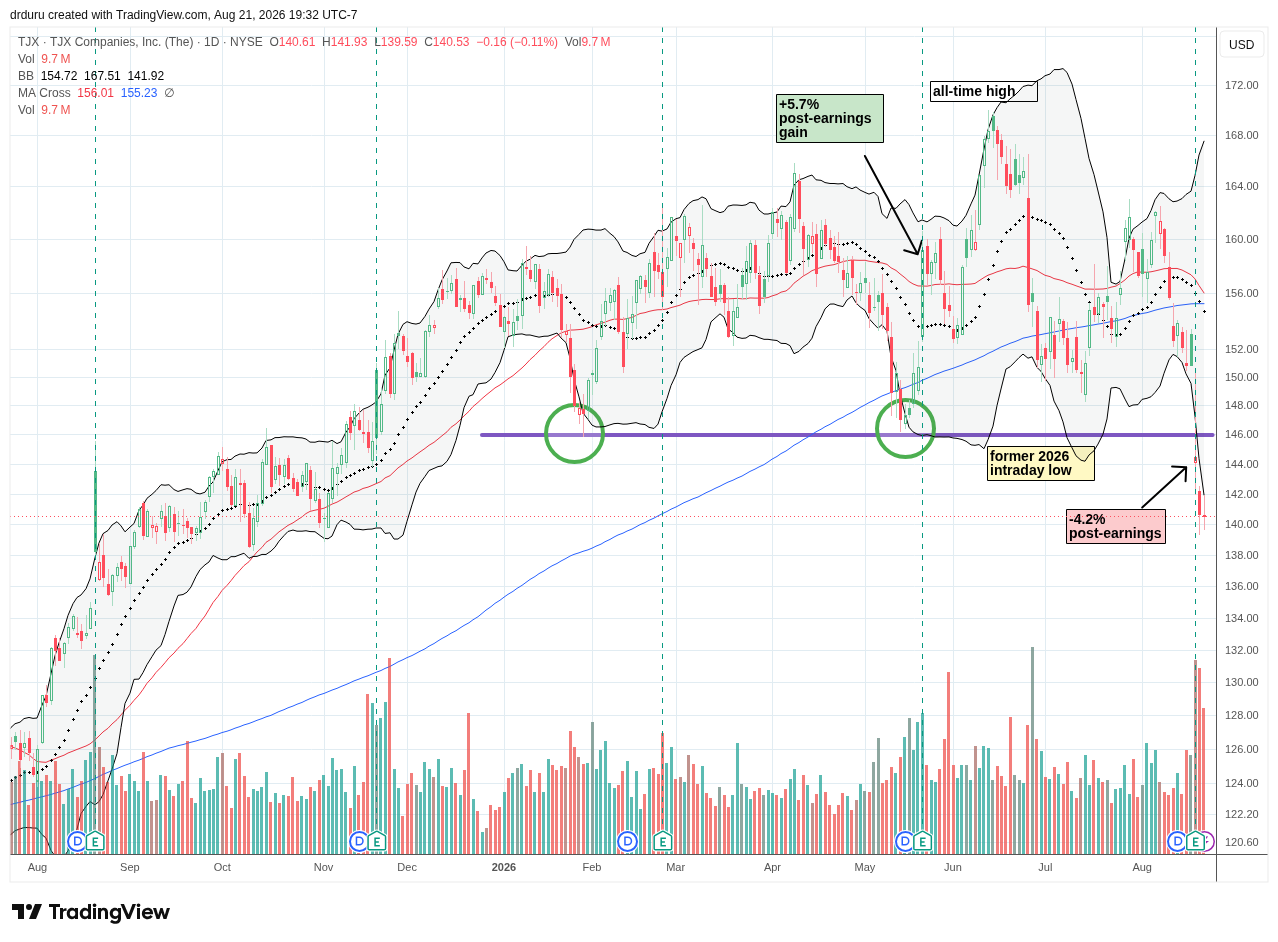
Technical Status: The TJX Companies (TJX) broke down below its 200DMA, and stumbled below the former 2026 intraday low after a 4.2% post-earnings drop.
Trade Commentary: TJX’s 4.2% post-earnings loss was less than half WMT’s fall, but the technical damage was even more stark. TJX surprised me by gapping below former support at the 2026 intraday low. A bearish setup below all the major moving averages just deepened at a 10-month low. I am clinging to shares I thought were “safe” before this breakdown.
Like Walmart, TJX raised EPS guidance for 2027, but the market clearly did not care. Comparable growth at the key Marmaxx division slowed to 1% from 6% in the prior quarter. Management attributed much of that slowdown to merchandise execution rather than a collapse in demand.
Advance Auto Parts (AAP)
Description: Advance Auto Parts sells automotive replacement parts, accessories, batteries, and maintenance products to professional installers and do-it-yourself customers.
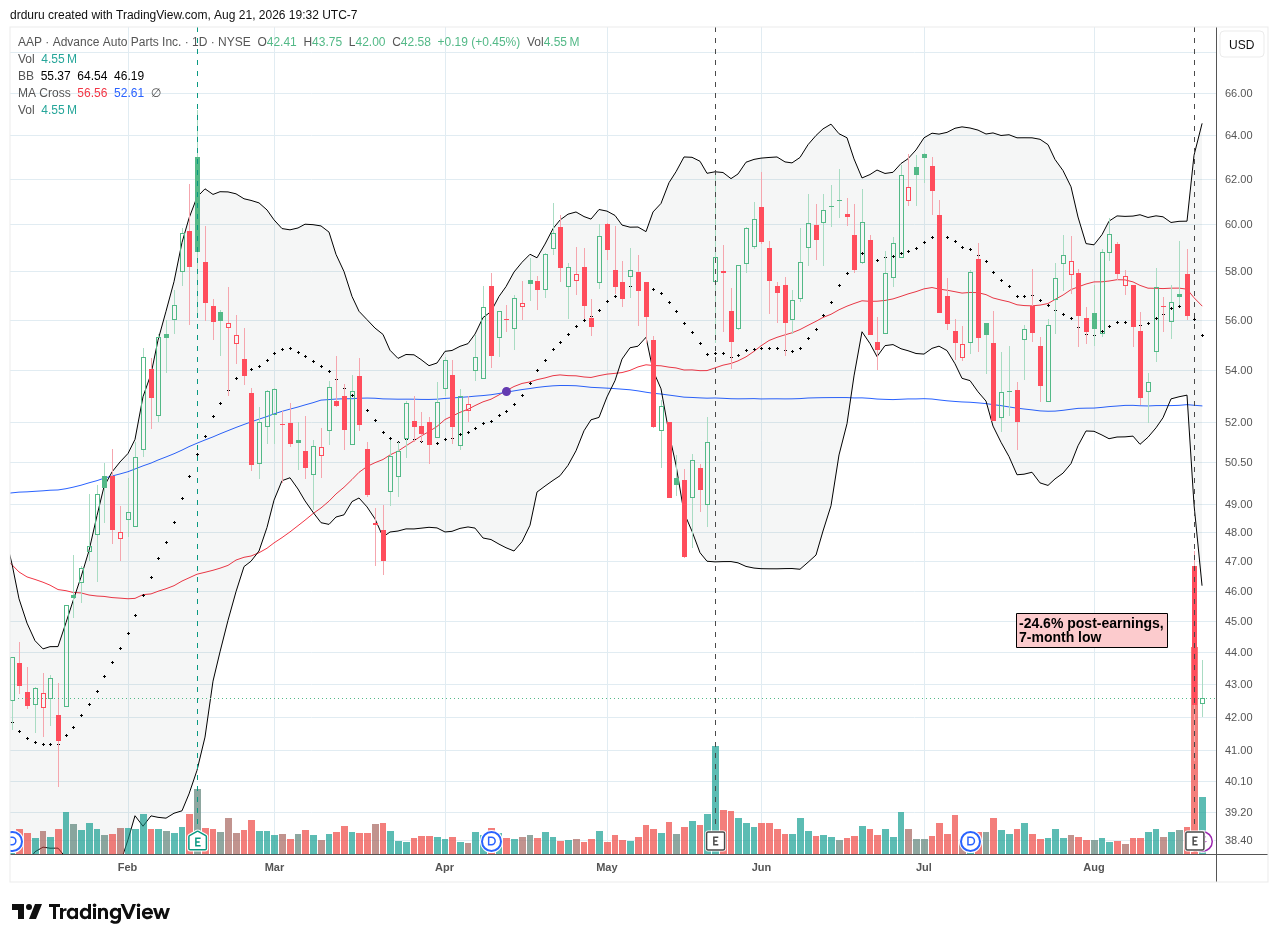
Technical Status: Advance Auto Parts (AAP) crashed down below all of its major moving averages, setting a new 7-month low due to a 24.6% post-earnings decline.
Trade Commentary: AAP added another negative data point to the consumer and retail side of the breadth story Thursday. The company reported Q2 revenue of about $2 billion that came in below expectations, and the company lowered its full-year sales outlook to a midpoint below consensus. The subsequent 24.6% crash returned AAP to bearish territory. The stock has performed poorly since peaking in 2021/2022 around $244.
Target (TGT)
Description: Target is a U.S. general-merchandise retailer selling apparel, food, household goods, beauty products, electronics, and other consumer products through stores and digital channels.
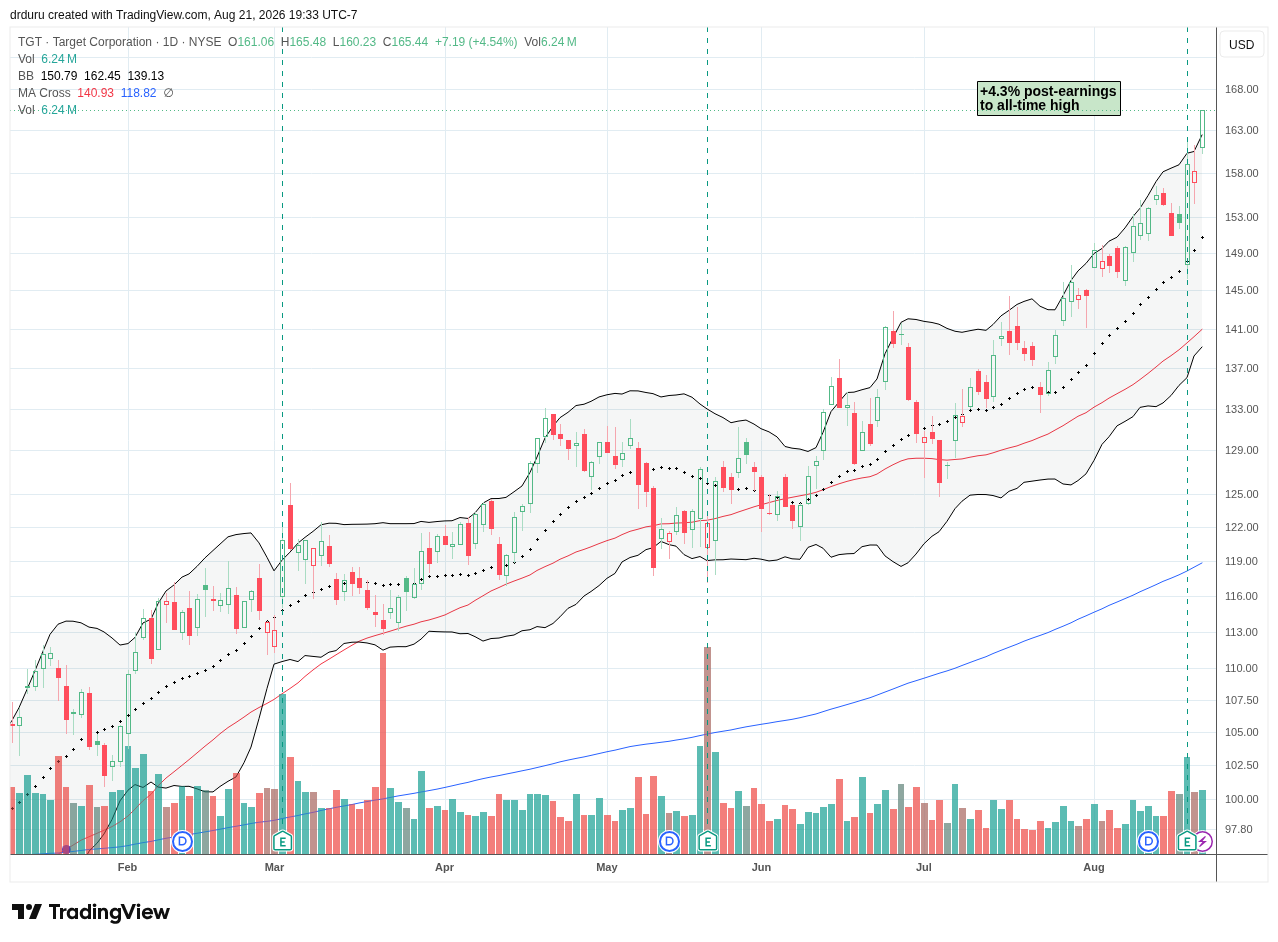
Technical Status: Target Corporation (TGT) continued to follow its uptrend, jumping up 4.3% post-earnings and hitting a 2+ year high.
Trade Commentary: Target stood out from the various retail earnings disasters. The company reported comparable sales that increased 3.8%, traffic up 3.6%, digital comparable sales up 8.7%, and management raised its annual sales forecast. TGT initially gapped down but found immediate support at its uptrending 20DMA. Buyers followed through on Friday with a 4.5% pop. TGT has been a buy on dips all year but I last traded the stock in the early part of the year.
Energy Select Sector SPDR Fund (XLE)
Description: Energy Select Sector SPDR Fund tracks large U.S. energy companies primarily involved in oil, natural gas, equipment, and energy services.
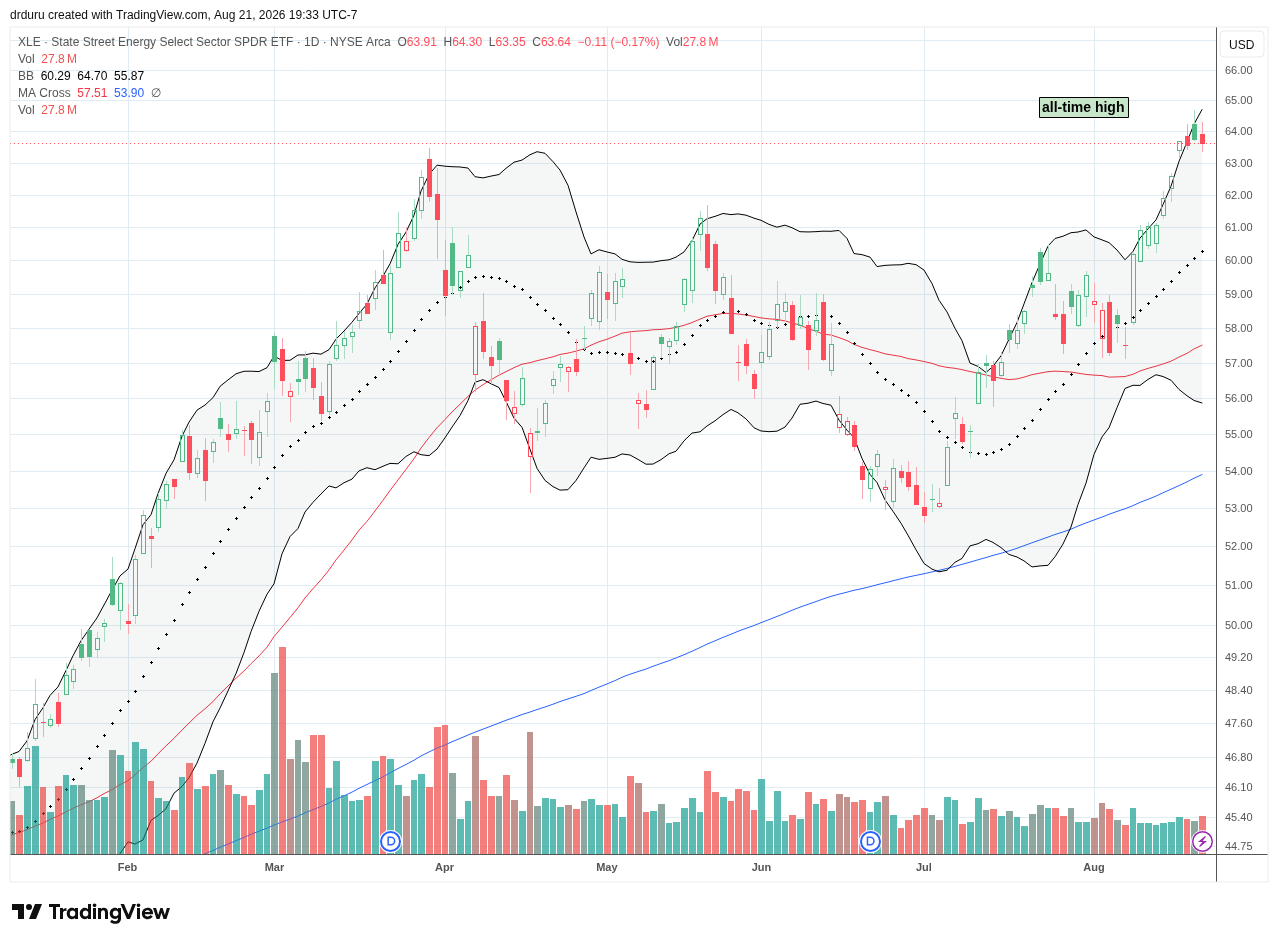
Technical Status: The Energy Select Sector SPDR Fund (XLE) leapt from its 20DMA support and rose alongside its upper Bollinger Band, soon reaching new all-time highs.
Trade Commentary: Energy-related stocks benefited from the week’s rotation. Crude prices advanced throughout the week as renewed Iran-related geopolitical risk kept oil supply concerns elevated, with Brent crude gaining more than 6% for the week. XLE gapped higher 1.8% on Tuesday and held its all-time high the rest of the week.
Health Care Select Sector SPDR Fund (XLV)
Description: Health Care Select Sector SPDR Fund tracks large U.S. healthcare companies spanning pharmaceuticals, biotechnology, medical devices, insurers, and healthcare services.
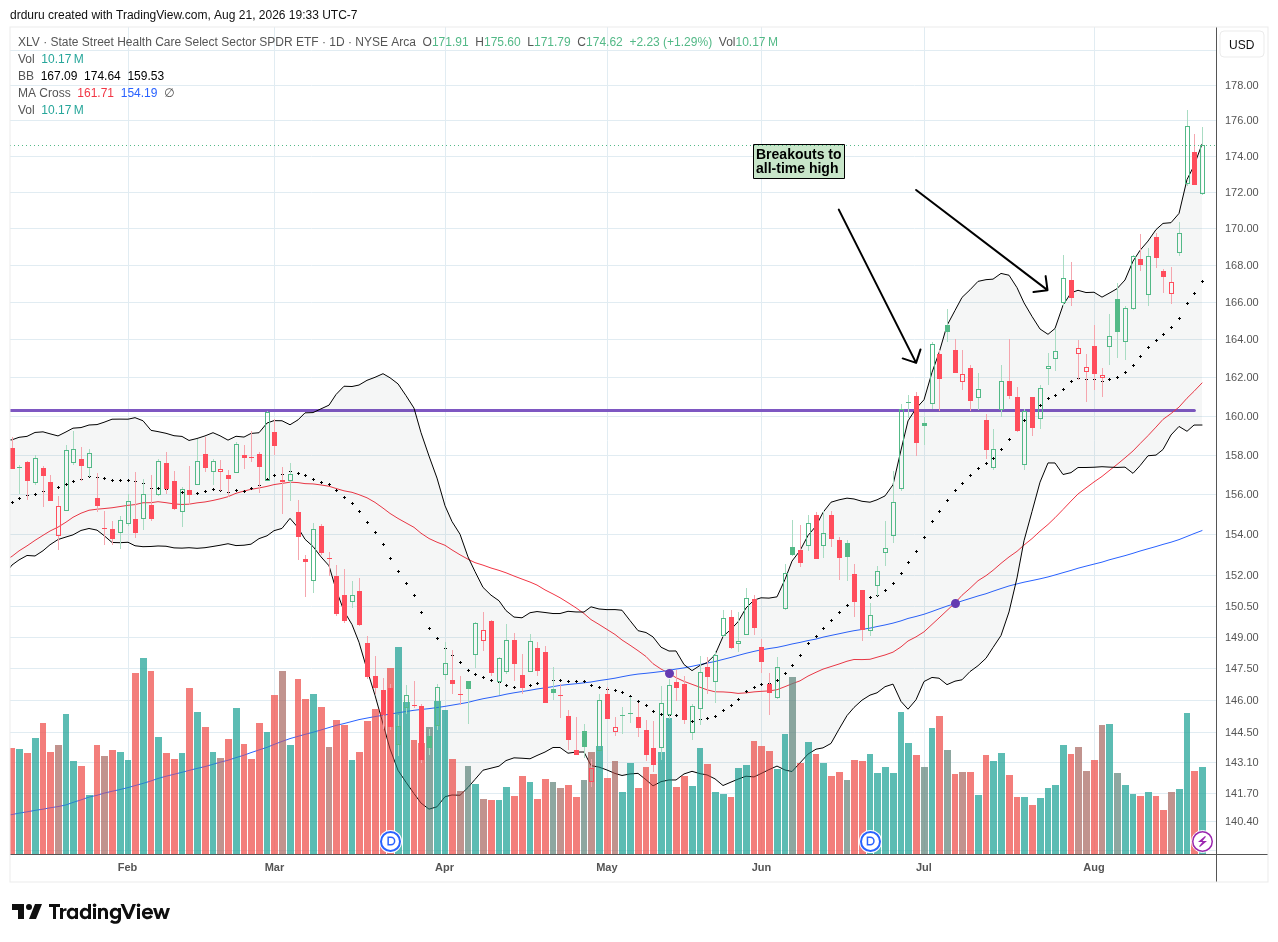
Technical Status: The Health Care Select Sector SPDR Fund (XLV) broke out above its upper Bollinger Band, setting a new all-time high as it continued its uptrend.
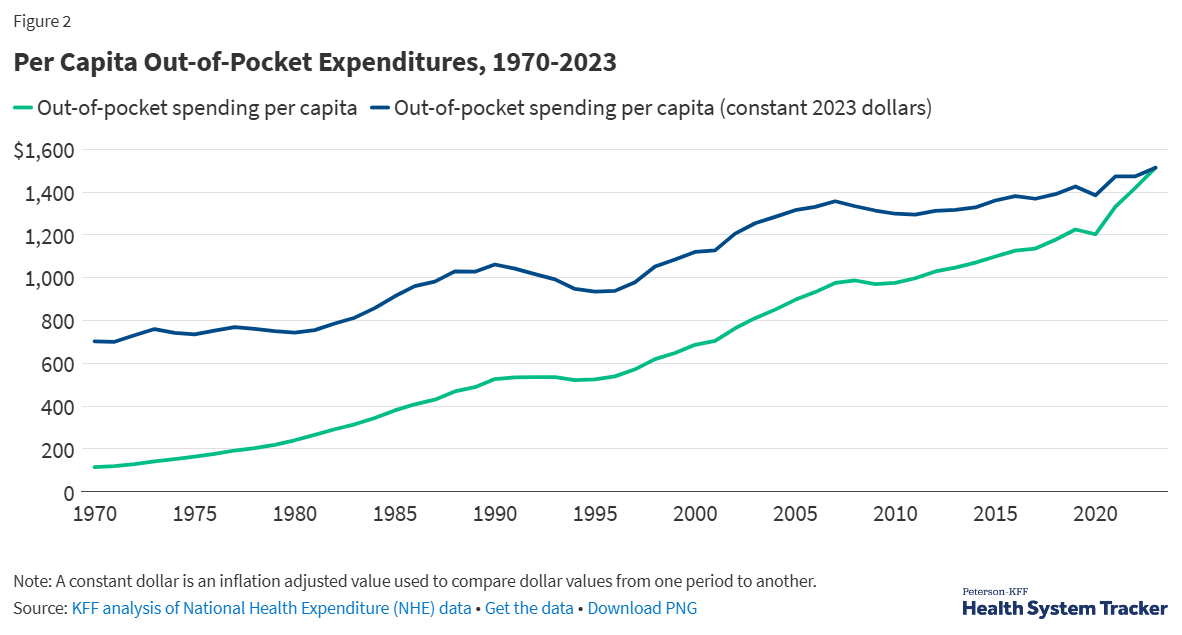
Trade Commentary: Healthcare-related stocks benefited from the week’s rotation. Wednesday was a particularly strong day with Merck & Company (MRK) gaining 12.6% and Moderna tripling on cancer drug news (see below). I am long XLV as part of a demographic trade. The population ages with each passing year and the country’s expenditures on healthcare keep growing at a steady clip.
Moderna (MRNA)
Description: Moderna is a biotechnology company developing medicines and vaccines using messenger RNA technology.
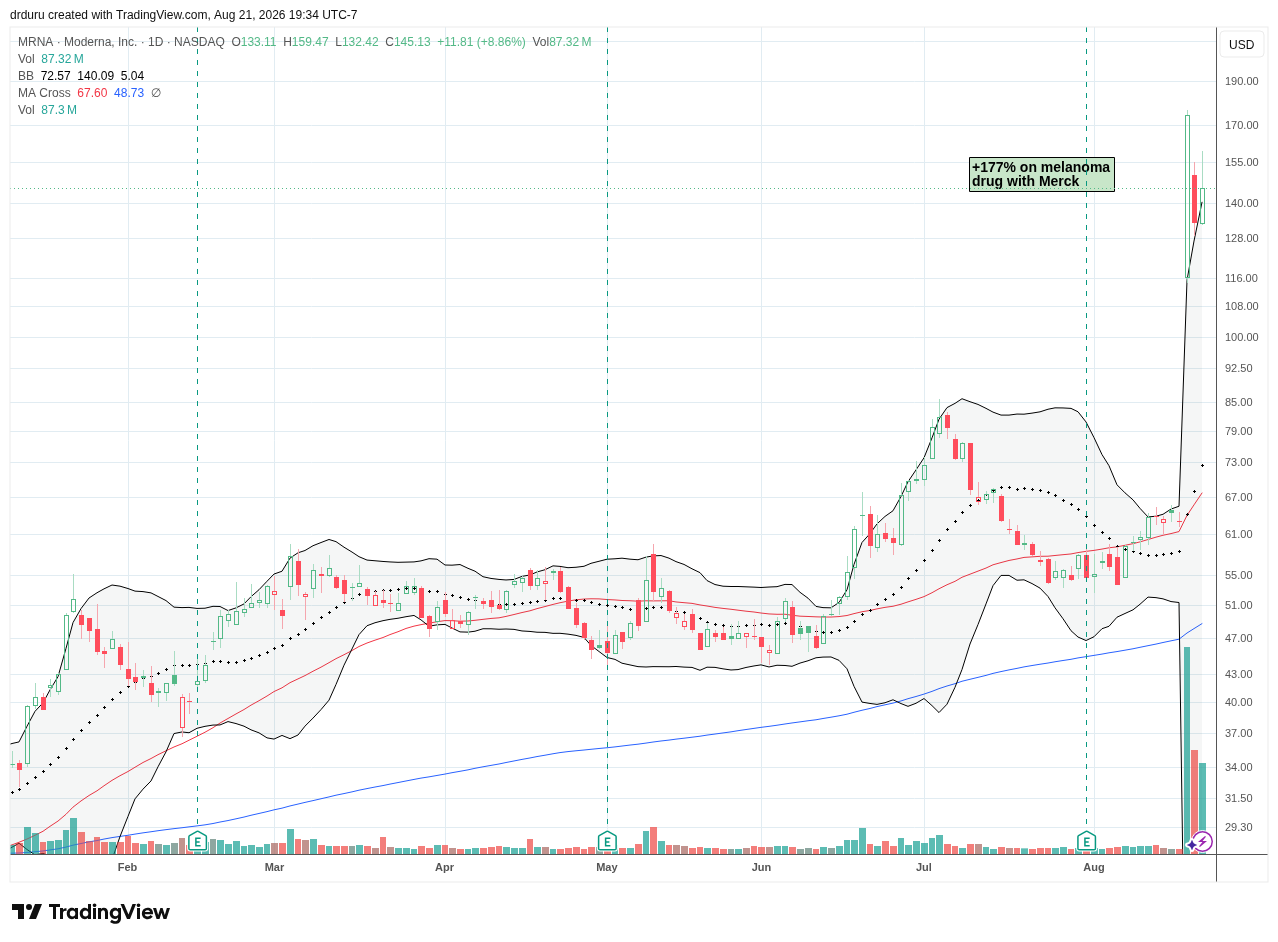
Technical Status: Moderna (MRNA) soared above its 50DMA after a 177% jump and 2-year high after blockbuster cancer-fighting news from its mRNA platform.
Trade Commentary: MRNA propelled itself to the head of the line of this year’s gains. Only Sandisk (SNDK) has gained more than MRNA year-to-date. MRNA’s 177% gain on Wednesday became the biggest one-day gain ever for an S&P 500 stock.
Moderna’s mRNA melanoma treatment with Merck met key goals in a late-stage trial. The result helped validate a potential post-COVID growth platform for Moderna, although detailed efficacy and survival data are still pending. I have long believed MRNA’s platform was a long-term winner, and I treated the bursting of the stock’s bubble as a buying opportunity. Several successful trades did not give me sufficient staying power to hold a core position through 2024’s extended slide. I last traded MRNA earlier this year and thought my 10-15% gain was a big win. My conclusion that the administration was determined to discredit mRNA therapies shook me from my conviction. Things should be different now…
Abbott Laboratories (ABT)
Description: Abbott Laboratories is a diversified healthcare company operating in medical devices, diagnostics, nutritional products, and branded generic pharmaceuticals.
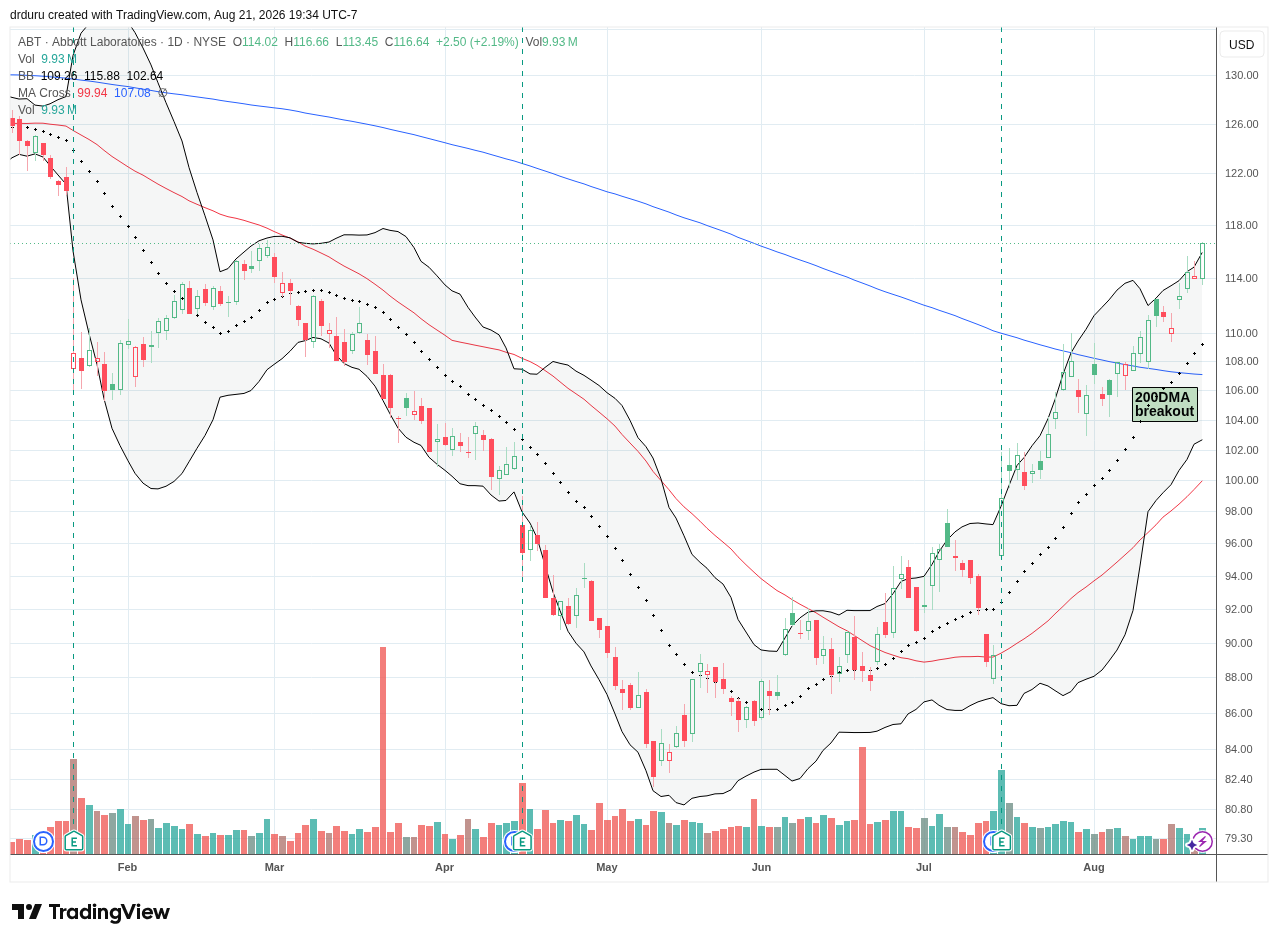
Technical Status: Abbott Laboratories (ABT) broke out above its 200DMA, continuing its new uptrend and reaching February price levels.
Trade Commentary: ABT never delivered a post-earnings pullback as I had hoped, so I just jumped aboard in the middle of the strong uptrend. The 200DMA breakout gives my position much needed cushion, and I hope to ride the stock through an ever-expanding recovery. The MRNA and MRK news likely helped deliver an extra nudge to ABT as investors and traders rushed to rotate into healthcare names.
Amazon.com (AMZN)
Description: Amazon.com operates global e-commerce, cloud computing, digital advertising, entertainment, logistics, and subscription businesses.
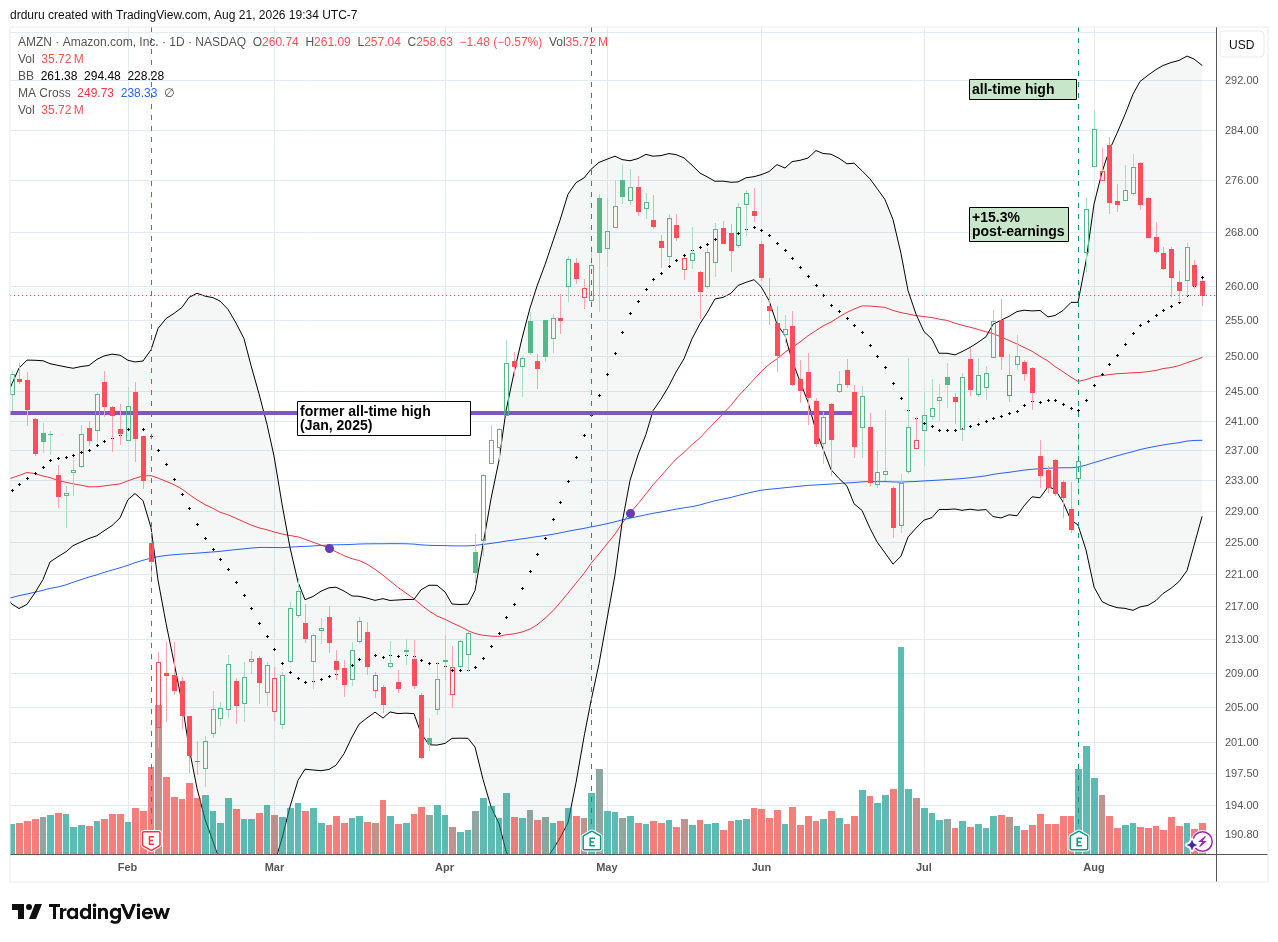
Technical Status: Amazon.com (AMZN) broke out above its 50DMA and reached a new all-time high after a 15.3% post-earnings jump, but fell down to test 20DMA support shortly afterwards.
Trade Commentary: The 2-week window for a post-earnings gain closed on AMZN after one day. The stock has fallen most of the last three weeks as if post-earnings amnesia is settling in. I took a shot at a weekly call spread at the $270 strike and the long end expiring on September 11. I want to give the long end room while assuming AMZN will not trade to $270 in the coming week even with a picture-perfect bounce off 20DMA support.
Amplify Cybersecurity ETF (HACK)
Description: Amplify Cybersecurity ETF tracks companies that generate meaningful revenue from cybersecurity hardware, software, and services.
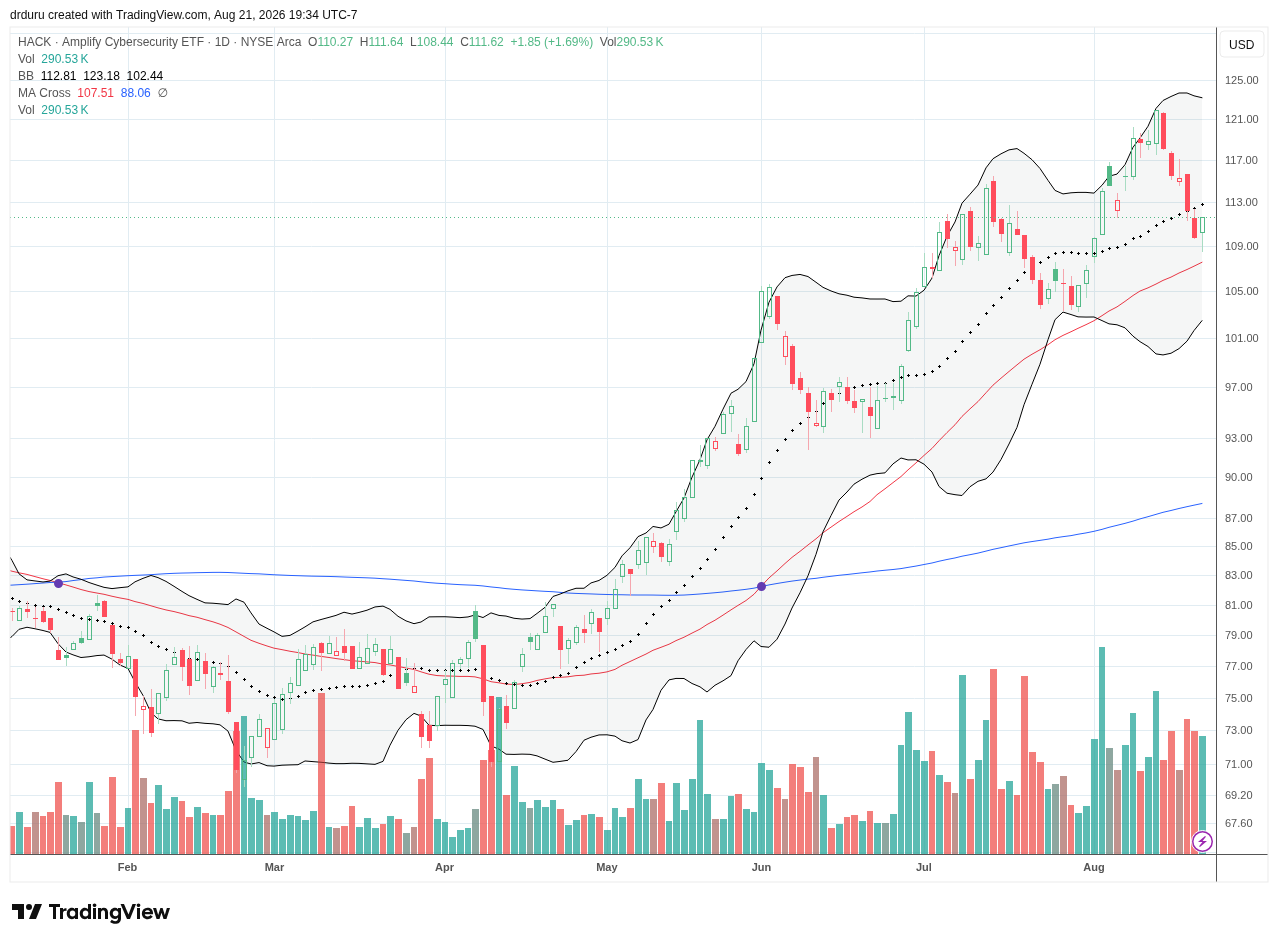
Technical Status: Amplify Cybersecurity ETF (HACK) set up a fresh buying opportunity after an intraday bounce away from 50DMA uptrending support.
Trade Commentary: HACK caught my attention after I noticed Crowdstrike (CRWD) struggling to hold 50DMA support. On Friday, HACK’s intraday low stopped just short of 50DMA support. Assuming this test was “close enough”, I am a buyer of HACK above $113. Given my bullishness on cybersecurity stocks, I would be looking to hold such a position for quite some time. If HACK slices through 50DMA support, I will look for next support at the July low around $103.
Robinhood Markets (HOOD)
Description: Robinhood Markets operates a digital brokerage platform offering stocks, options, cryptocurrencies, retirement accounts, and other financial products.
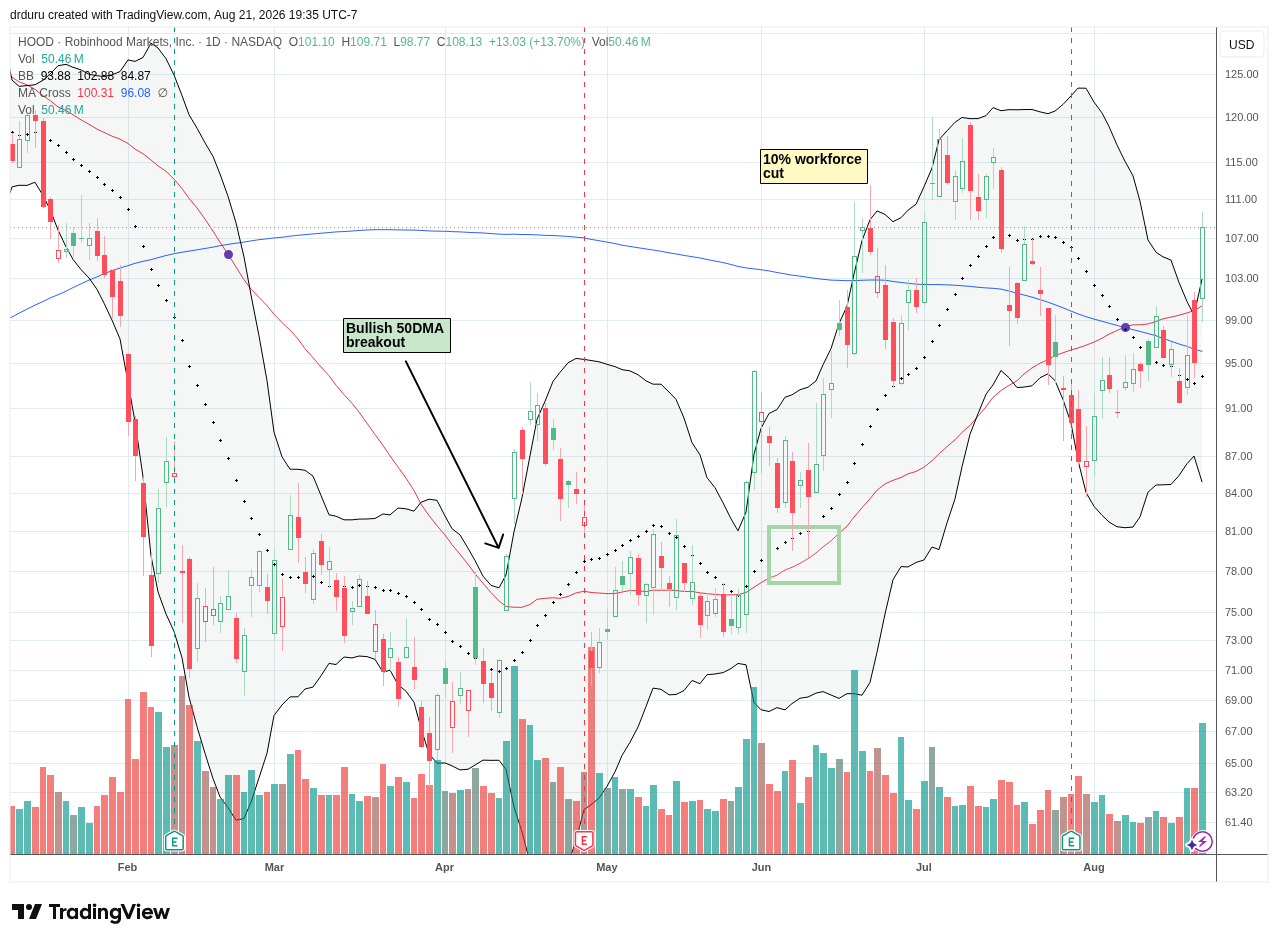
Technical Status: Robinhood Markets, Inc (HOOD) soared 13.7% in a delayed reaction to a strong week for crypto. Favorable regulatory news for Hyperliquid pushed the needle.
Trade Commentary: Earlier in the month, I made plans to buy HOOD only after it recovered support from its major moving averages. I watched HOOD’s steady post-earnings recovery with increasingly itchy trade fingers, but last week’s trading action threw me for a loop. While Bitcoin (BTC/USD) and other cryptocurrencies were surging, HOOD surprisingly struggled with 200DMA resistance including a 4.9% drop on Tuesday. When HOOD finally broke through 200DMA support on Thursday, the stock gapped above 50DMA resistance only to fade all the way to a 0.7% loss and a fresh close below the 200DMA. In retrospect, I should have interpreted this counterintuitive behavior as a rare buying opportunity. HOOD gapped higher again on Friday and managed to follow through to a 13.7% gain. Now the stock is too far above its upper Bollinger Band (BB) for a good risk/reward entry. I am watching to buy a pullback to somewhere just north of $100.
The Charles Schwab Corporation (SCHW)
Description: The Charles Schwab Corporation provides brokerage, wealth management, banking, custody, and investment-advisory services.
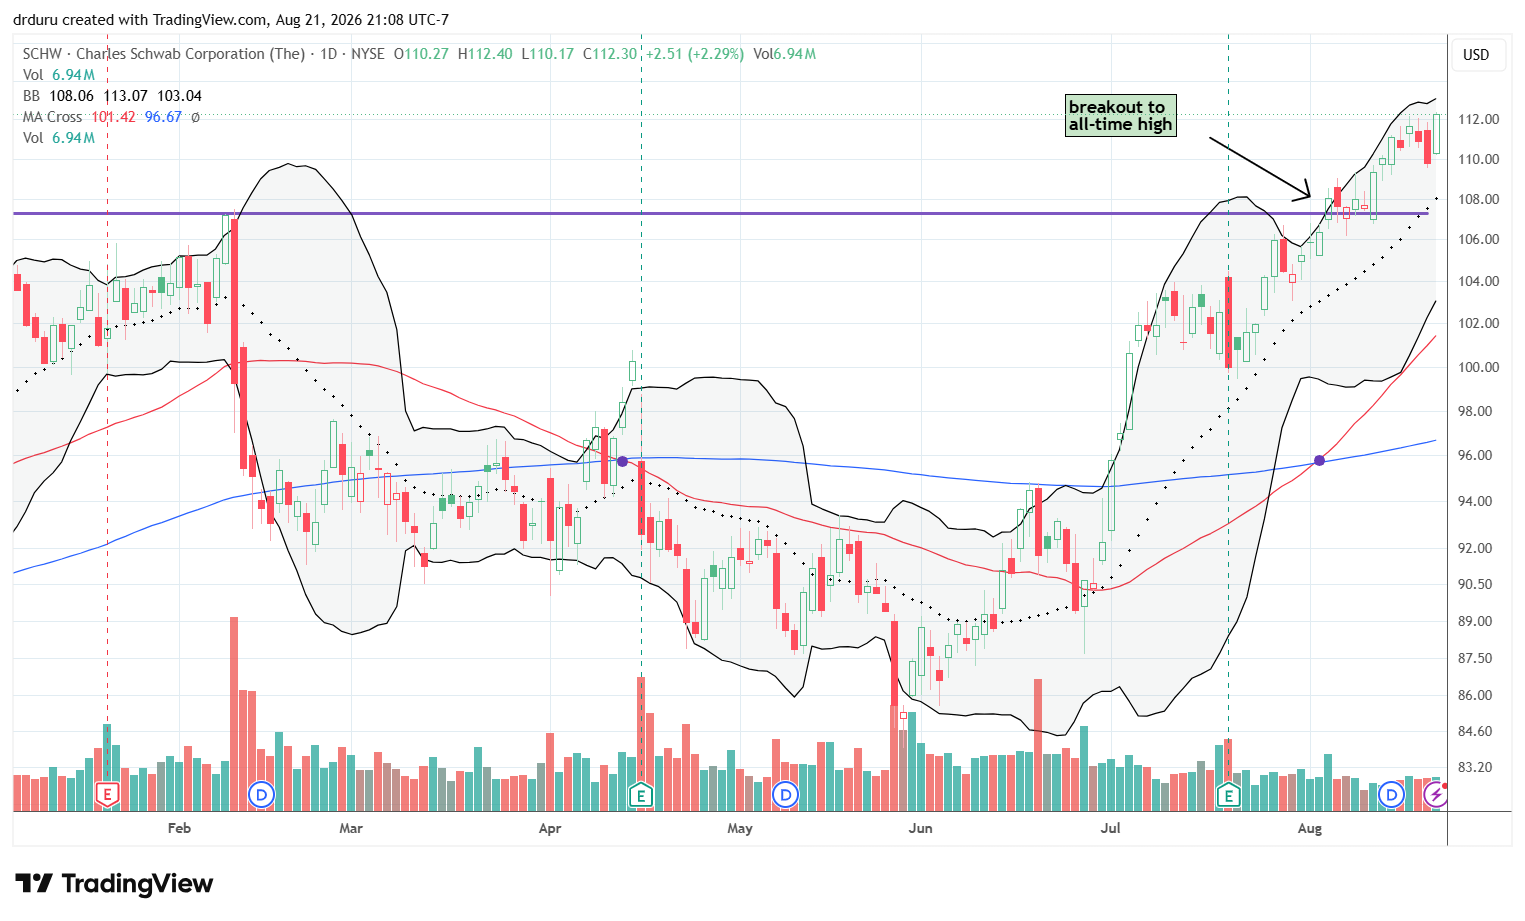
Technical Status: Charles Schwab (SCHW) has hit new all-time highs all month.
Trade Commentary: I find it hard to believe that during 2023’s regional bank crisis SCHW was considered high risk and in trouble. Fast forward to today and the stock trades at all-time highs. I last considered SCHW for a buy over two years ago, but I could never pull the trigger. I consider the stock a buy on a pullback to its last breakout point with a stop-loss below that point.
Reddit (RDDT)
Description: Reddit operates a social media platform organized around user-created communities, discussions, advertising, data licensing, and related services.
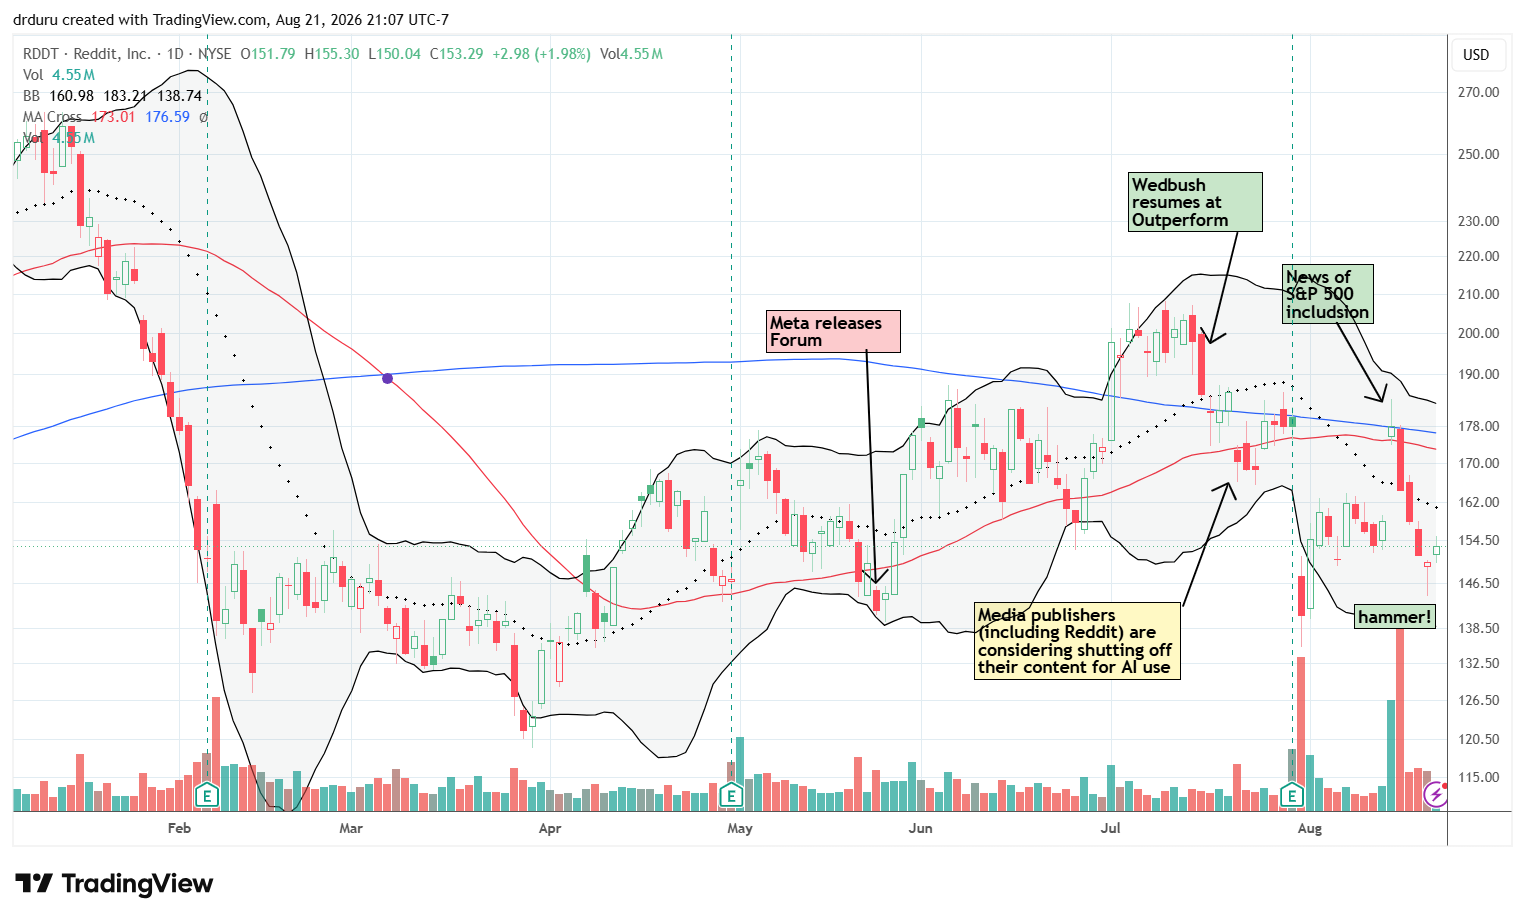
Technical Status: Reddit, Inc (RDDT) gave up all its gains and then some following S&P 500 inclusion news but ended the week confirming a bottoming hammer.
Trade Commentary: Just as I feared a week ago would happen, RDDT suffered a top following news of its inclusion in the S&P 500 index. Still, the subsequent selling surprised me with its swiftness and depth. RDDT reversed its 12.6% gain from the inclusion news and more. I reloaded on a call spread (this time a September $160/$175) on Wednesday and was relieved on Friday to see the stock confirm a bottoming hammer pattern. I am looking for another run to at least 50DMA resistance.
Box Inc (BOX)
Description: Box provides cloud content management, collaboration, workflow, security, and artificial-intelligence tools for enterprise customers.
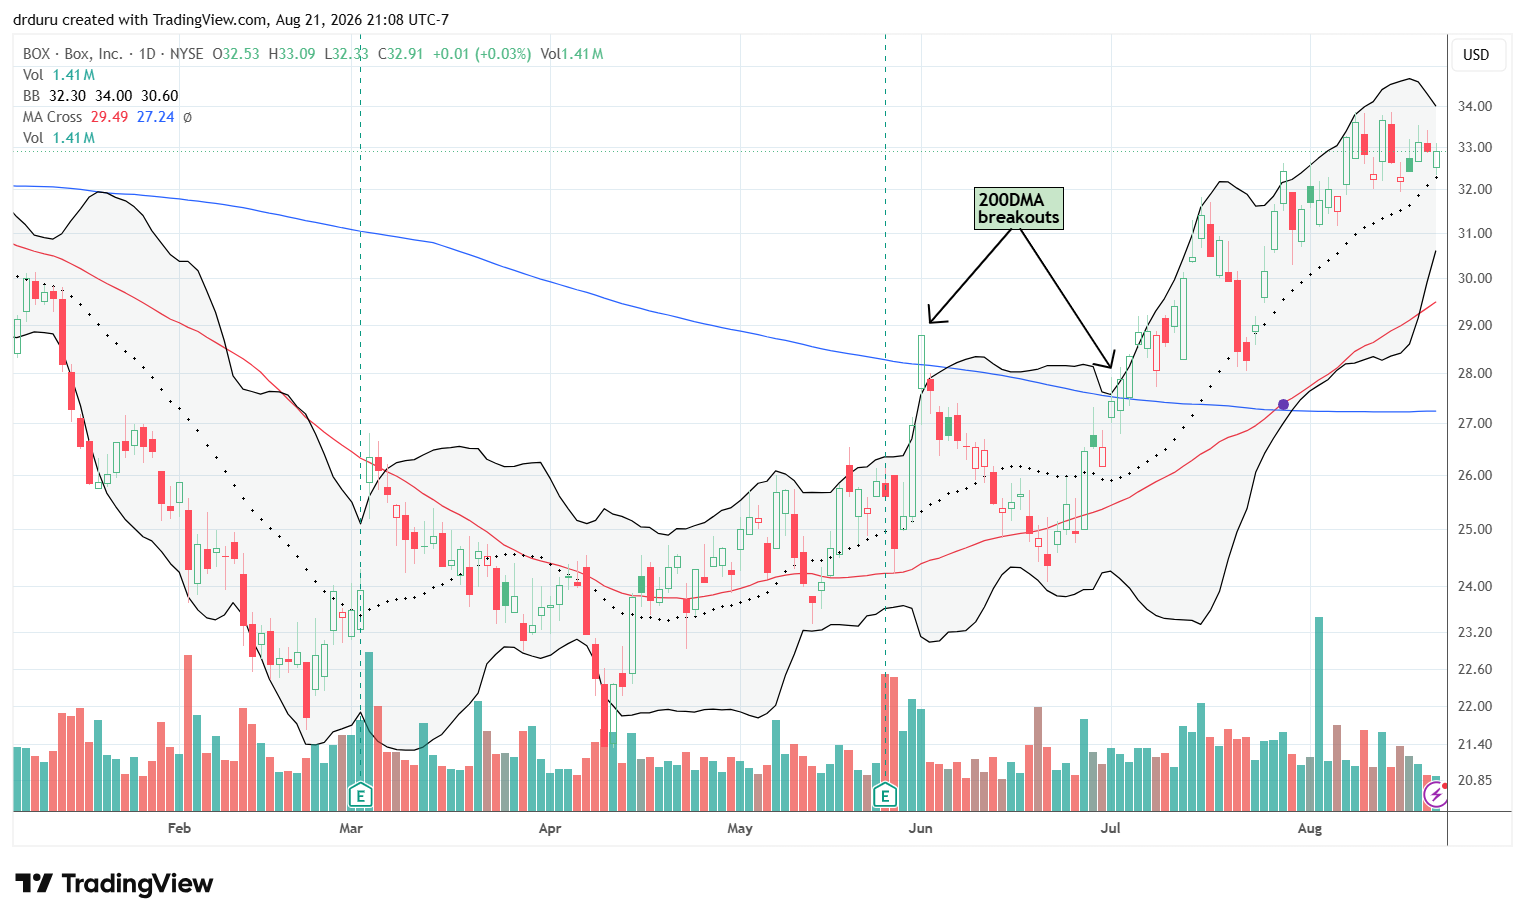
Technical Status: Box Inc (BOX) has followed an uptrending 20DMA since April with a 200DMA breakout underlining the stock’s recent strength.
Trade Commentary: BOX was the first oversold software stock I bought this year. The bullish case I made then formed the beginnings of my PAIROS (Panic AI Research On Software) framework for buying software stocks hit by the AI Panic that caused the SaaSpocalypse. BOX has been the least volatile of the bunch and is one of the best year-to-date performers with a 10% gain.
Like some of my other software holdings, I was able to regularly profit off selling call options against my positions. That streak came to an end this weekend after BOX barely managed to close in the money on my short August $32 calls. However, unlike my experience with losing Atlassian (TEAM), I am quite satisfied with the overall results from BOX. I accumulated shares, sold several rounds of call options, and I am good sitting on the sidelines ahead of this week’s earnings. Near the top of a very choppy 5-year trading range, I am fine taking profits here. Still, I consider BOX a buy-on-the-dips, so I am eagerly awaiting an opportunity to run PAIROS on the upcoming earnings report.
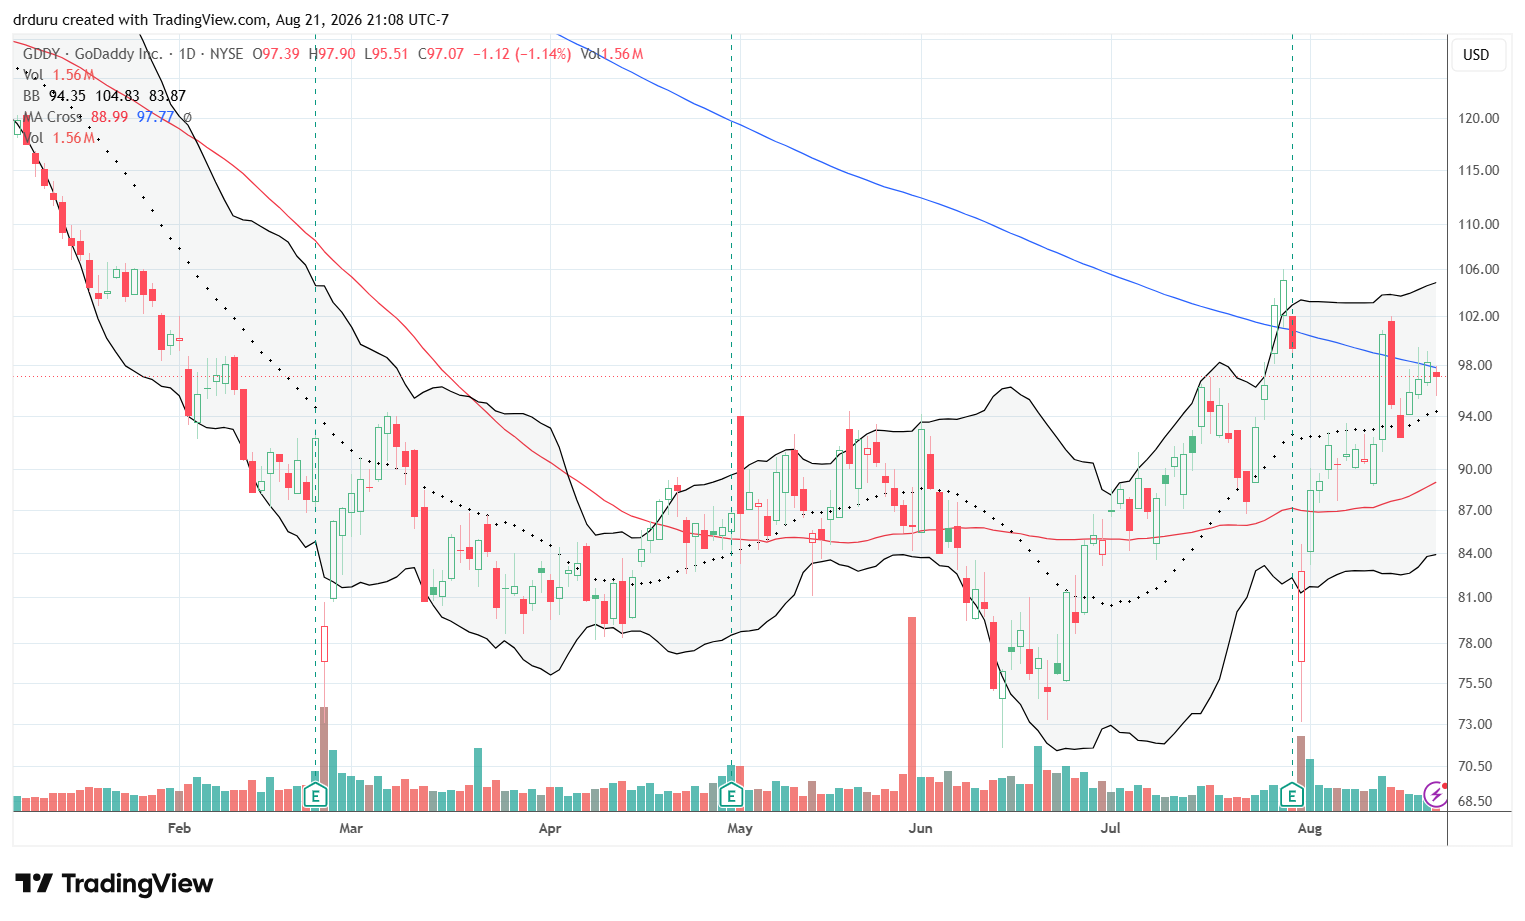
GoDaddy (GDDY)
Description: GoDaddy provides domain registration, website hosting, commerce, marketing, and other digital tools primarily for entrepreneurs and small businesses.
Technical Status: GoDaddy Inc (GDDY) briefly recovered all its post-earnings loss and is now fighting for a 200DMA breakout.
Trade Commentary: Earlier this month, I examined GDDY for a trade after a post-earnings crash. The stock finally flashed a buy signal after breaking out above its 200DMA resistance and closing the post-earnings gap down. I bought stock the next day after it pulled back 5.6%. Now I am holding on for a breakout above its pre-earnings peak.
Footnotes
Subscribe for free to get email notifications of future posts!
“Above the 50” (AT50) uses the percentage of stocks trading above their respective 50-day moving averages (DMAs) to measure breadth in the stock market. Breadth defines the distribution of participation in a rally or sell-off. As a result, AT50 identifies extremes in market sentiment that are likely to reverse. Above the 50 is my alternative name for “MMFI” which is a symbol TradingView.com and other chart vendors use for this breadth indicator. Learn more about AT50 on my Market Breadth Resource Page. AT200, or MMTH, measures the percentage of stocks trading above their respective 200DMAs.
Active AT50 (MMFI) periods: Day #272 over 20%, Day #99 over 30%, Day #95 over 40%, Day #50 over 50% (overperiod), Day #5 under 60% (underperiod), Day #245 under 70%
Source for charts unless otherwise noted: TradingView.com
Full disclosure: long IWM call options, long ABT, long SMH put spread, long TJX, long XLV, long PHYS, long RDDT call spread, long WMT, long AMZN calendar call spread, long MU call spread, long GDDY, long BTC/USD
FOLLOW Dr. Duru’s commentary on financial markets via StockTwits, BlueSky, and even Instagram!
*Charting notes: Stock prices are not adjusted for dividends. Candlestick charts use hollow bodies: open candles indicate a close higher than the open, filled candles indicate an open higher than the close.
* Blog notes: I use ChatGPT to help with editing and news discovery.