

The Market Breadth Summary
- A weaker-than-expected September jobs report briefly pushed bond yields lower and helped pull market breadth back from oversold’s edge, but the relief in yields faded by Friday’s close.
- The S&P 500 confirmed 50DMA support and the NASDAQ reached a fresh all-time high, while the equal-weighted S&P 500 and small caps remained under technical pressure.
- AT50 rebounded from 23.2% to finish the week at 27.9%, while AT200 hit a new low for the year before Friday’s rebound, leaving the broader market’s health in a weak position.
- AI-related and semiconductor stocks produced several bullish breakouts, but long-duration Treasuries, financials, and other rate-sensitive areas continued to show significant weakness.
The Stock Market Summary
Last week started with a major market tension: levitating major indices versus plunging market breadth. The week ended with little resolution as tech stocks, mostly AI-related, reaffirmed the bullish posture of the S&P 500 and the NASDAQ while bond yields maintained a persistent rally that imperils Friday’s retreat from oversold’s edge and a related rebound for a host of rate-sensitive stocks. A weaker than expected September jobs report pulled bond yields down for just a brief moment on Friday. Thus elevated oil prices, sticky inflation, and strong measures of economic growth are positioned to intensify the tensions in the stock market. As the third of the stock market’s three most dangerous months of the year, October provides a classic backdrop for a downside resolution to these tensions. If that downside move pushes breadth into oversold territory, those conditions could build the foundation for the next rally.
S&P 500 (SPY)
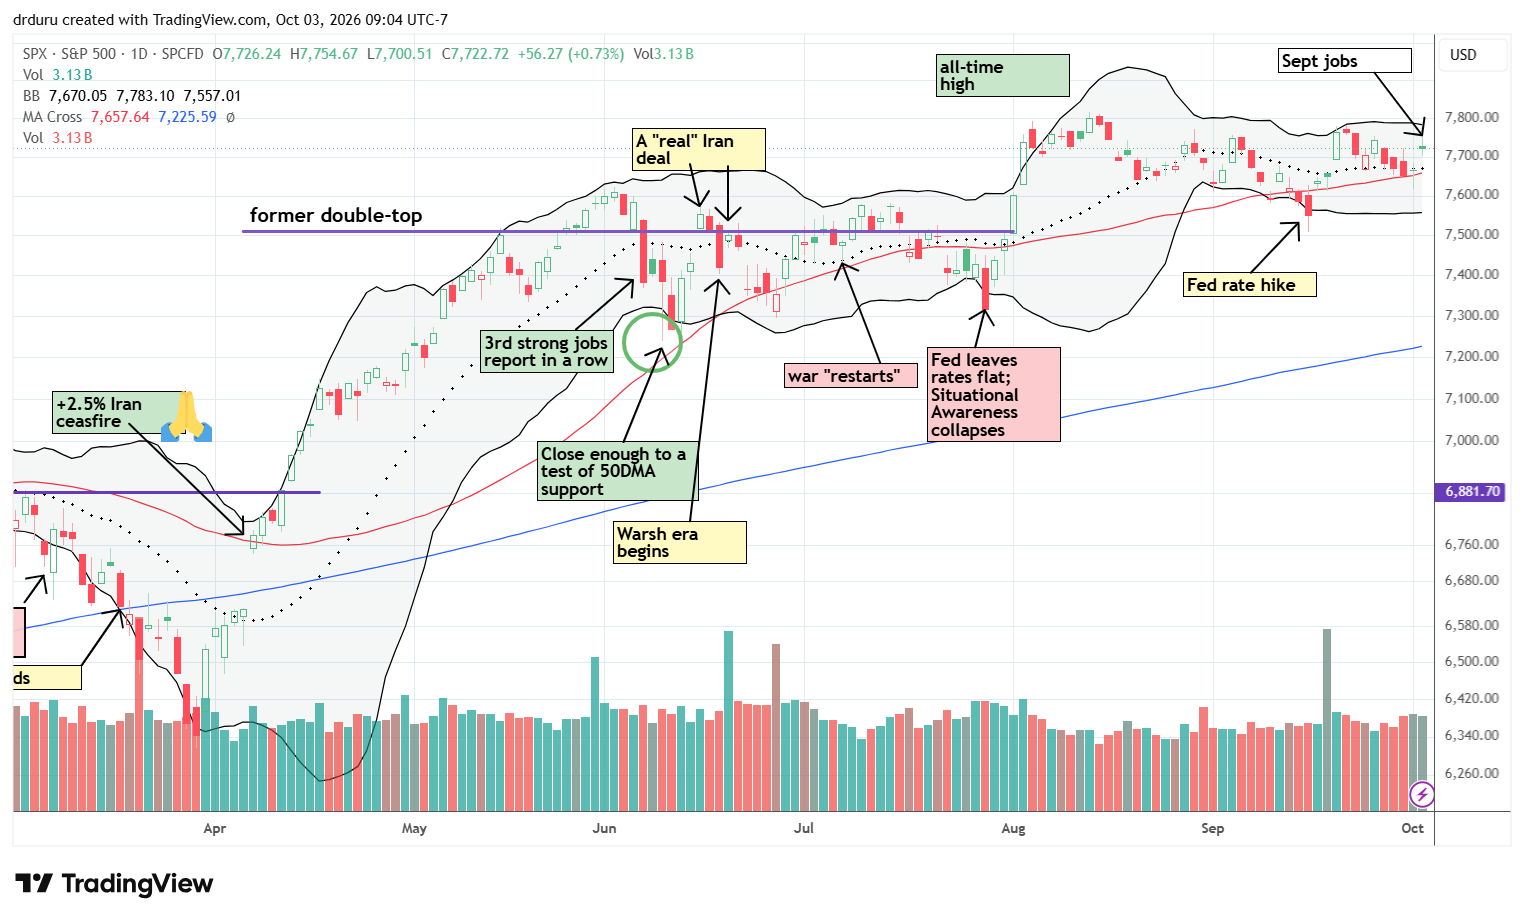
The S&P 500 (SPY) has gone nowhere for two months. Momentum in the index came to a sharp halt after a 4-day run took the index to a fresh all-time high. During this time, the S&P 500 survived a breakdown below its 50-day moving average (DMA) (red line) and, last week, neatly and perfectly confirmed 50DMA support. This relatively placid trading completely hides the underlying plunge in market breadth to oversold’s edge.
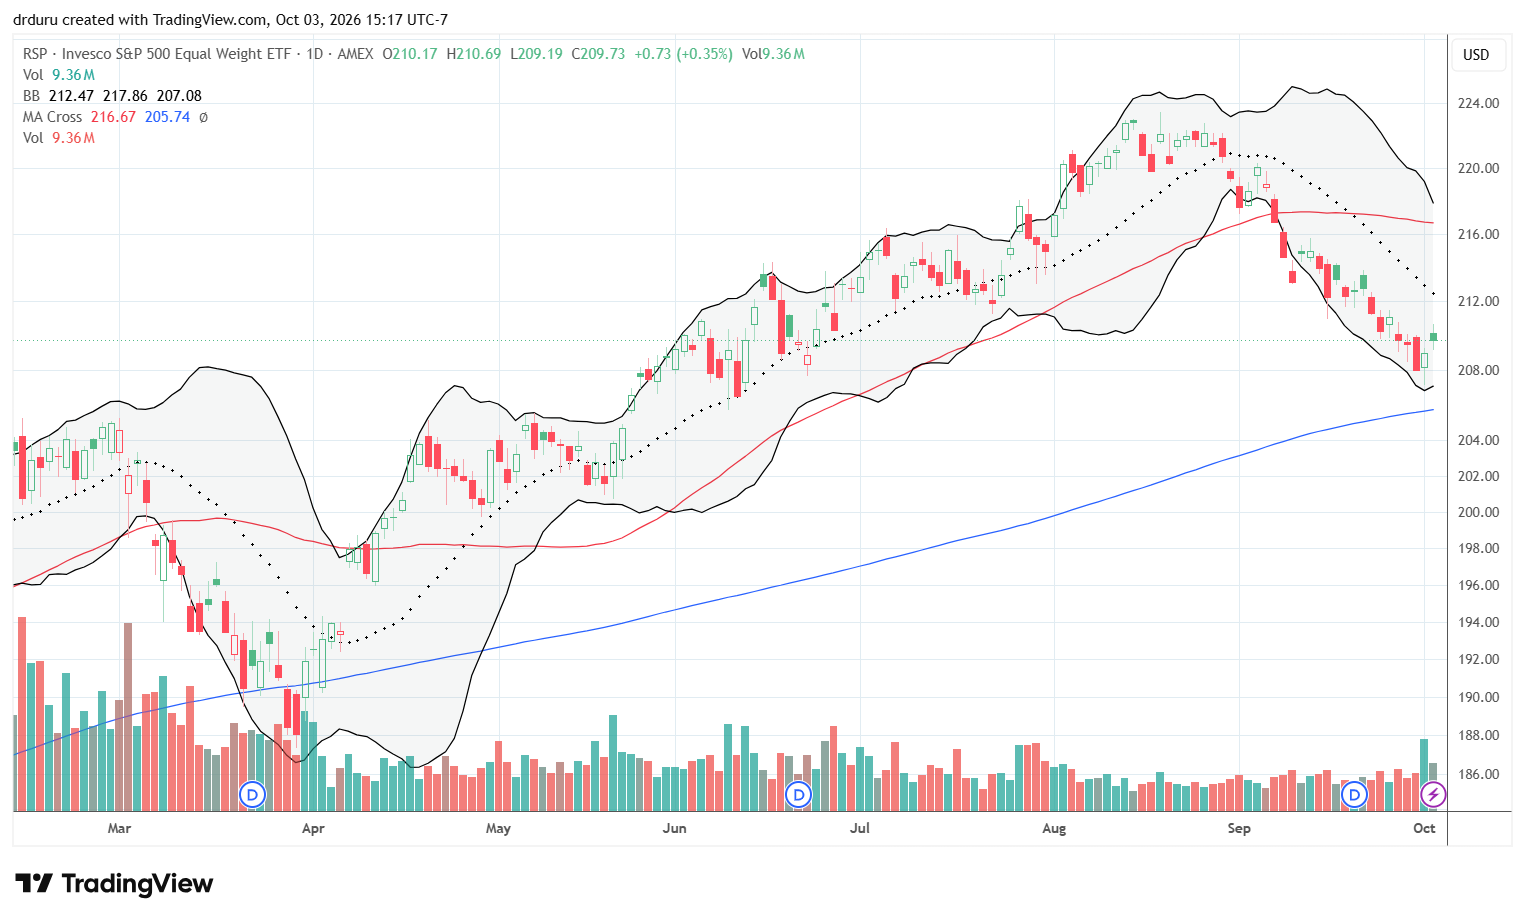
The equal-weighted S&P 500 index presents a more accurate representation of what is happening beyond the biggest stocks and across a broad range of equities. The Invesco S&P 500 Equal Weight ETF (RSP) suffered a 50DMA breakdown in early September and last week barely averted a test of 200DMA (blue line) support.
NASDAQ (COMPQ)
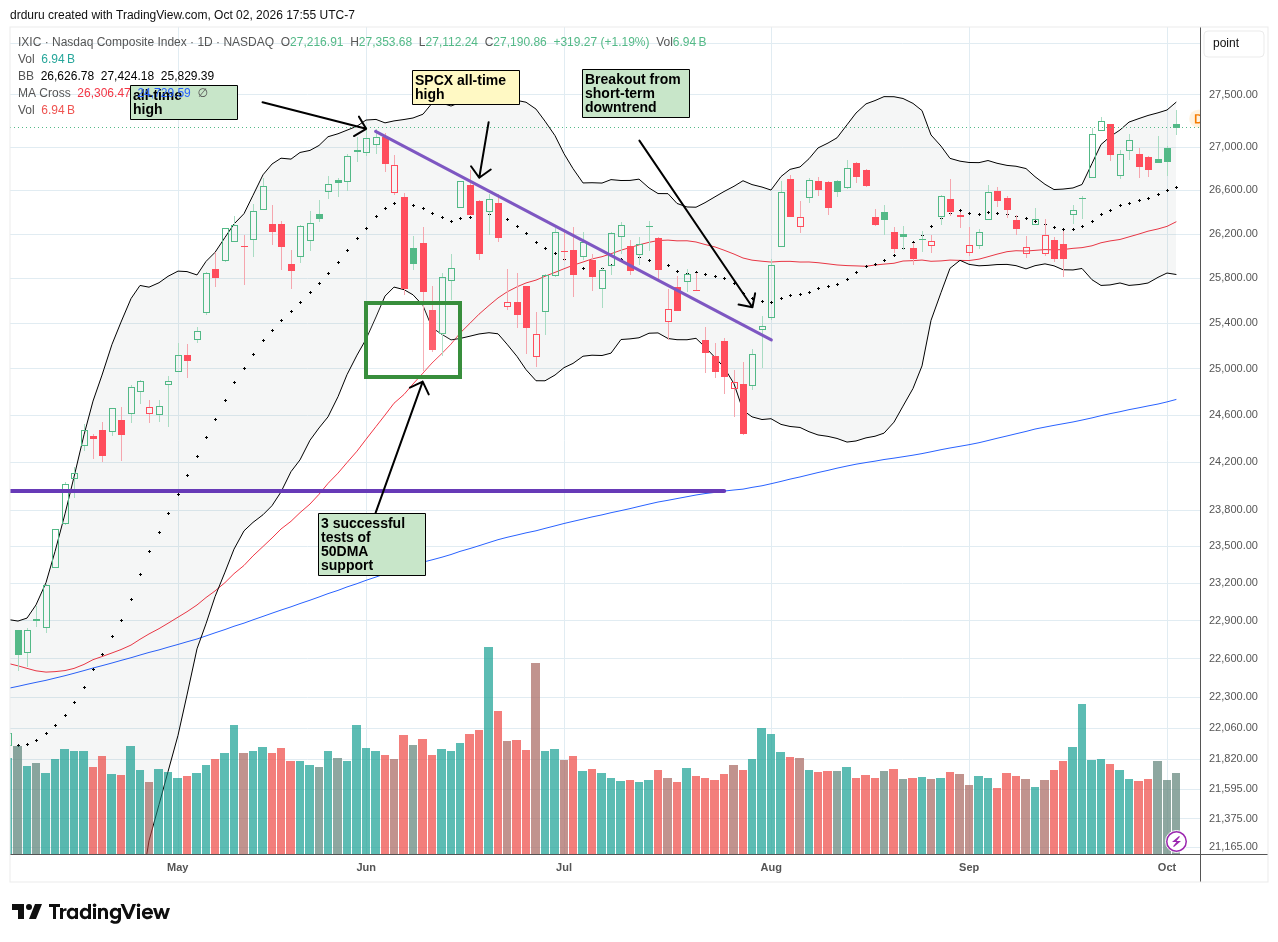
The NASDAQ (COMPQ) has finally flipped the script on the S&P 500. The tech-laden index scored a marginal all-time high in the previous week and finished last week briefly enjoying a new all-time high. The shallow fade on Friday still leaves the NASDAQ poised for a breakout. The ability for the NASDAQ to largely ignore the sell-off in the bond market means that money could become increasingly attracted to chasing tech names, especially AI-related stocks.
iShares Russell 2000 ETF (IWM)
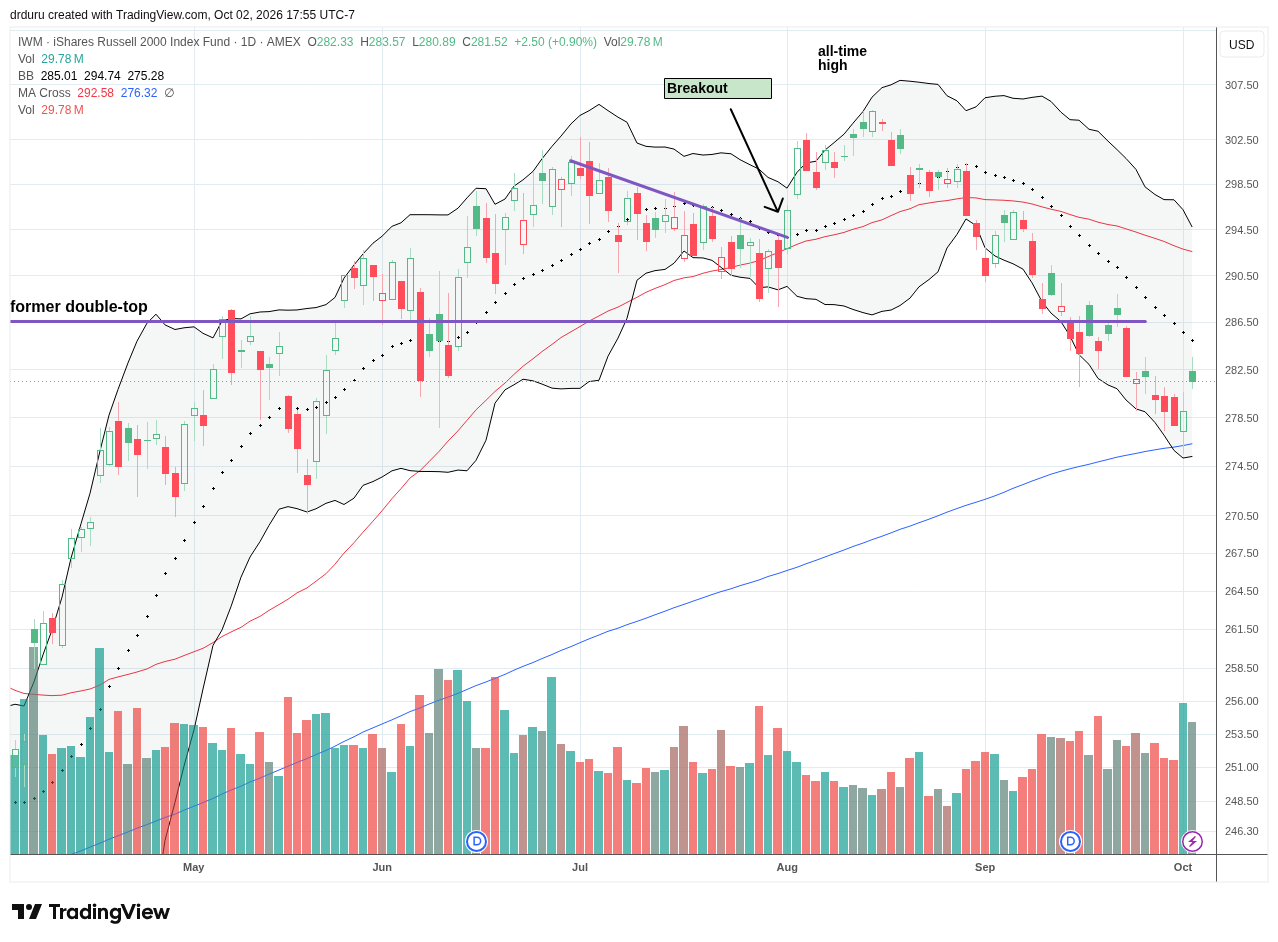
On Friday, the iShares Russell 2000 ETF (IWM) enjoyed its largest one-day gain in two months. Yet, the ETF of small caps remains stuck in a downtrend defined by its 20DMA (dashed line). Fortunately, IWM has been relatively consistent in rebounding off the bottom of its downtrend channel, facilitating mostly profitable trades. So of course I loaded up on call options as IWM tested 200DMA support on Thursday. I took profits near the open as IWM gapped higher; it closed the day with a 0.9% gain.
The Short-Term Trading Call At Oversold’s Edge
- AT50 (MMFI) = 27.9% of stocks are trading above their respective 50-day moving averages
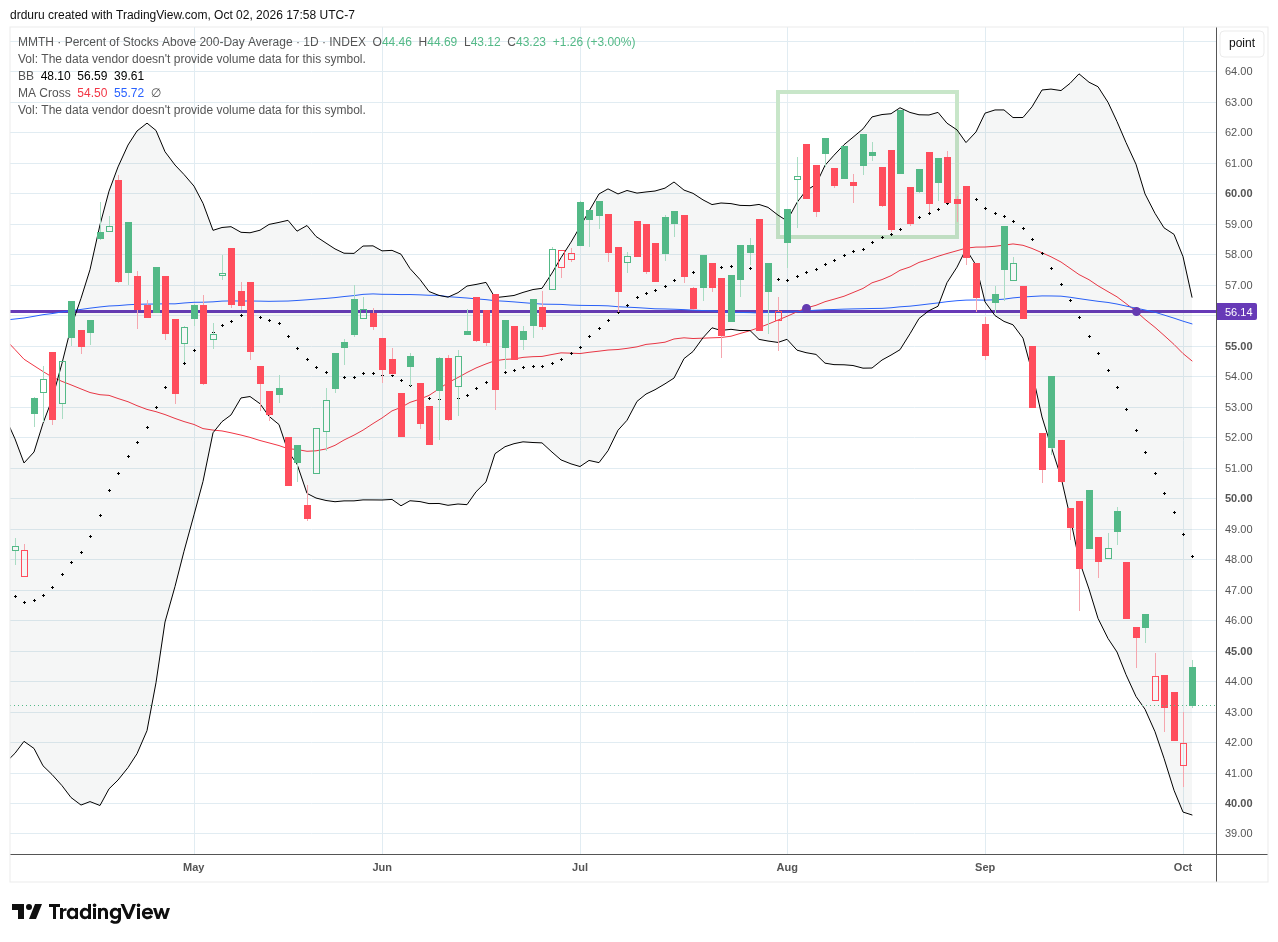
- AT200 (MMTH) = 43.2% of stocks are trading above their respective 200-day moving averages
- Short-term Trading Call: neutral
AT50 (MMFI), the percentage of stocks trading above their respective 50DMAs, closed the week at 27.9%. A week ago, I estimated that my favorite technical indicator was on pace to hit oversold levels within 2 weeks. On Thursday, AT50 dropped as low as 23.2%. With the 20% oversold threshold representing an anchor point within a range, I am comfortable declaring my prediction validated. The outstanding question is whether the market actually found a bottom last week.
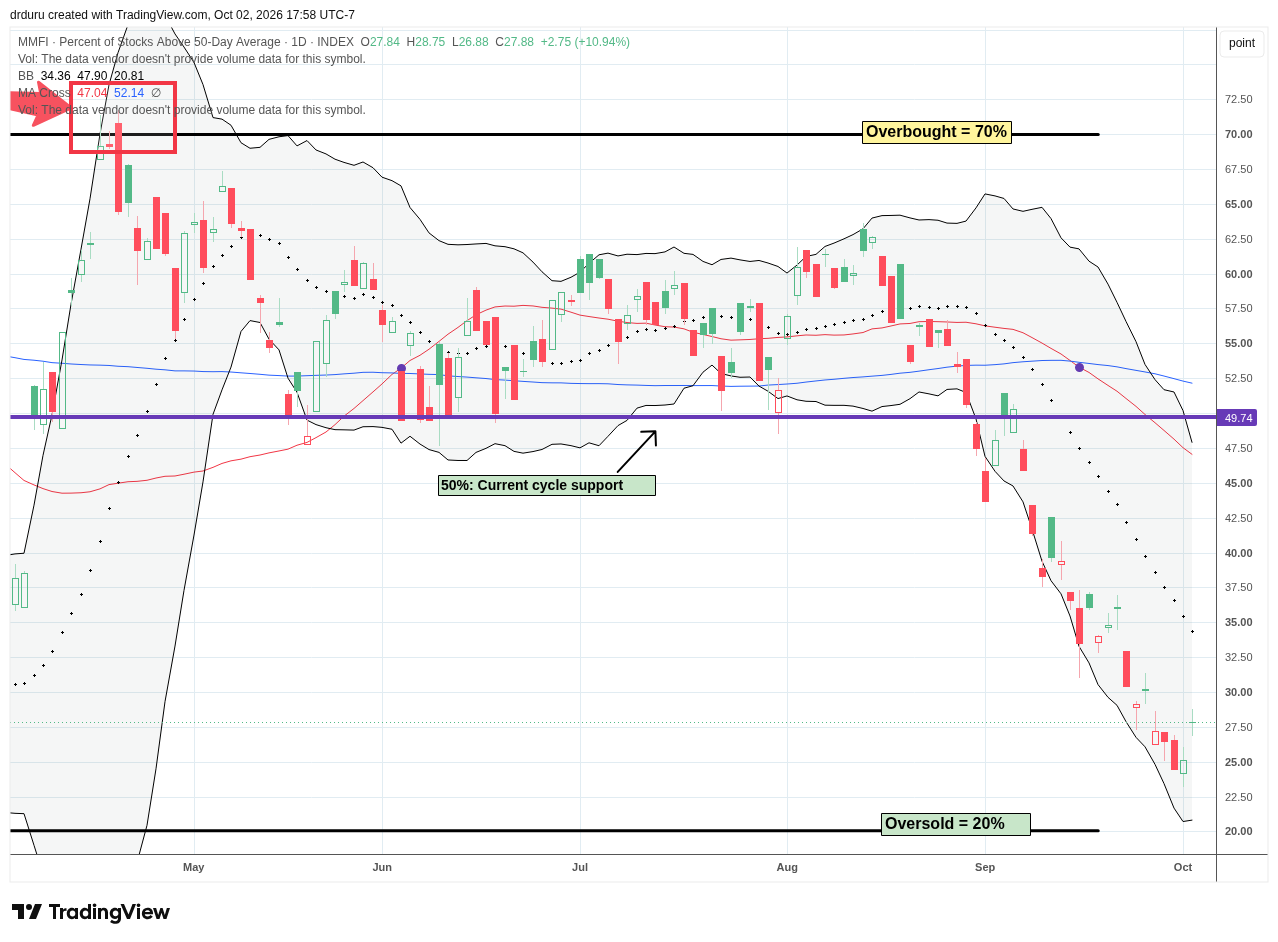
The evidence abounds for a bottom given both the S&P 500 and IWM confirmed critical support. A breakout for the NASDAQ could force the issue. However, AT200, the percentage of stocks trading above their respective 200DMAs, hit a new low for the year before Friday’s rebound. Like AT50, AT200 remains in a steep downtrend. So I need to see more lift from these important indicators of market health before I get comfortable assuming the market hit a “sufficient” bottom. Accordingly, I will flip the short-term trading call to cautiously bullish at that time.
In Case You Missed It…
One-Twenty Two focuses a lot on trading against extremes in the stock market. Last week presented various flavors of what to-do and not to-do in the face of extremes in individual stocks. My latest video short uses examples from Apple (AAPL), MongoDB (MDB), and Fair Isaac Corporation (FICO).
The Equities
iShares 20+ Year Treasury Bond ETF (TLT)
Description: The iShares 20+ Year Treasury Bond ETF tracks an index of U.S. Treasury bonds with remaining maturities greater than 20 years.
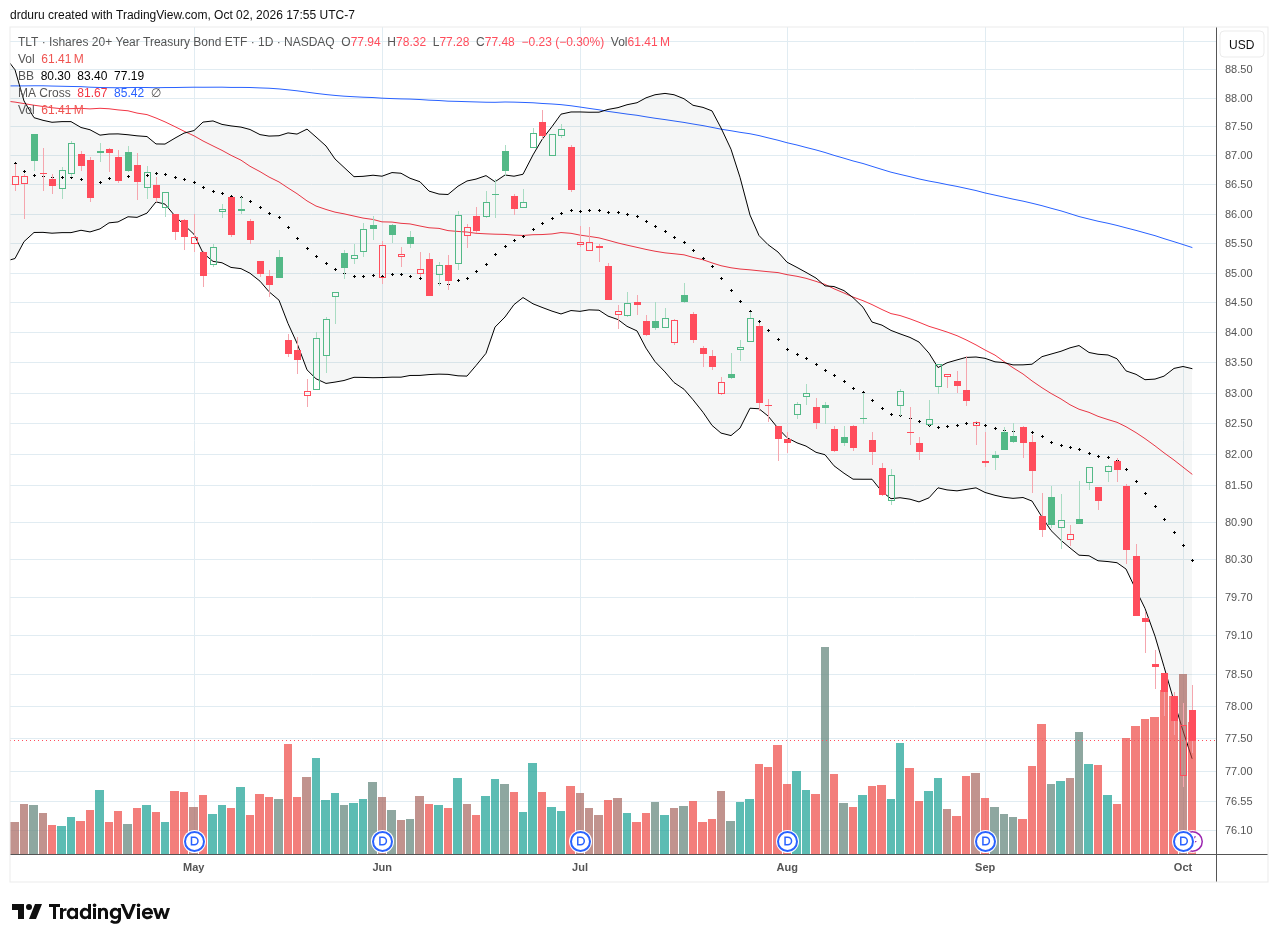
Technical Status: iShares 20+ Year Treasury Bond ETF (TLT) extended its downtrend alongside its lower Bollinger Band, reaching a new all-time low despite the weaker than expected jobs report.
Trade Commentary: Long-duration Treasuries remained at the center of the stock market’s breadth problem as yields pushed to multi-decade highs and TLT accordingly continued lower. The weak September jobs report initially relieved some of that pressure, with payrolls increasing only 29,000 and unemployment edging to 4.2%. However, the bond rally did not hold, and the 10-year Treasury yield rebounded toward 5.3% Friday. That rebound in bond yields adds to my doubts that last week’s bottom will hold, particularly for small caps and other rate-sensitive stocks.
Financial Select Sector SPDR Fund (XLF)
Description: XLF is an exchange-traded fund providing exposure to financial companies in the S&P 500.
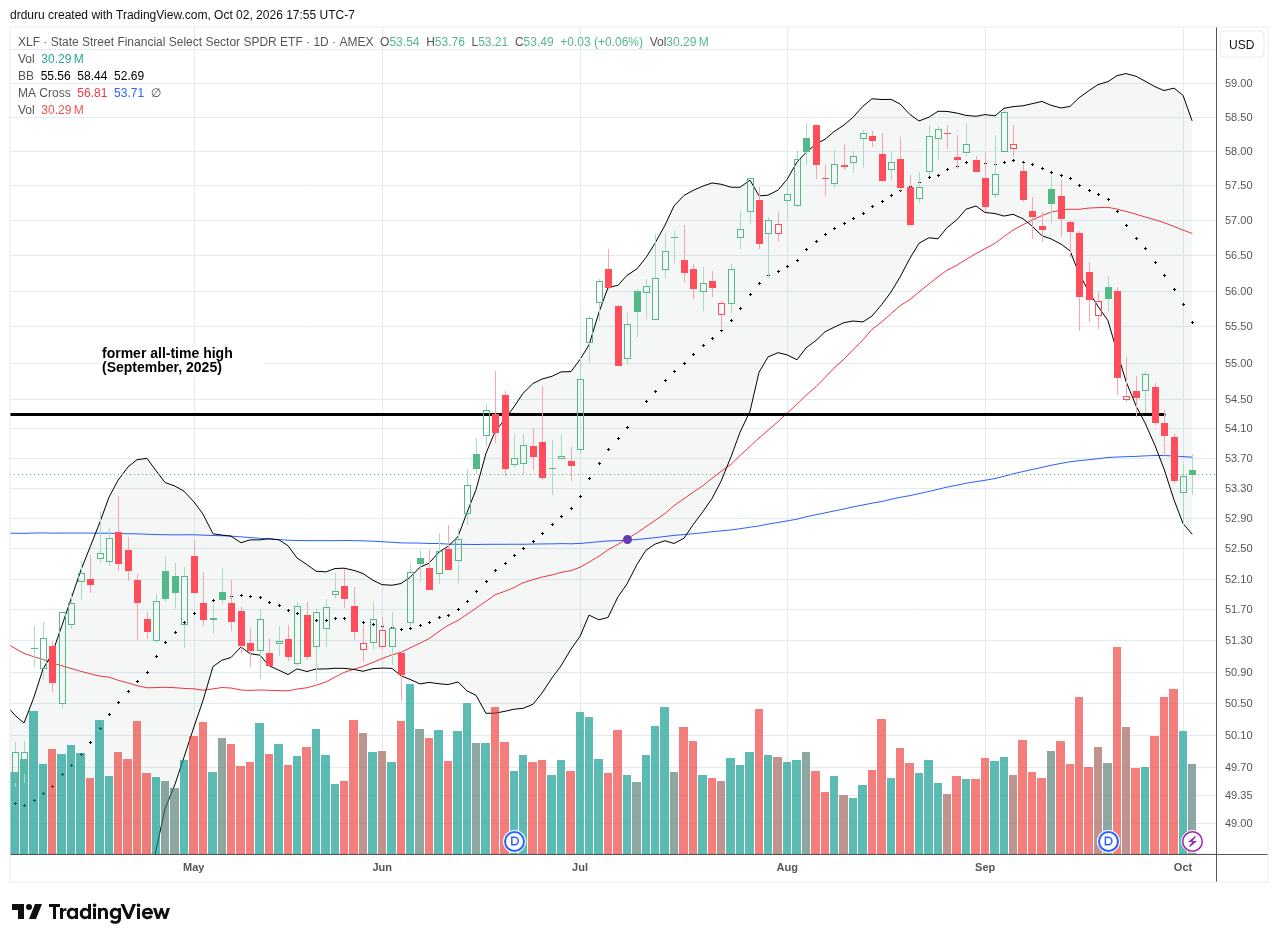
Technical Status: Financial Select Sector SPDR Fund (XLF) broke down below its 50DMA, continued declining and last week suffered a 200DMA breakdown.
Trade Commentary: Financials were one of several examples of deteriorating market breadth before Friday’s jobs report. XLF fell Monday and again Wednesday, extending a pullback that pushed its bearish positioning into a 200DMA breakdown. Certain financials within XLF look like they are in freefall. The jobs report offered some relief from expectations for another immediate Fed hike, but XLF gained only marginally Friday and 200DMA resistance held firm. Note that employment in the finance sector fell by 7,000 in September.
Industrial Select Sector SPDR Fund (XLI)
Description: XLI is an exchange-traded fund providing exposure to the industrial sector of the S&P 500.
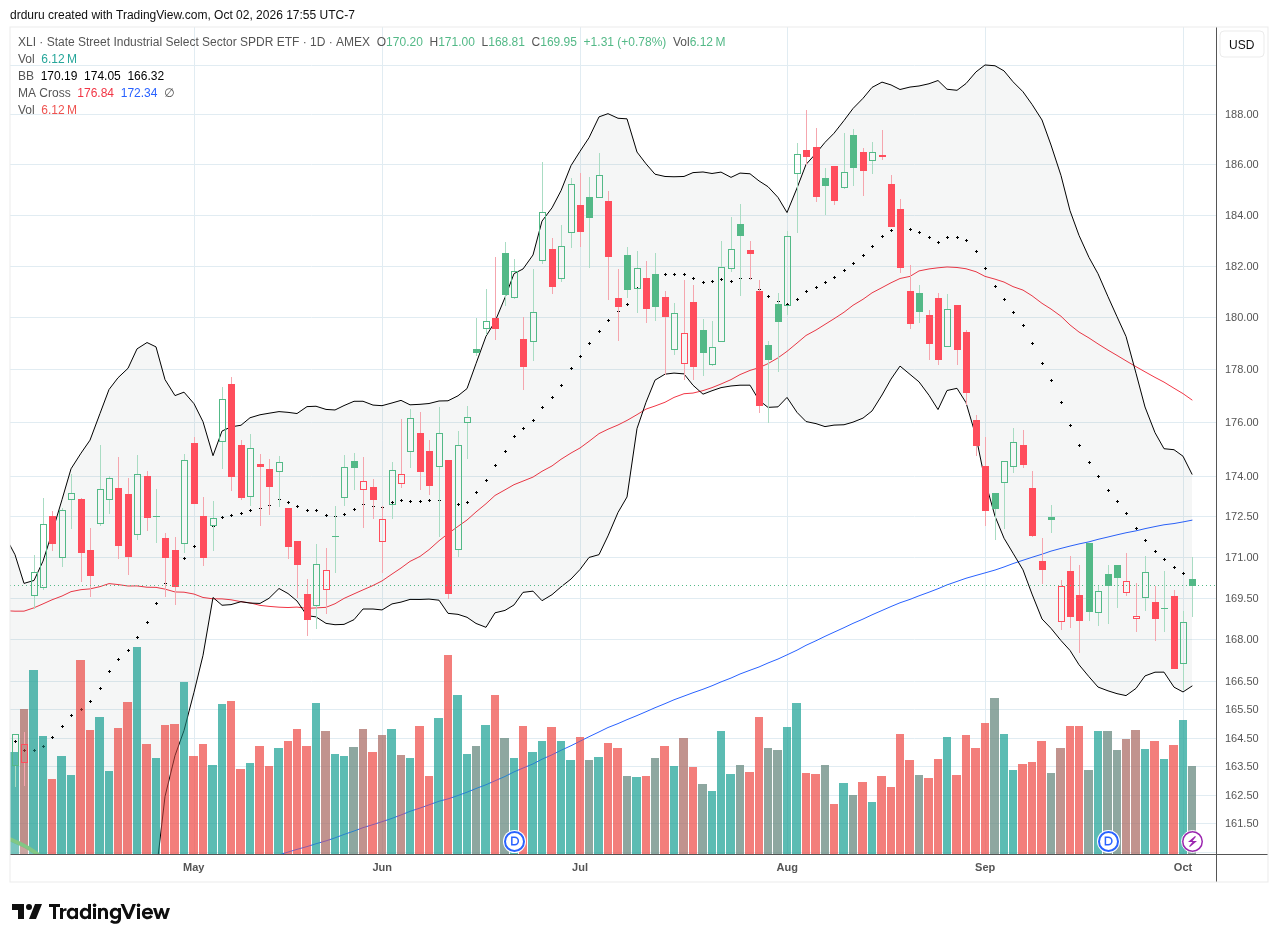
Technical Status: The Industrial Select Sector SPDR Fund (XLI) remains below its 200DMA after September’s downtrend defined by a declining 20DMA.
Trade Commentary: Industrials helped demonstrate that Friday’s relief rally extended beyond mega-cap technology. XLI gained 0.8% Friday after starting a bottoming process on Thursday. Construction and manufacturing employment both posted modest gains in the September jobs report even as overall payroll growth slowed sharply.
Caterpillar Inc. (CAT)
Description: Caterpillar manufactures construction and mining equipment, diesel and natural-gas engines, industrial gas turbines, and related products and services.
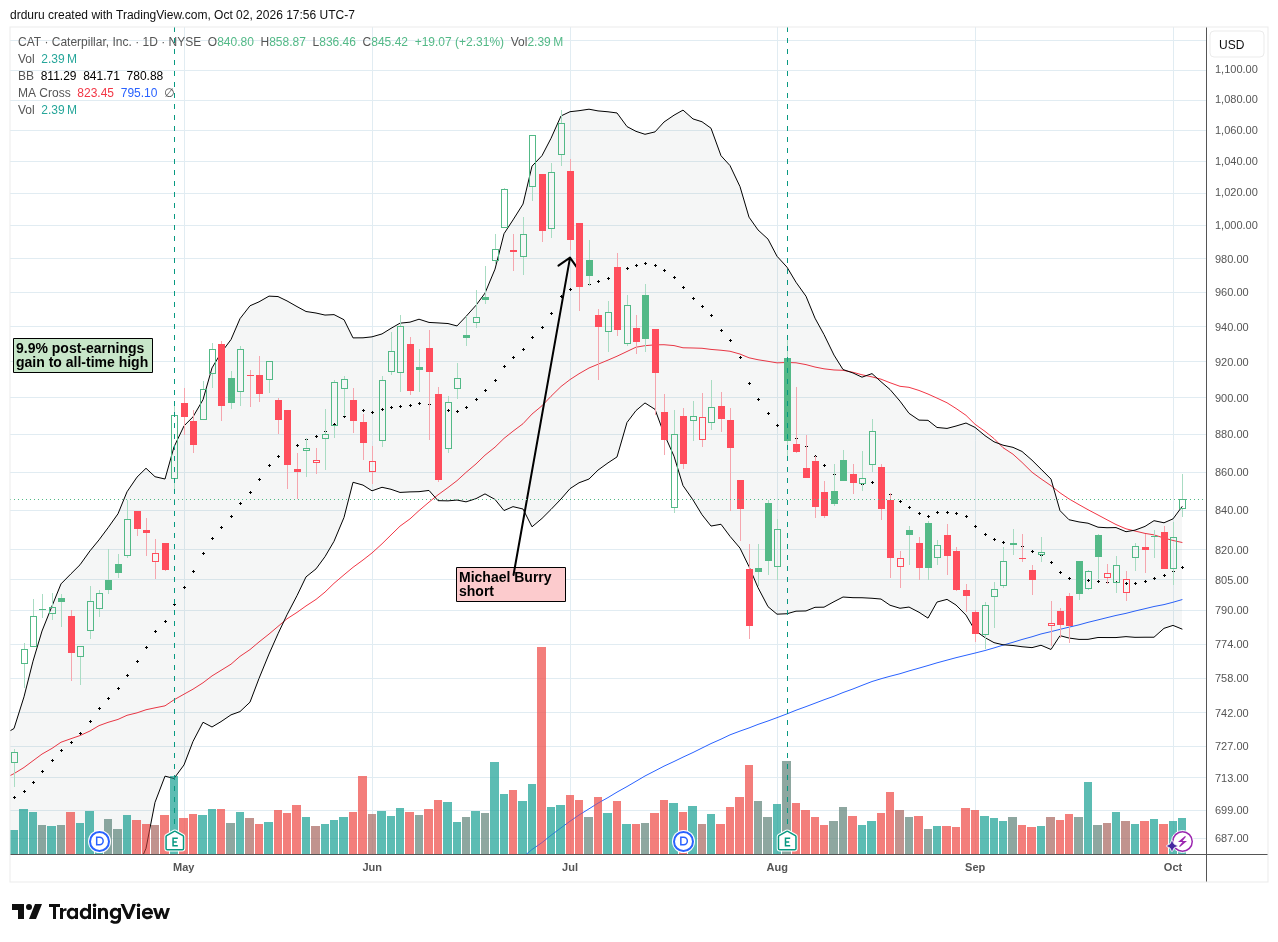
Technical Status: Caterpillar Inc. (CAT) broke out above its 50DMA and upper Bollinger Band, reversing much of its losses from the past few weeks and setting up a bullish resolution from a triangle or flag pattern.
Trade Commentary: CAT, XLI’s largest holding at a 7.1% allocation, enjoyed a potentially important breakout on Friday. CAT’s 20DMA and is finally turning upward with a confirmed and picture-perfect test of 200DMA support in the rear view mirror. The 50DMA breakout thus looks sustainable, especially coming out of a triangle or wedge or flag pattern. I wanted to buy call options or a call spread but the bid/ask spreads on CAT options are unacceptably high. So instead I bought a small amount of shares. I will add more shares if CAT tests 50DMA or even 20DMA support. CAT’s breakout scores a point for the case of a market bottom.
NVIDIA Corporation (NVDA)
Description: NVIDIA designs GPUs, accelerated-computing systems, networking products, and software used in artificial intelligence and other computing applications.
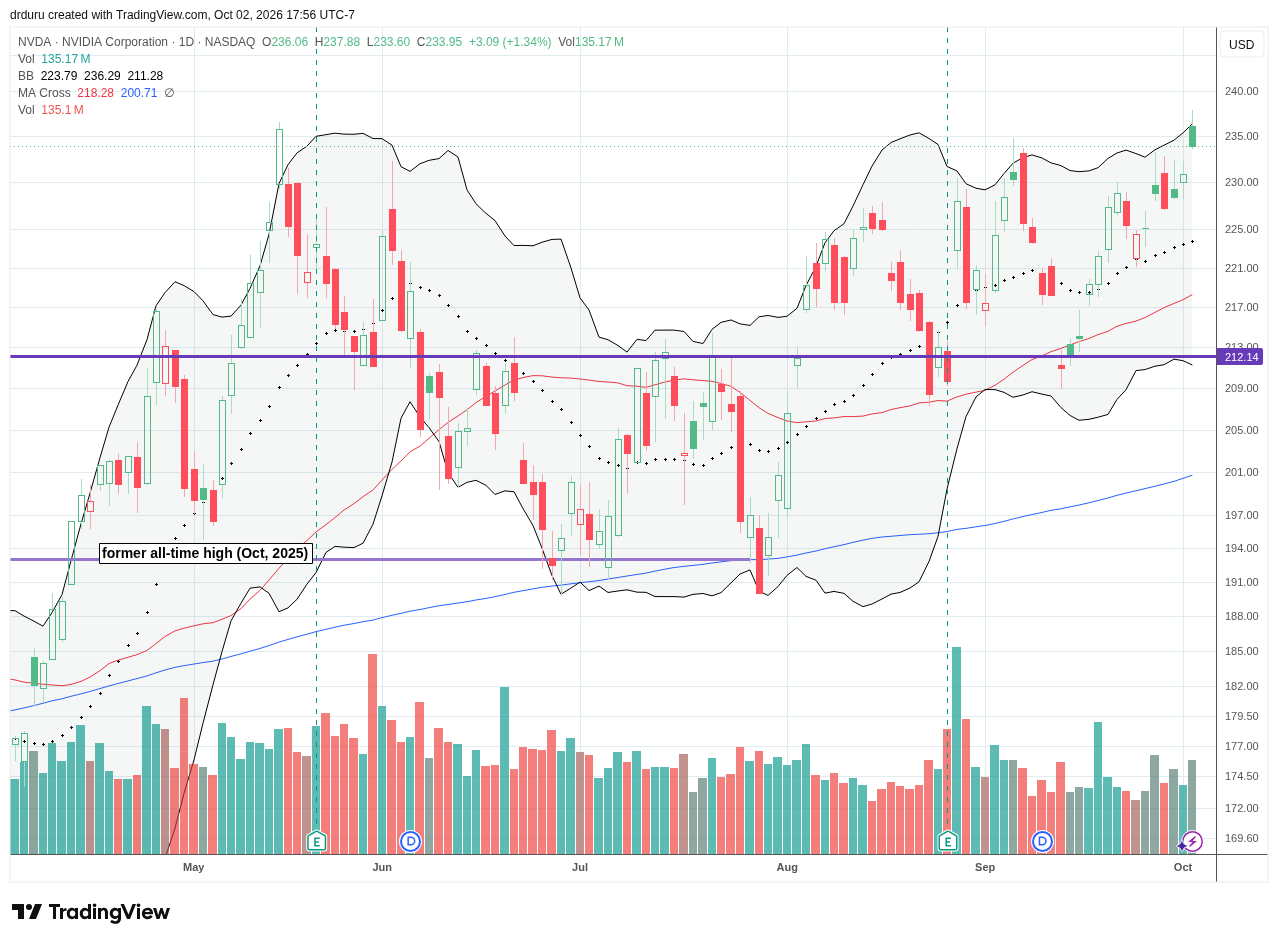
Technical Status: NVIDIA Corporation (NVDA) reached a fresh all-time high but faded slightly after hitting its upper Bollinger Band.
Trade Commentary: Last week started with NVIDIA announcing an increase in its share-repurchase authorization by $150 billion, bringing the remaining authorization to $235 billion through fiscal 2028. NVDA gained 1.7% that day despite declines across all four major U.S. indexes. Sellers came after NVDA on Tuesday for a small pullback. Buyers retained control all the way to a new intraday all-time high on Friday. The fade from the intraday high closed NVDA without a new closing all-time high. Still, like the NASDAQ, NVDA is now positioned for a larger breakout.
Credo Technology Group Holding Ltd (CRDO)
Description: Credo develops high-speed connectivity products used in data centers, artificial intelligence infrastructure, and networking systems.
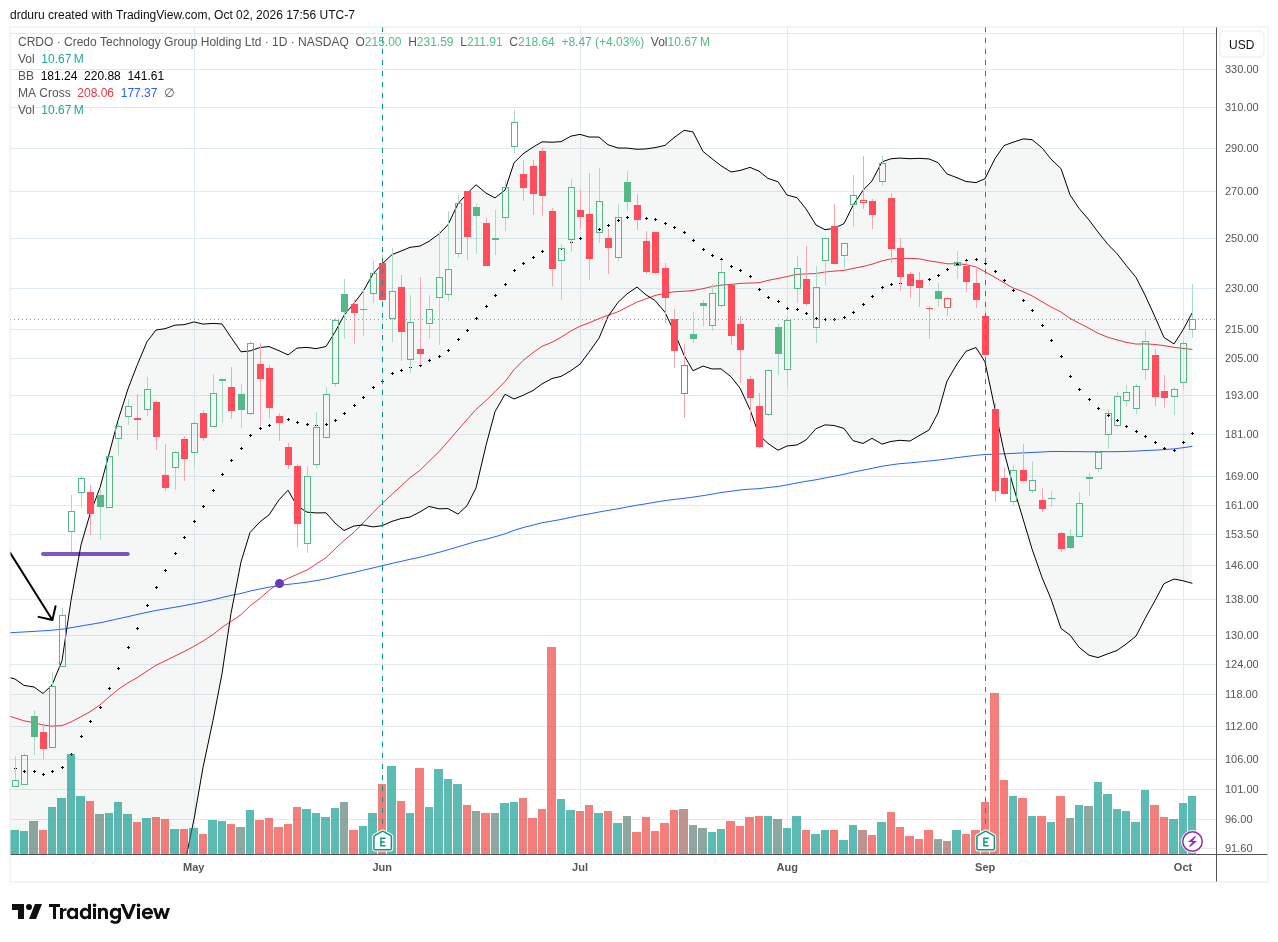
Technical Status: Credo Technology Group Holding Ltd (CRDO) completed a sharp recovery from its September low with a reversal of its post-earnings loss and a 50DMA breakout.
Trade Commentary: CRDO fell 8.7% Monday as rising yields pressured growth equities, then recovered from the failure at 50DMA resistance throughout the remainder of the week. CRDO gained 7.9% Thursday and another 5.1% Friday. The reversal over the course of the week and the resulting 50DMA breakout put CRDO back on my buy list.
Teradyne, Inc. (TER)
Description: Teradyne supplies automated test equipment for semiconductors and electronics and provides industrial automation products.
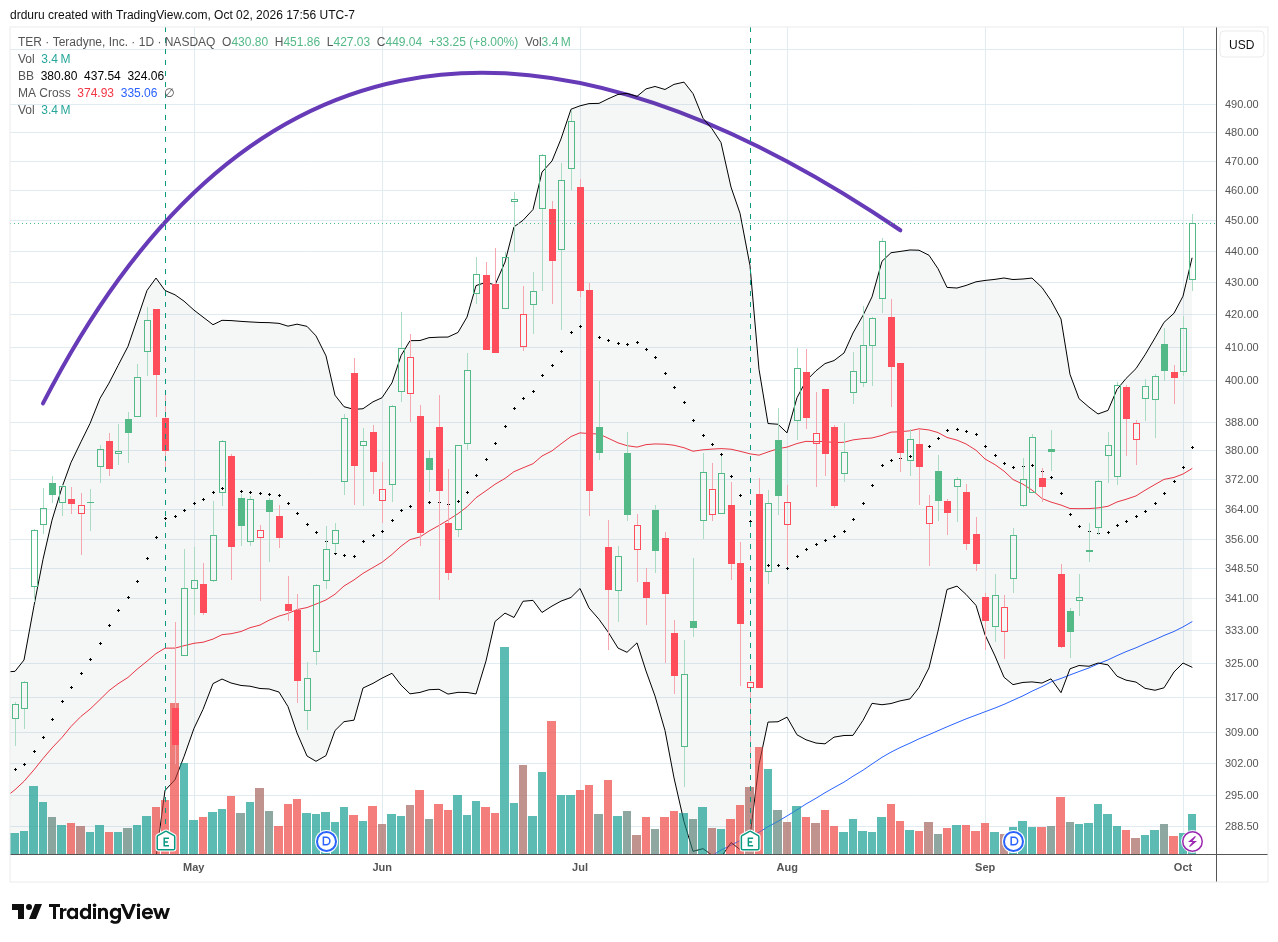
Technical Status: Teradyne, Inc. (TER) shot up from its September low all the way up to a point higher than August’s high, breaking out above its 50DMA and extending well above its upper Bollinger Band.
Trade Commentary: Two months ago I declared I was a buyer of TER on a 50DMA breakout. That breakout came and went without a trade. I missed a 10% gain interrupted briefly by a 50DMA breakdown. The pullback from that peak created a fresh case for a topping pattern (see the purple curve in the chart below). I missed an even better trading opportunity after TER streaked away from 200DMA support early last month. Last week’s fresh rush into AI-related stocks sent TER on another spurt higher. Despite being over-extended above its upper Bollinger Band, TER invalidated its topping pattern and is positioned to challenge its all-time high.
Applied Materials, Inc. (AMAT)
Description: Applied Materials supplies equipment, services, and materials-engineering technologies used to manufacture semiconductors and displays.
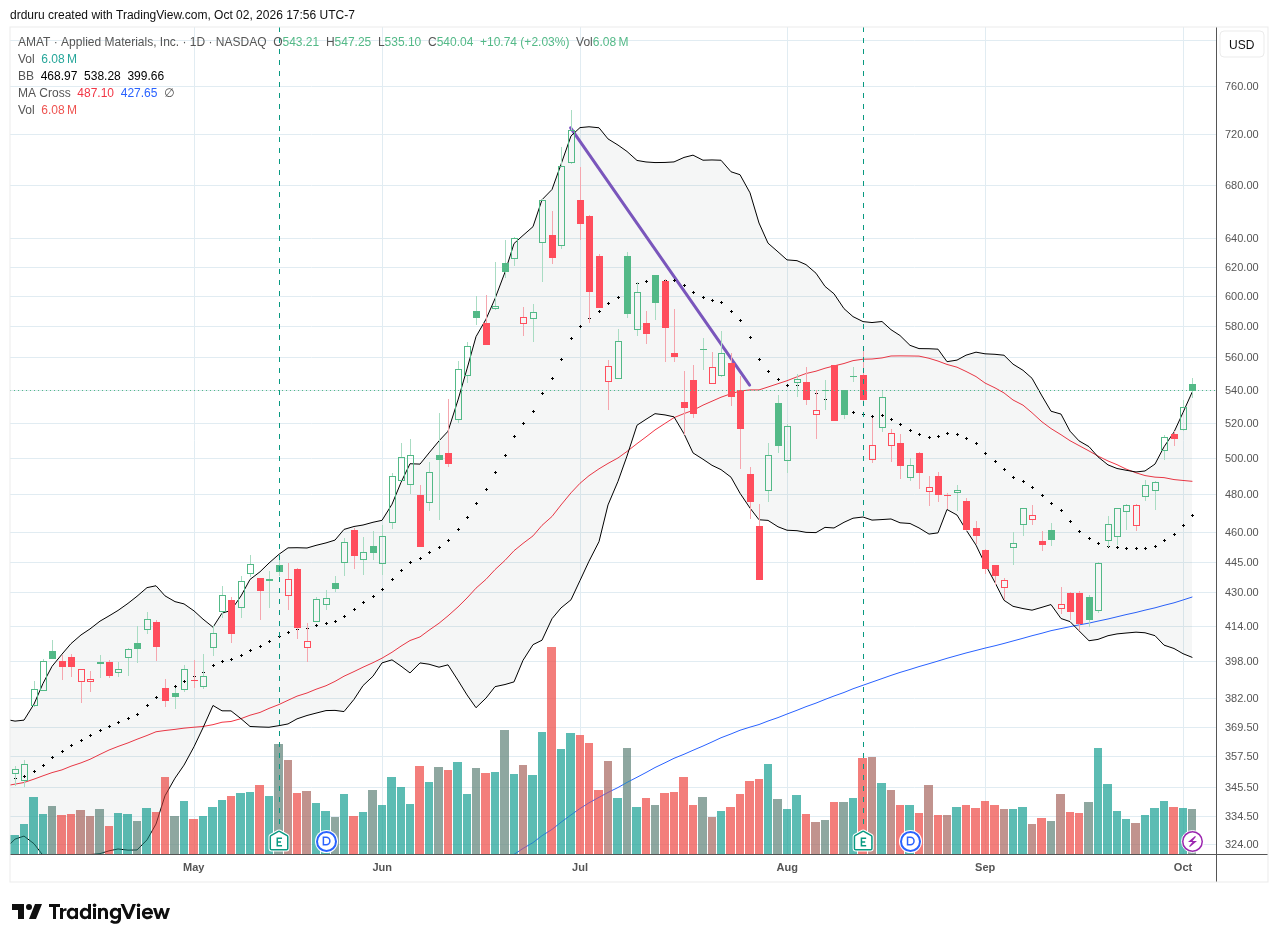
Technical Status: Applied Materials, Inc. (AMAT) perfectly rebounded off of its 200DMA, ending a multi-month downtrend. The rally continues with a 50DMA breakout and rise along its upper Bollinger Band.
Trade Commentary: Last month I made the case for adding to my AMAT shares on the stock’s test of 200DMA support. AMAT gapped above its 20DMA resistance the very next trading day and never looked back. The stock did not even hesitate at 50DMA resistance. AMAT now looks ready to go on a run to challenge its all-time high if the NASDAQ cooperates with a breakout.
Accenture plc (ACN)
Description: Accenture provides consulting, technology, operations, and digital transformation services to organizations worldwide.
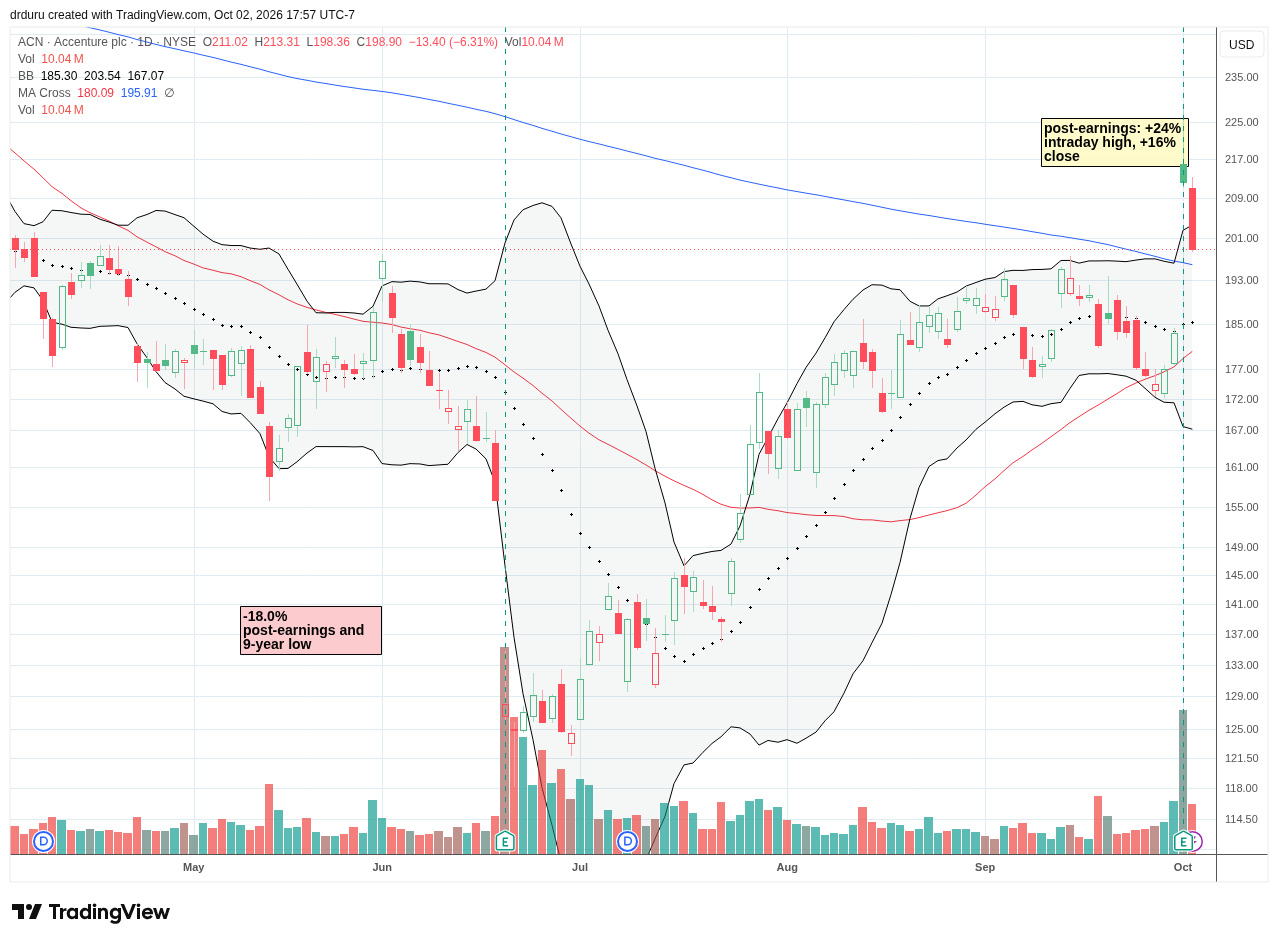
Technical Status: Accenture plc (ACN) gave back 6.3% following its post-earnings surge. Its 200DMA breakout remains intact for now.
Trade Commentary: Last month, I made a timely purchase of ACN shares. Shares jumped 15.8% Thursday after fiscal fourth-quarter results exceeded expectations and management projected fiscal 2027 revenue growth of 3% to 6%. The report provided evidence that demand for consulting around AI implementation remains intact, but the results were overall lukewarm. So once the stock started fading from its intraday high, I decided to take profits. Friday’s 6.3% pullback validated my reading of the fade as a warning signal. Now, I am watching to see whether 200DMA support holds and sets up a fresh buying opportunity.
CarMax, Inc. (KMX)
Description: CarMax operates a nationwide used-vehicle retail and wholesale business and provides related financing and automotive services.
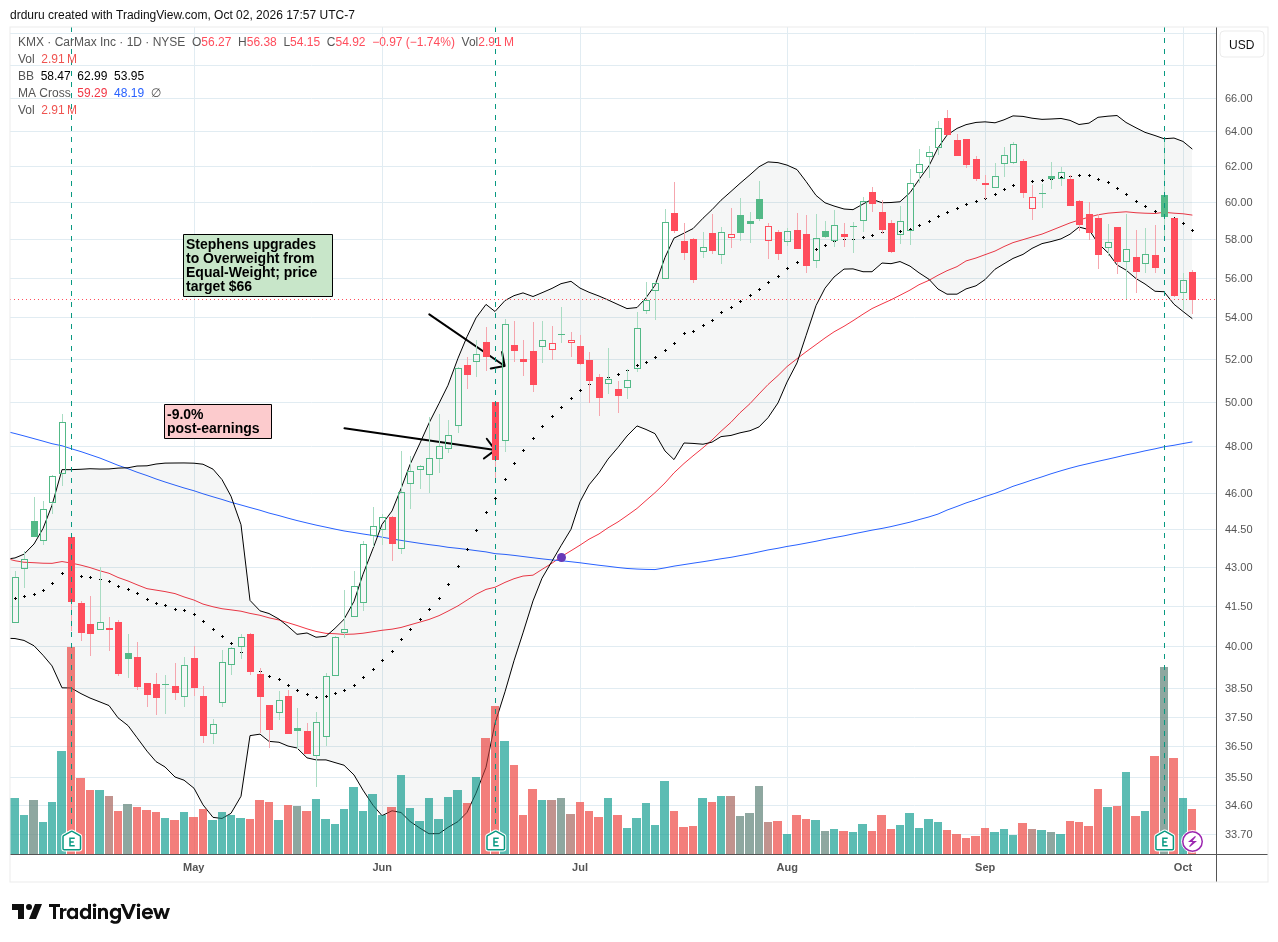
Technical Status: CarMax, Inc (KMX) quickly transformed a post-earnings gain and breakout into a complete reversal and confirmed 50DMA breakdown.
Trade Commentary: A week ago I explained why I took profits on my KMX position ahead of earnings. By Friday, the stock fully validated my concerns. After rallying 4.7% post-earnings on Tuesday, a fade that started right under the year’s high (set in August) accelerated into a fresh 50DMA breakdown on Wednesday. KMX closed the week at a 3-month low. The company reported second-quarter revenue growth of 19.5% and a 13% increase in comparable-store used-unit sales. Retail used-unit sales increased 13.8%, while combined retail and wholesale unit volume rose 14.7%. The company also announced plans to resume share repurchases during the third quarter. The fade and continued selling despite this news are, to me, a harbinger of steeper losses to come.
Fair Isaac Corporation (FICO)
Description: Fair Isaac develops analytics software and credit-scoring products, including the widely used FICO credit scores.
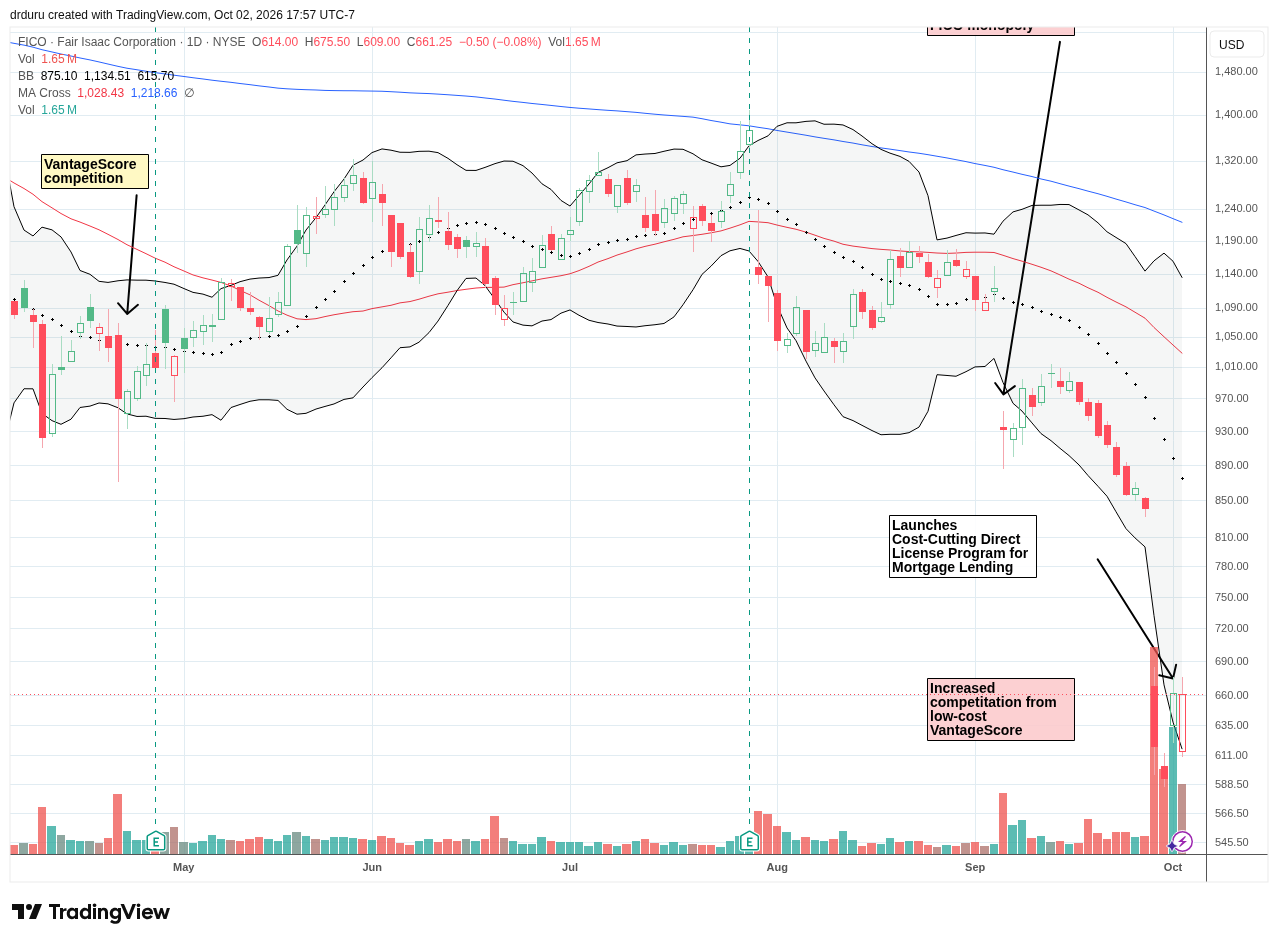
Technical Status: After collapsing 26.5% in the wake of competitive news, Fair Isaac Corporation (FICO) started a comeback with a competitive response and 11.7% surge.
Trade Commentary: FICO remains trapped in a negative news cycle where the market continues to under-appreciate the company’s competitive peril while experiencing quick bursts of hope on the occasional interruption in the bad news. The stock plunged 26.5% Tuesday after FHFA Director Bill Pulte posted on X that “We are Simplifying Mortgage Pricing following feedback from lenders and consumers. Instead of two separate pricing grids, which makes zero sense, Fannie (FNMA) and Freddie (FMCC) are hereby moving to one pricing grid with VantageScore joining the existing FICO Classic pricing grid.” This additional competitive pressure is a natural extension of Pulte’s complaints, warnings, and actions since last year. So the market sold FICO on the same, but worsening, news. Wall Street is capitalist, but it loves a monopoly and big moats. Fair Isaac’s mortgage-scoring moat now looks dramatically weaker.
FICO fell another 4.1% Wednesday and closed at a 3-1/2 year low. With the stock well over-extended below its lower Bollinger Band, the company’s press release on Thursday announcing “new direct-to-reseller license approach streamlines score access, saving lenders up to 50% on per score FICO fees” sent the stock soaring 11.7%. This concession to competitive pressures will likely show up in lower financial performance in coming quarters. So I was not surprised to see the stock gap lower on Friday. The ability for the stock to close the day flat is impressive. So I am now on watch for a technical trade on a continued bounce from oversold conditions. The trade triggers on a close above Tuesday’s intraday high at $685.
DoorDash, Inc. (DASH)
Description: DoorDash operates a local-commerce platform connecting consumers with restaurants, grocery stores, retailers, and delivery providers.
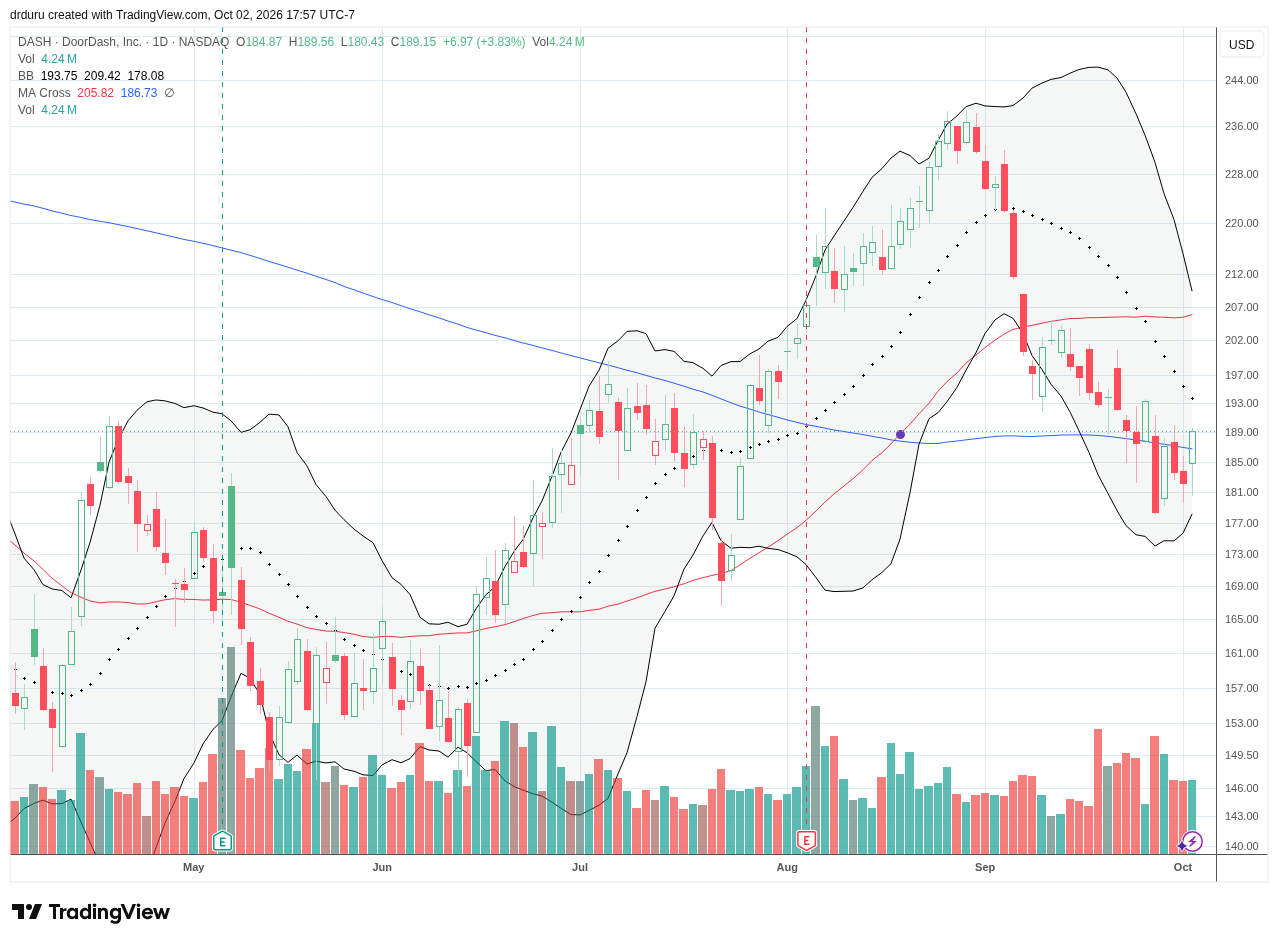
Technical Status: DoorDash, Inc. (DASH) continues to struggle to hold onto 200DMA support.
Trade Commentary: After DASH sliced through 50DMA support last month, the stock confirmed market breadth’s latest warning. The downward momentum seemed set to resume with Monday’s 7.7% loss. However, the next day buyers reversed Monday’s loss, and the stock ended the week clutching at its 200DMA. DASH looks positioned for an extended trading range between July’s low and overhead 50DMA resistance.
Roblox Corporation (RBLX)
Description: Roblox operates an online platform where users create, publish, and interact with immersive games and virtual experiences.
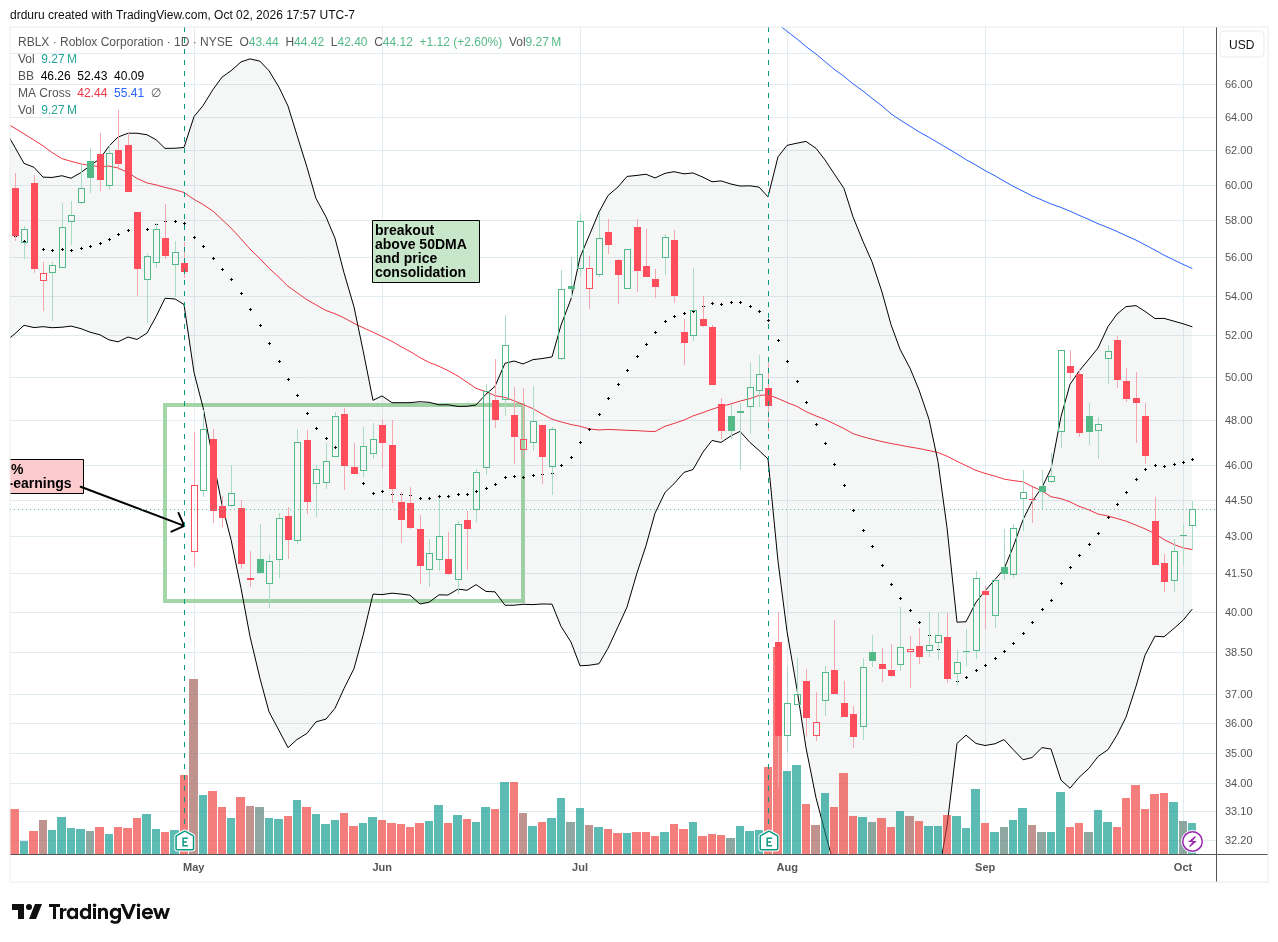
Technical Status: Roblox Corporation (RBLX) recovered from a 50DMA breakdown as it tries to repair the latest technical damage.
Trade Commentary: Roblox began the week with a 9.9% decline after Jefferies downgraded the stock to Underperform and maintained a $38 price target. The firm questioned whether bookings growth could justify the optimism that followed Roblox’s second-quarter report. Shares declined again Tuesday before recovering Wednesday and Thursday. The rebound was strong enough to confirm a fresh 50DMA breakout and to start chipping away at Monday’s gap down.
Jabil Inc. (JBL)
Description: Jabil provides engineering, supply-chain, design, and manufacturing services for customers across electronics and other industries.
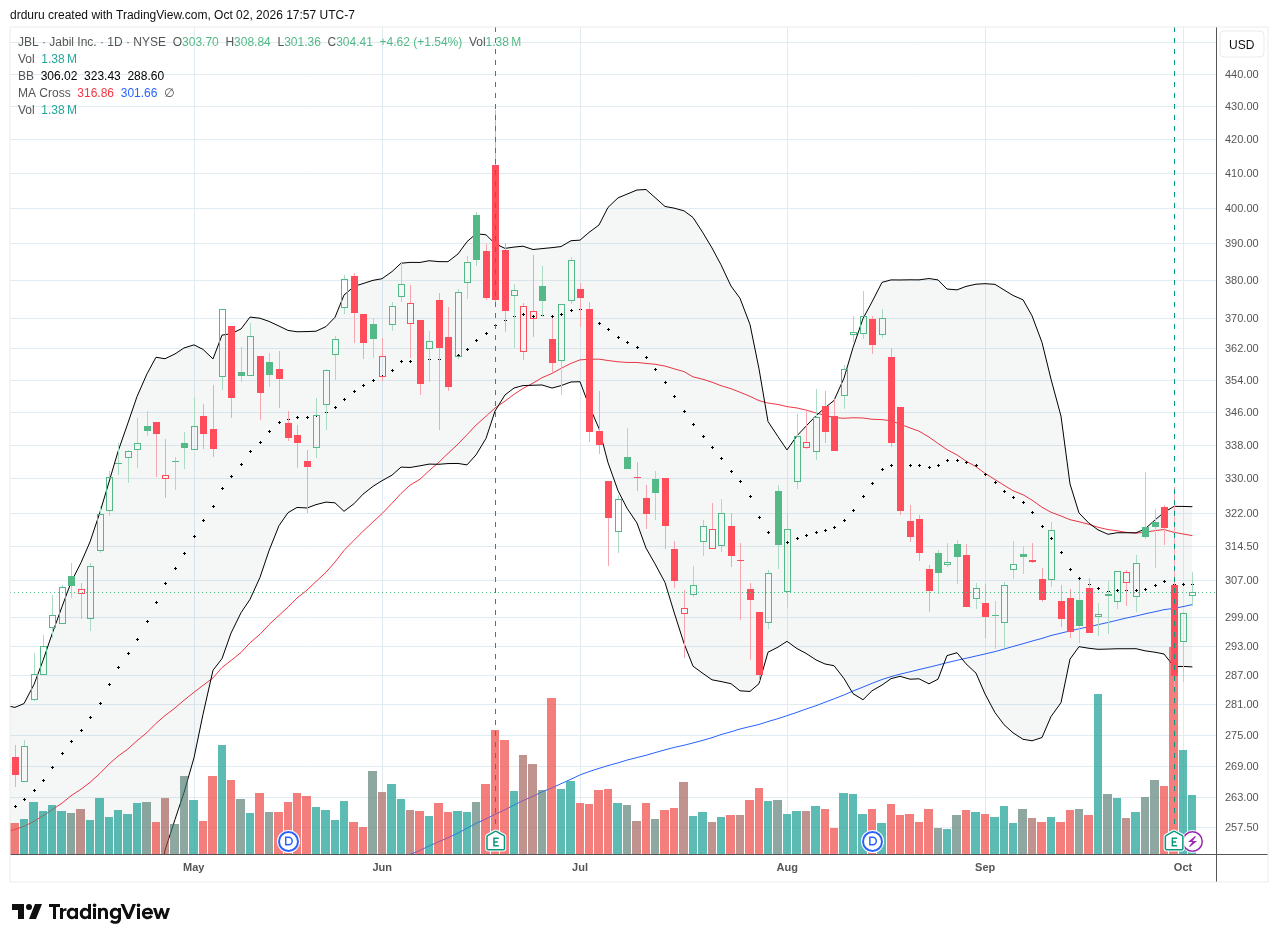
Technical Status: Jabil Inc. (JBL) started a recovery from a 10.0% post-earnings breakdown with a 200DMA breakout.
Trade Commentary: Jabil reported fiscal fourth-quarter results Wednesday with revenue of $10.6 billion and said fiscal 2026 revenue increased 21% as AI infrastructure demand contributed to growth. Management also issued a reportedly strong fiscal 2027 outlook. The stock nevertheless fell 10% on the earnings day. The plunge set up fresh buying interest for the last two days of the week. Given JBL has an apparent tenuous hold on 200DMA support, I see substantial risk of a downside resolution of the triangle/wedge/flag pattern seen best with the downtrending 50DMA and uptrending 200DMA.
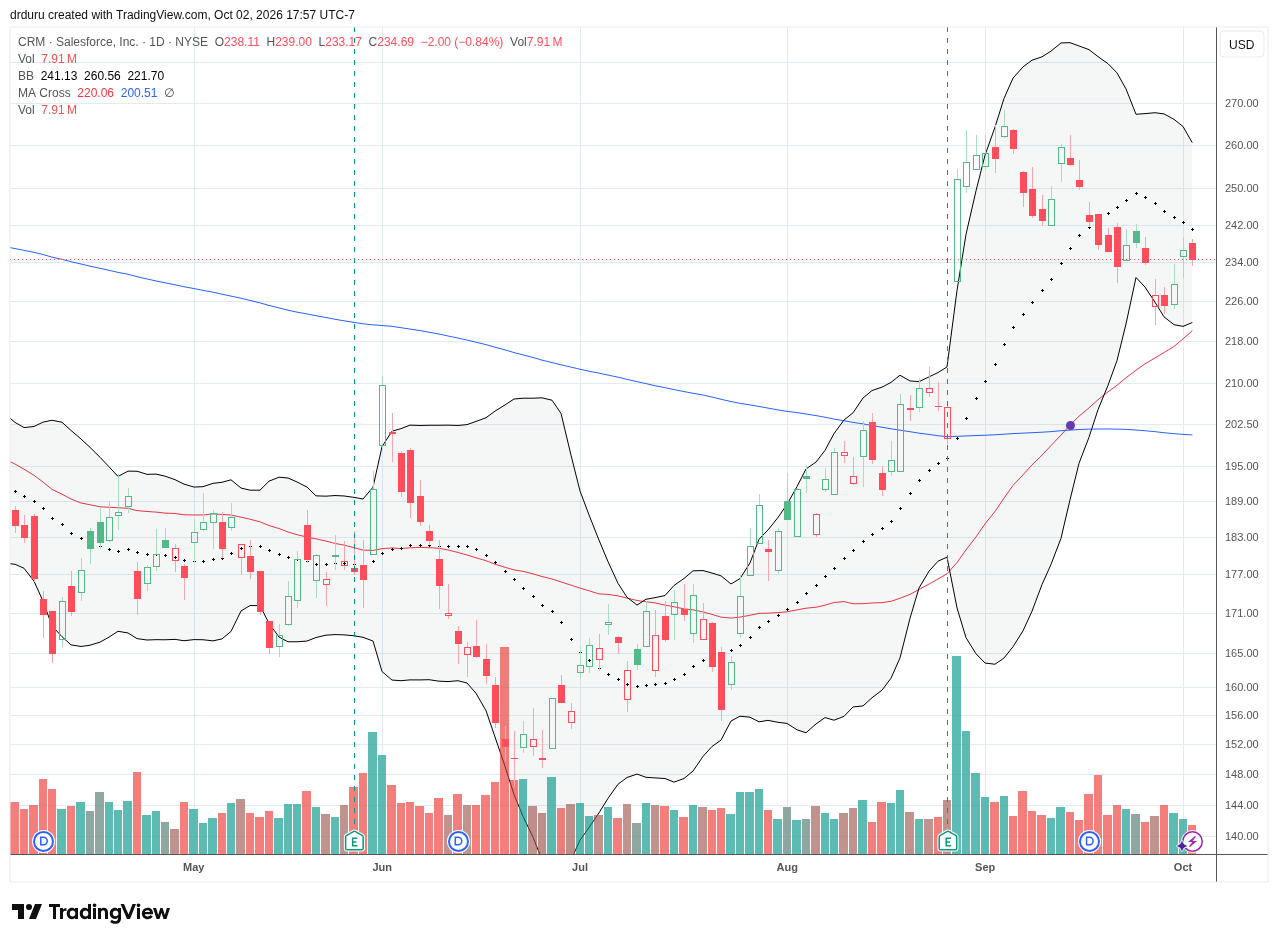
Salesforce, Inc. (CRM)
Description: Salesforce provides cloud-based customer relationship management, data, analytics, and artificial intelligence software for businesses.
Technical Status: Salesforce, Inc. (CRM) stopped short of a test of 50DMA support but still has to contend with downtrending 20DMA resistance.
Trade Commentary: CRM fell 2.9% Monday and recovered by the end of the week. The roundtrip occurred within a stone’s throw of 50DMA support, but downtrending 20DMA resistance looms directly overhead. If I did not already own enough CRM shares I would start buying after a rebound directly off 50DMA support.
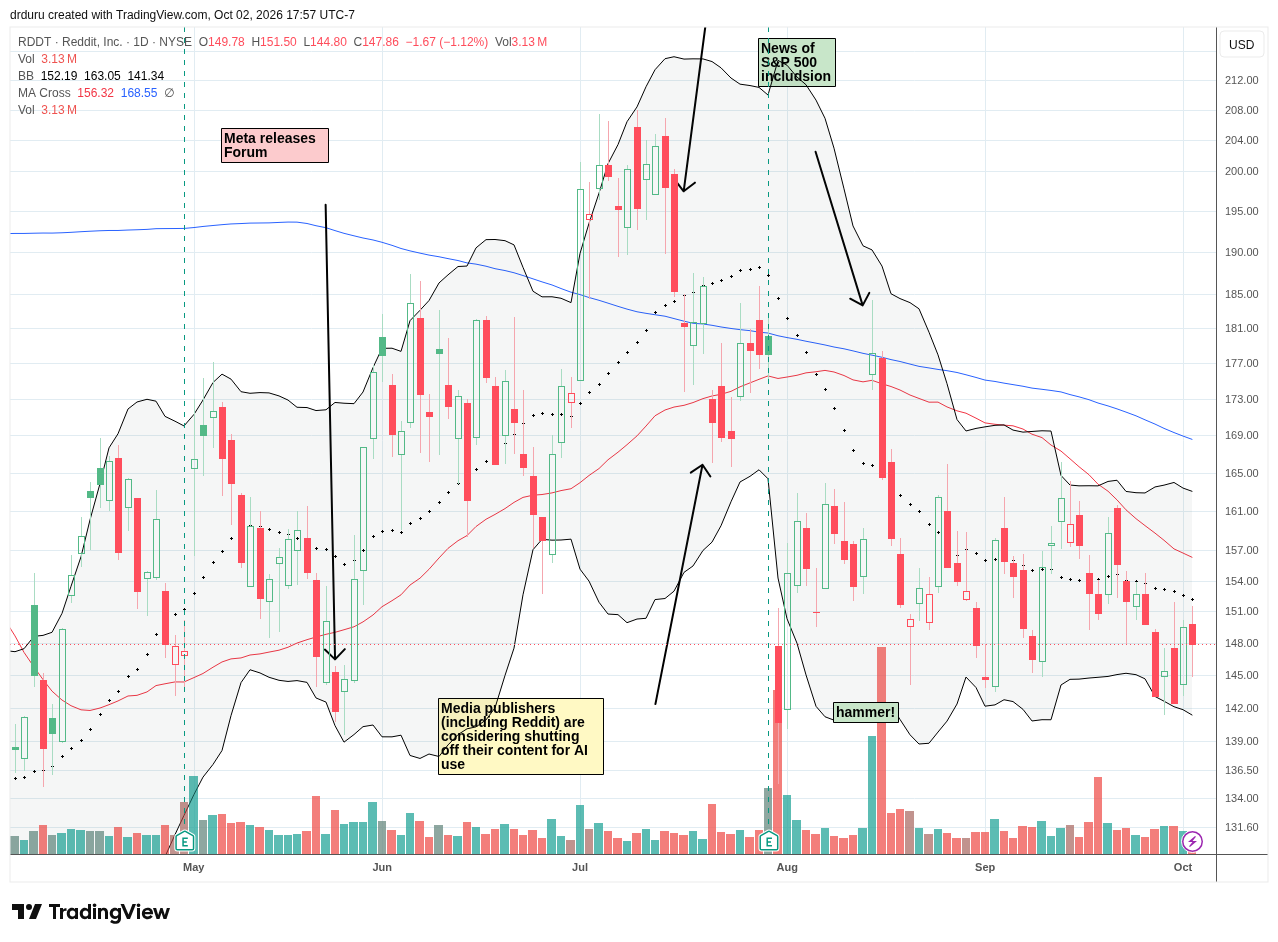
Reddit, Inc. (RDDT)
Description: Reddit operates an online community platform organized around user-created forums and monetized primarily through advertising and related services.
Technical Status: Reddit, Inc (RDDT) is holding on to support around $142, but downtrending 50DMA resistance looms ever larger.
Trade Commentary: RDDT is stuck in a trading range bracketed by August’s pre-earnings close and post-earnings close. The closing low from that 21.0% post-earnings plunge has held as support even as RDDT repeatedly fails to break through its 50DMA resistance. I keep looking for a new entry, but the sagging 50DMA resistance makes RDDT look vulnerable to an imminent breakdown.
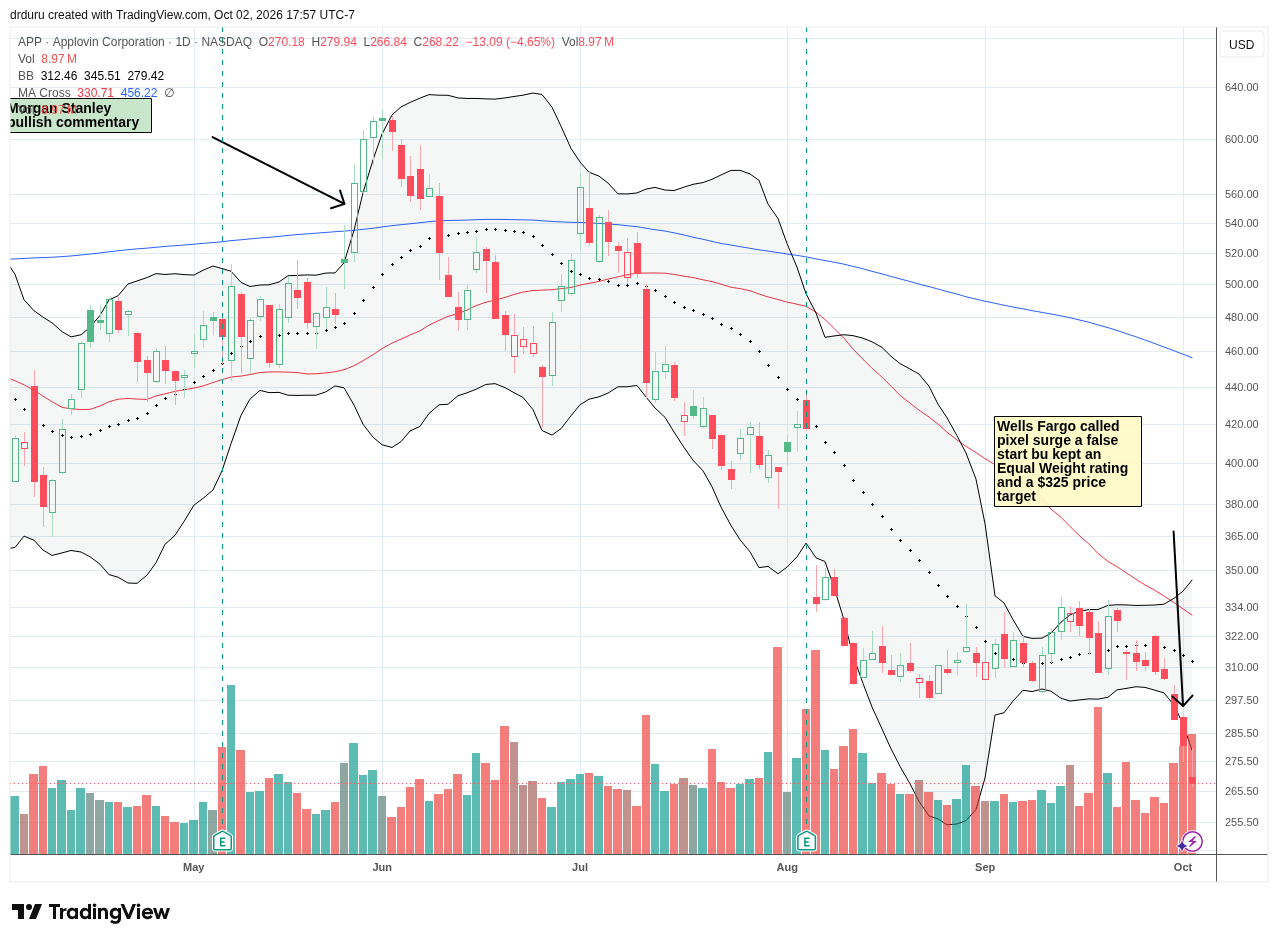
AppLovin Corporation (APP)
Description: AppLovin provides advertising technology and software used by businesses to market, monetize, and grow mobile applications and other digital products.
Technical Status: AppLovin Corporation (APP) plunged to 17-month lows amid negative Wells Fargo commentary.
Trade Commentary: APP fell throughout the week, including a 3.1% decline in reaction to negative commentary from Wells Fargo. While the analyst held APP at an equal weight rating and $325 target, the stock continued downward with a 4.7% loss on Friday. At $268/share, APP now has an implied 21% upside from here. I went into the week bearish on APP, but missed the trade. I bought shares on Thursday with the intention of waiting out a rebound to at least $325. Overall, analysts are overwhelmingly positive on APP with price targets as high as $790. Wells Fargo has the lowest price target. Something has to give soon; either APP is about to suffer an onslaught of downgrades or the stock will turn around with a furious comeback rally. I hope tensions get resolved ahead of the November 11 earnings announcement.
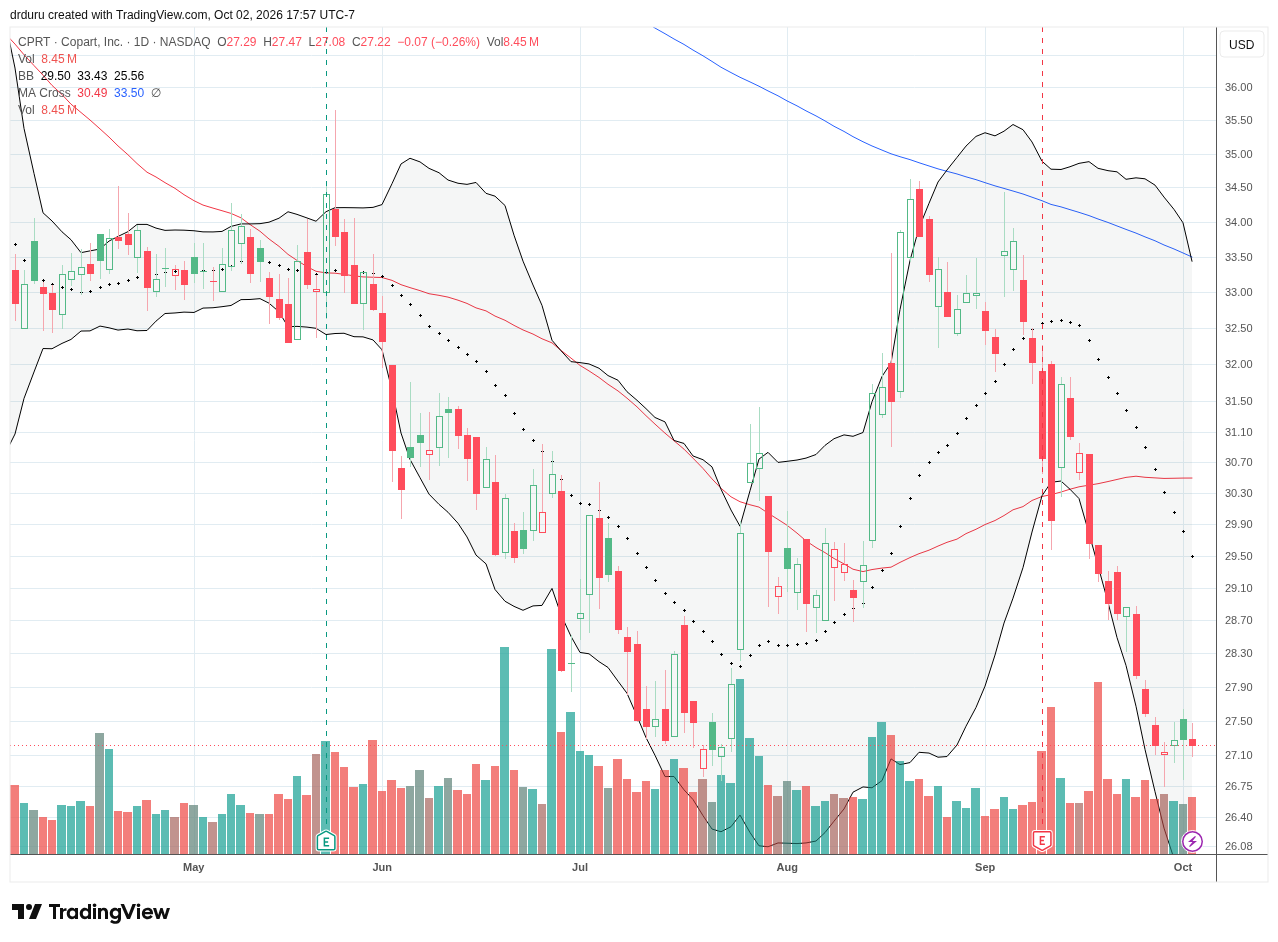
Copart, Inc. (CPRT)
Description: Copart operates online vehicle auctions and provides vehicle remarketing and related services primarily for insurers, dealers, and other vehicle sellers.
Technical Status: Copart, Inc. (CPRT) is finally stabilizing after a downtrend from 200DMA resistance took the stock nearly straight down to its lows of the year.
Trade Commentary: In mid-August I laid out a hedged options trade on CPRT. The call options expired worthless. The December put options are deep in the money, but I am considering taking profits this coming week and calling the trade a draw. CPRT has fallen steeply alongside the sell-off in bonds, but last week the stock stabilized for the first time during this sell-off. The stock conveniently paused right at its low of the year. Thus, only a fresh breakdown this week will keep me in my bearish position.
MGM Resorts International (MGM)
Description: MGM Resorts International owns and operates casino resorts, hotels, entertainment venues, and gaming businesses in the United States and internationally.
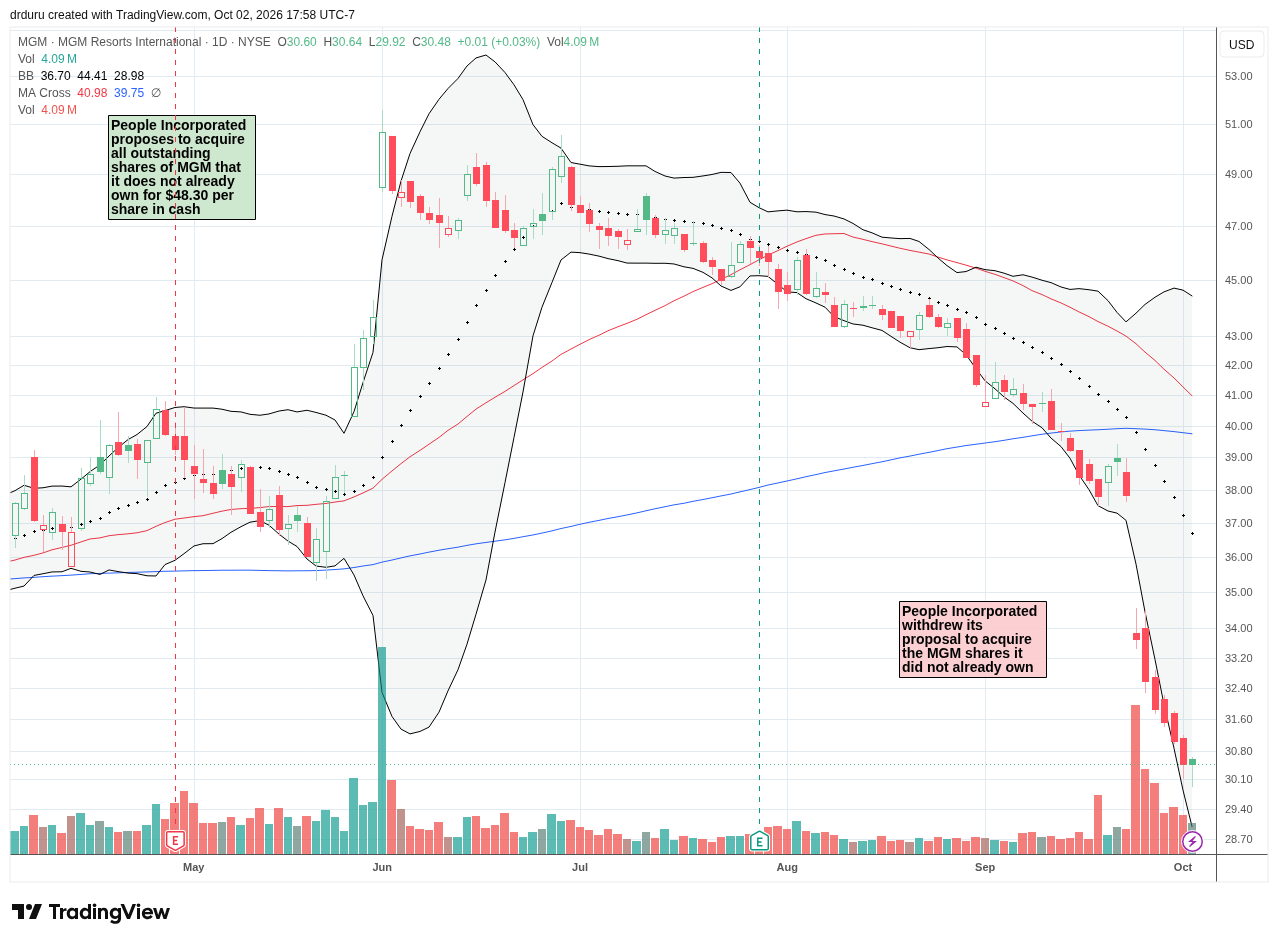
Technical Status: Sellers continued to batter MGM Resorts International (MGM) after it lost support from an acquisition bid.
Trade Commentary: A week ago, I made the case for catching the falling knife in MGM. The stock sold off further last week with buyers finally making a tepid showing on Friday. While I do not fully understand the ongoing panic in shares, I am increasingly convinced that I need to stay the course for at least the short-term. The stock is even further below its price before the acquisition bid. The 11-month low seems way overdone. I profited from a similar scenario with BILL Holdings, Inc (BILL).
Whirlpool Corporation (WHR)
Description: Whirlpool manufactures and markets major home appliances and related products under multiple consumer brands.
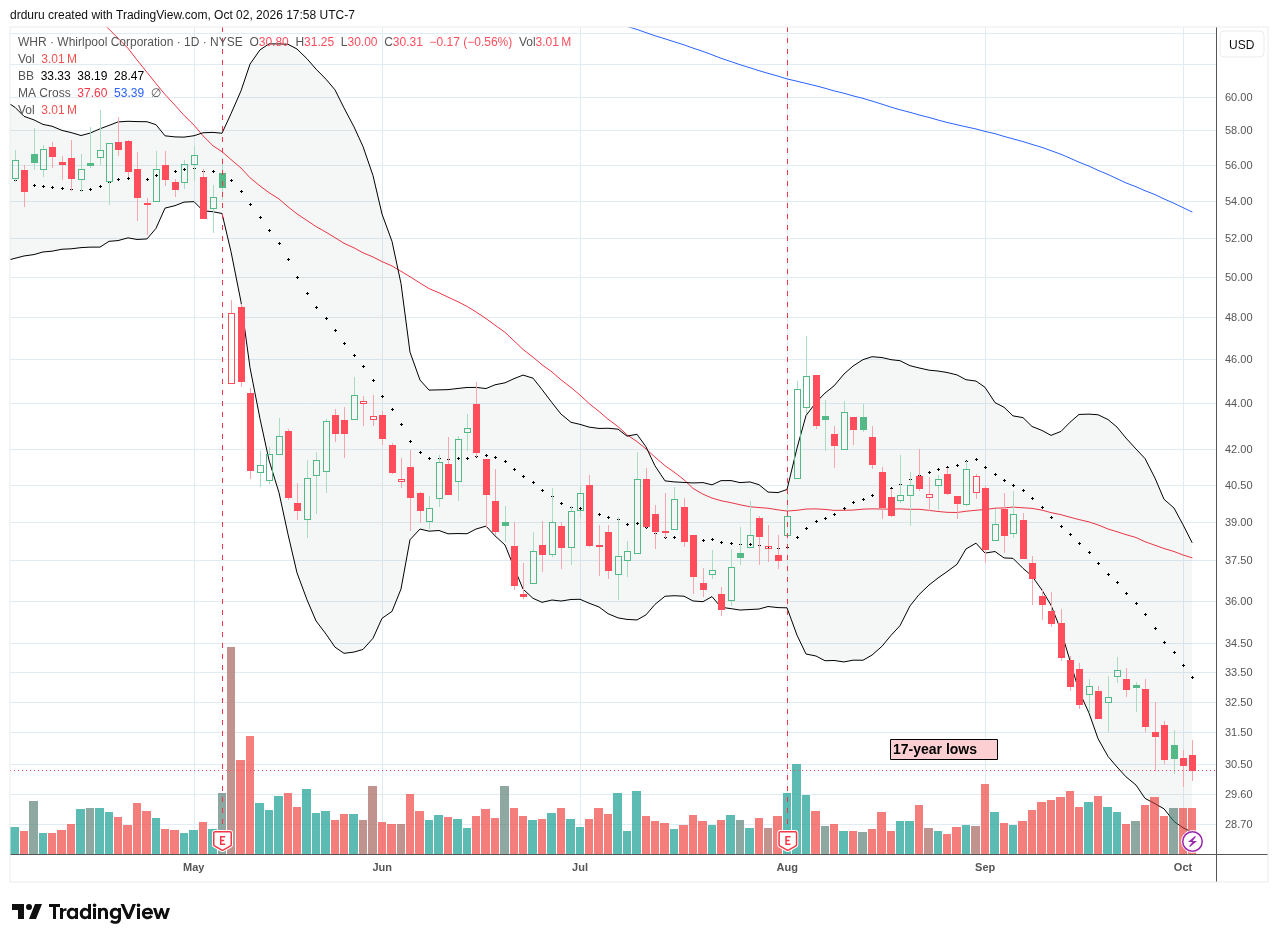
Technical Status: August’s post-earnings excitement quickly wore off for Whirlpool Corporation (WHR). The stock now trades at 17-year lows.
Trade Commentary: Whirlpool is suffering from the double whammy of a weak housing market and weakness for consumer-facing products in general. A high debt load makes this stock particularly unattractive as interest rates keep going higher. At a 17-year low, I still have no interest in bargain shopping here. However, I keep checking in to see whether any “green shoots” of good news show up.
United States Oil Fund (USO)
Description: USO is an exchange-traded commodity pool designed to reflect daily movements in the price of light sweet crude oil through oil-futures exposure.
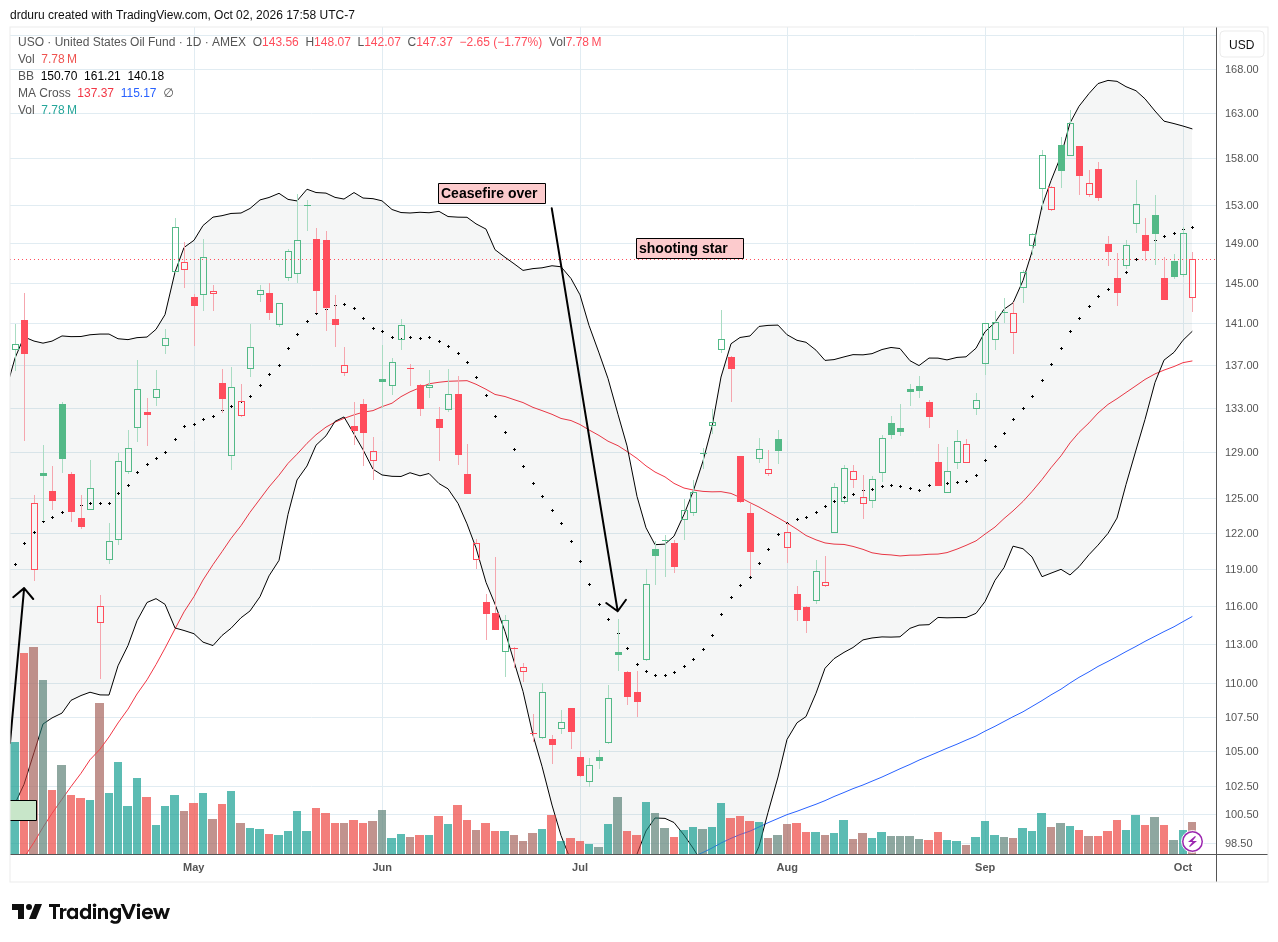
Technical Status: United States Oil Fund (USO) has thrice held support around its $143 level but a 20DMA breakdown sets up an eventual test of 50DMA support.
Trade Commentary: Oil ended the week down, but the market behaved as if oil traded higher given rising rates and falling consumer-facing stocks. I was tempted to take profits on my USO put spread, but I decided to hold out for continuation selling after Tuesday’s 4.4% loss. USO turned sharply around from there and even filled the entire gap after USO traded right to 20DMA resistance. At Friday’s low I was once more tempted to take profits ahead of my targeted test of 50DMA support. At the current pace of the downtrend, USO would hit my target just ahead of the put spread expiring.
SPDR Gold Shares (GLD)
Description: SPDR Gold Shares is an exchange-traded trust designed to reflect the price performance of physical gold bullion less fund expenses.
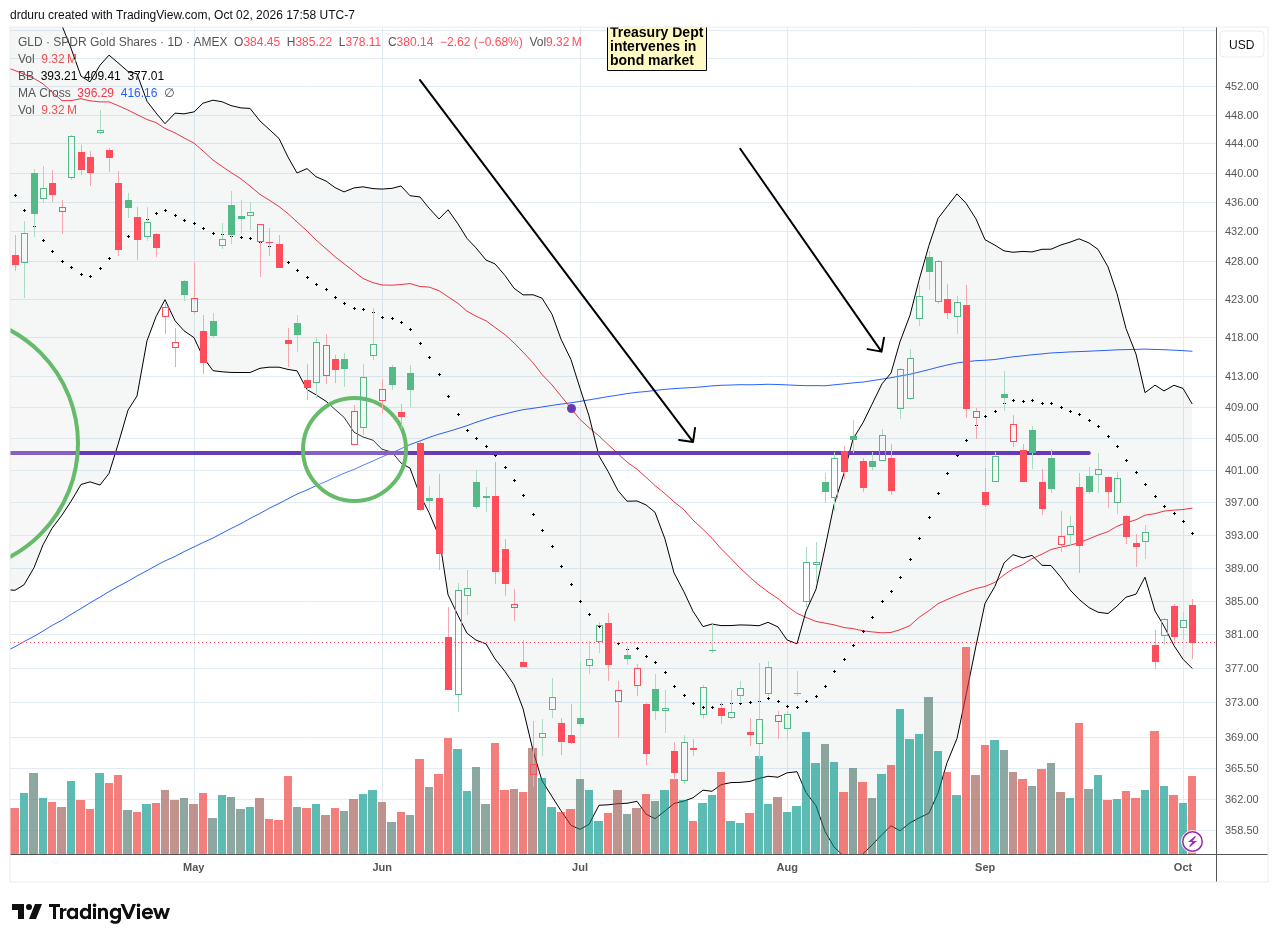
Technical Status: The SPDR Gold Shares (GLD) continued its post-Fed hike woes by confirming its 50DMA breakdown and finishing a reversal of its August breakout.
Trade Commentary: GLD suffered a 50DMA breakdown with a downtrending 20DMA resistance looming overhead. GLD is back in bearish territory and is no-touch until the next 50DMA breakout. I continue to expect gold to trade under price pressure in the face of a stronger U.S. dollar and a Federal Reserve that has entered a rate hiking cycle.
Footnotes
Subscribe for free to get email notifications of future posts!
“Above the 50” (AT50) uses the percentage of stocks trading above their respective 50-day moving averages (DMAs) to measure breadth in the stock market. Breadth defines the distribution of participation in a rally or sell-off. As a result, AT50 identifies extremes in market sentiment that are likely to reverse. Above the 50 is my alternative name for “MMFI” which is a symbol TradingView.com and other chart vendors use for this breadth indicator. Learn more about AT50 on my Market Breadth Resource Page. AT200, or MMTH, measures the percentage of stocks trading above their respective 200DMAs.
Active AT50 (MMFI) periods: Day #301 over 20% (overperiod), Day #5 under 30% (underperiod), Day #17 under 40%, Day #18 under 50%, Day #34 under 60%, Day #274 under 70%
Source for charts unless otherwise noted: TradingView.com
Full disclosure: long USO put spread, long SPY, long MGM, long DASH, long CRM, long CPRT put, long APP, long AMAT, long CAT, long RBLX
FOLLOW Dr. Duru’s commentary on financial markets via StockTwits, BlueSky, and even Instagram!
*Charting notes: Stock prices are not adjusted for dividends. Candlestick charts use hollow bodies: open candles indicate a close higher than the open, filled candles indicate an open higher than the close.
* Blog notes: I use ChatGPT to help with editing and news discovery.