

The Market Breadth Summary: AI Rebound
- The stock market rebounded rapidly from the AI crash, powered by strong earnings, renewed strength in AI and software stocks, and a weak July jobs report that shifted interest-rate expectations.
- The S&P 500 and Russell 2000 reached new all-time highs, while the NASDAQ recovered above its 50-day moving average but remained below its record high.
- Market breadth broke out, reinforcing the bullish technical backdrop without reaching overbought conditions.
- AI-related earnings produced sharp divergences, with Palantir, Atlassian, Twilio, Unity and other stocks surging while AppLovin and several post-earnings breakouts struggled.
- Low volatility, improving software performance and stronger breadth supported the rebound, but unresolved resistance levels and renewed oil volatility left important tests for the coming week.
The Stock Market Summary
The stock market rapidly transitioned from an AI crash to all-time highs in less than one week. Strong earnings revived the AI trade, software joined the advance, and the major indices pushed back toward their all-time highs. Momentum faded in the middle of the week before a surprisingly weak July jobs report kicked stocks higher thanks to reduced odds of a September rate hike. (So far so good on my bets against rate hikes this year). Even so, the NASDAQ has not completely recovered, software still has resistance to overcome, and oil remains hostage to conflicting war headlines. So what powered the rebound will have to find some more fuel this week to confirm the newfound momentum.
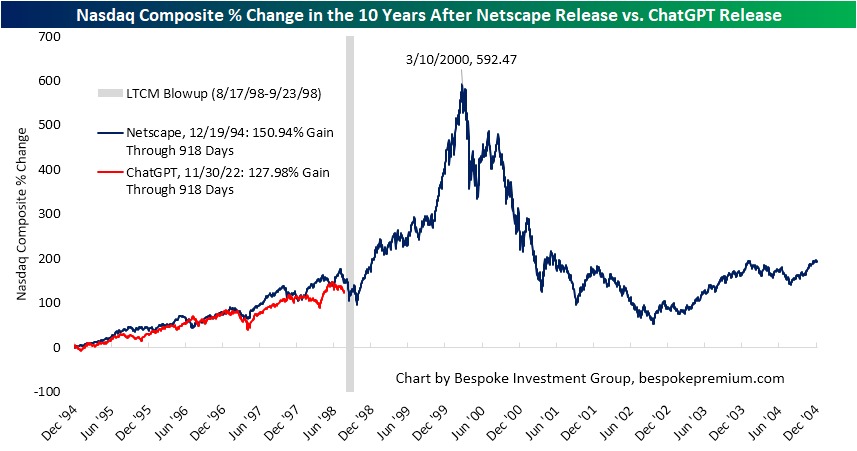
Bespoke Investments noted similar timing between the AI crash generated by Situational Awareness and the sell-off caused by the collapse of Long-Term Capital Management back in 1998. Bespoke starts its parallel timeline with the release of Netscape on December 19, 1994 and the launch of ChatGPT. An updated timeline will show a sharp divergence thanks to the rapid recovery from the AI Panic, but an update may also suggest that the NASDAQ is now around the corner from another relentless rally!
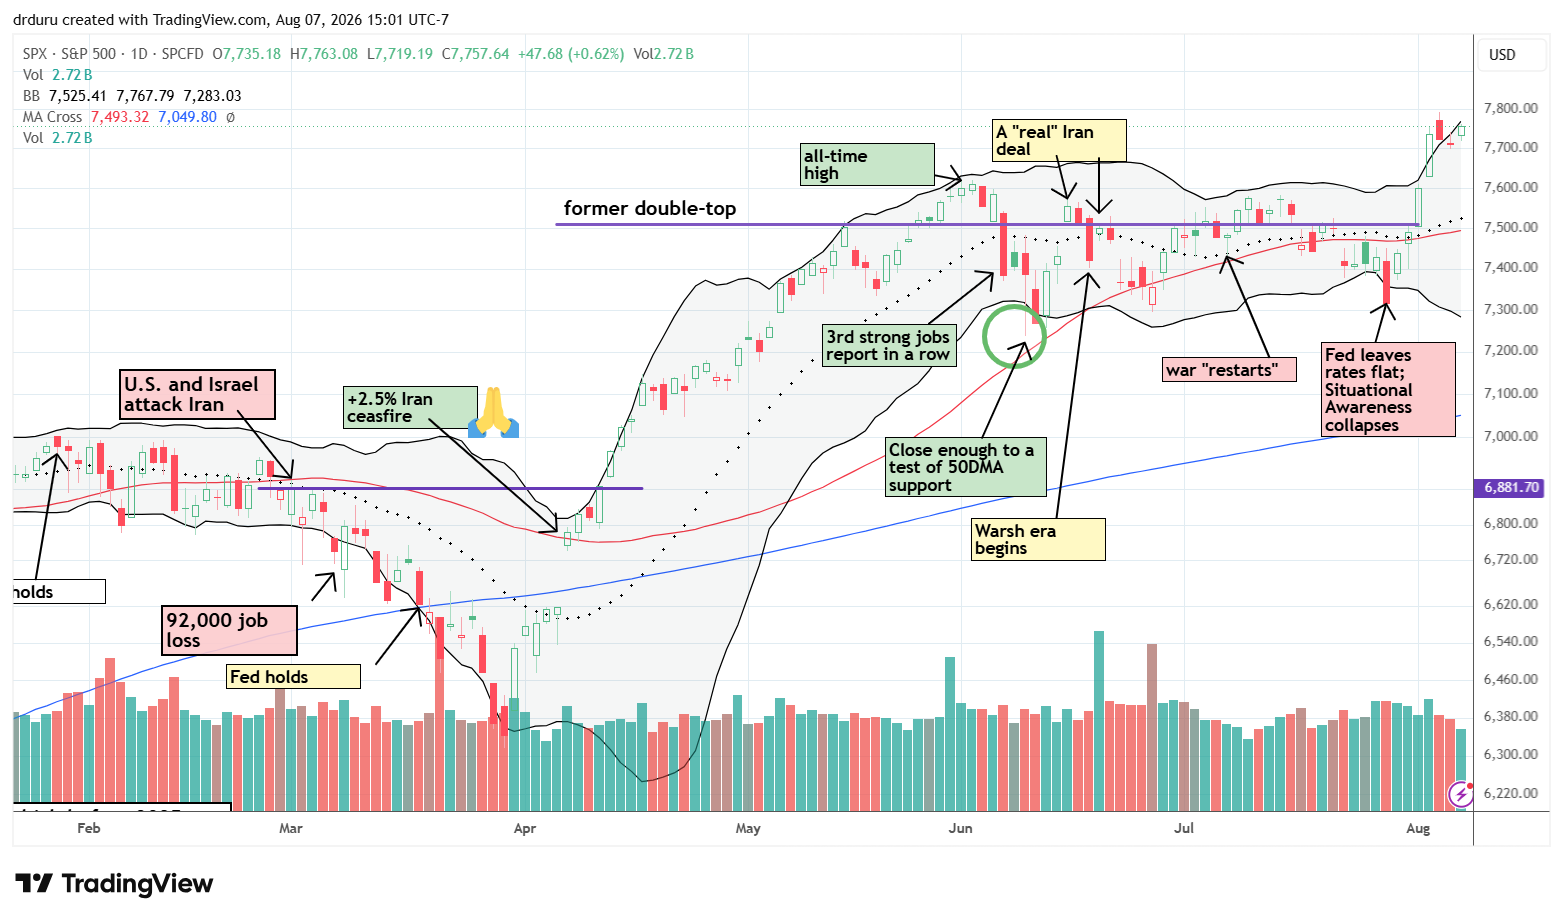
S&P 500 (SPY)
The S&P 500 (SPY) began the week with a convincing 1.5% gain after hurdling the “7,500 wall” that held the index in place since May. The fresh all-time highs catapulted the index to a new phase of bullishness. Looking back, I can see how the deep selling from Situational Awareness (and the Fed) created a washout of sellers.
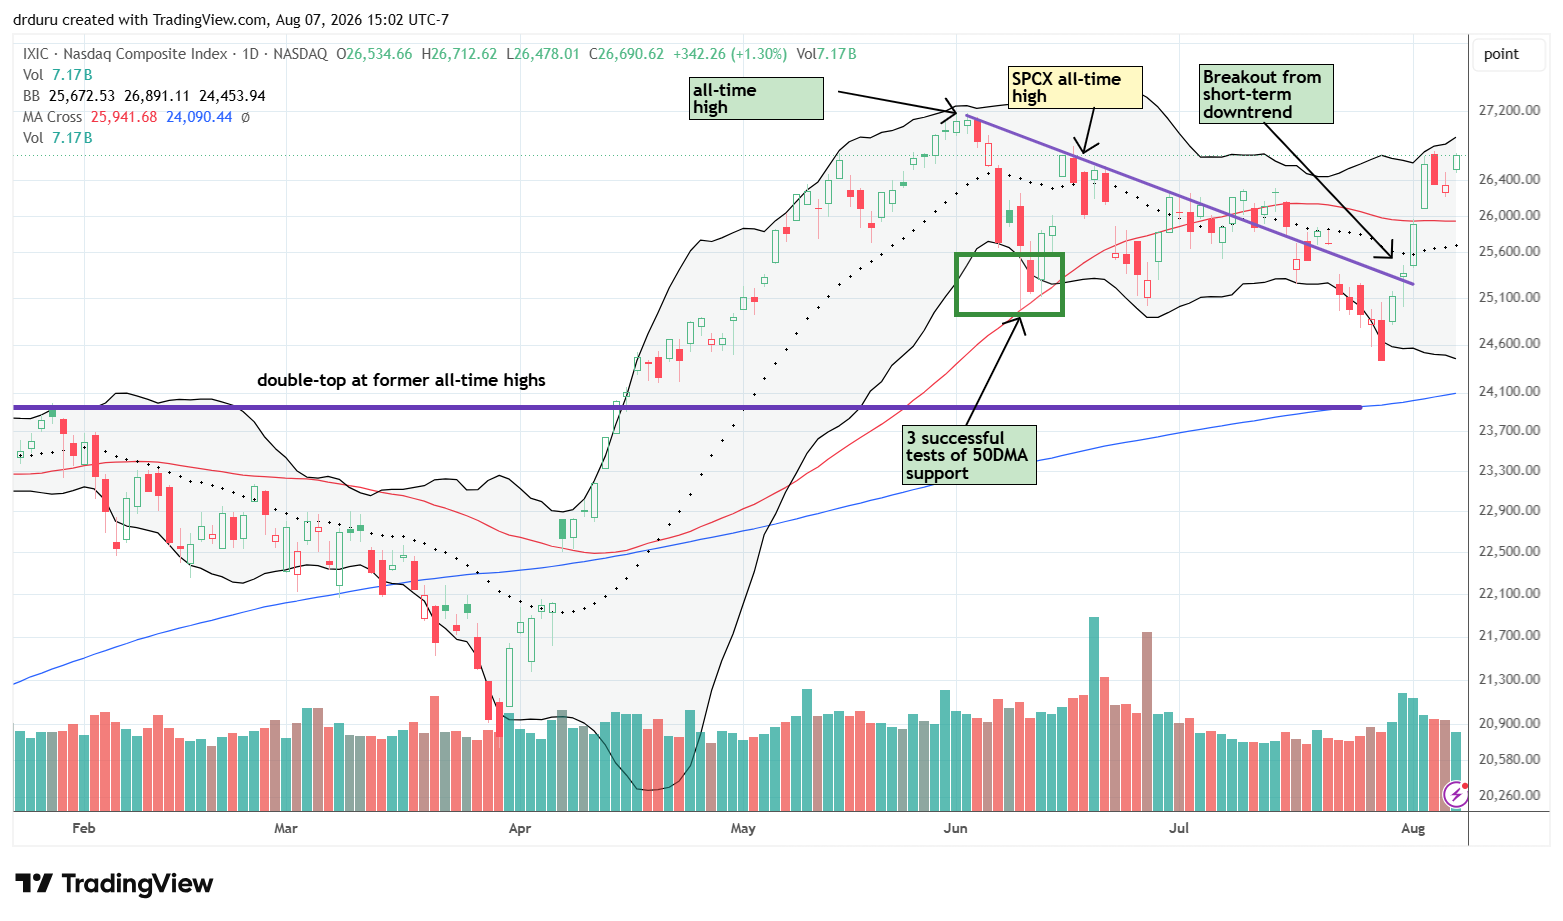
NASDAQ (COMPQ)
The NASDAQ (COMPQ) followed a pattern similar to the S&P 500’s vertical leap from the previous week’s bottom. The tech-laden index flashed a buy signal once it closed above the previous downtrend. The buy signal was confirmed with the breakout above the 50-day moving average (DMA) (red line). However, the NASDAQ failed to challenge its all-time high and thus also failed to achieve a higher level of bullishness. I remain wary even though I profited from a QQQ call spread (hedged with an SMH put spread that remains active).
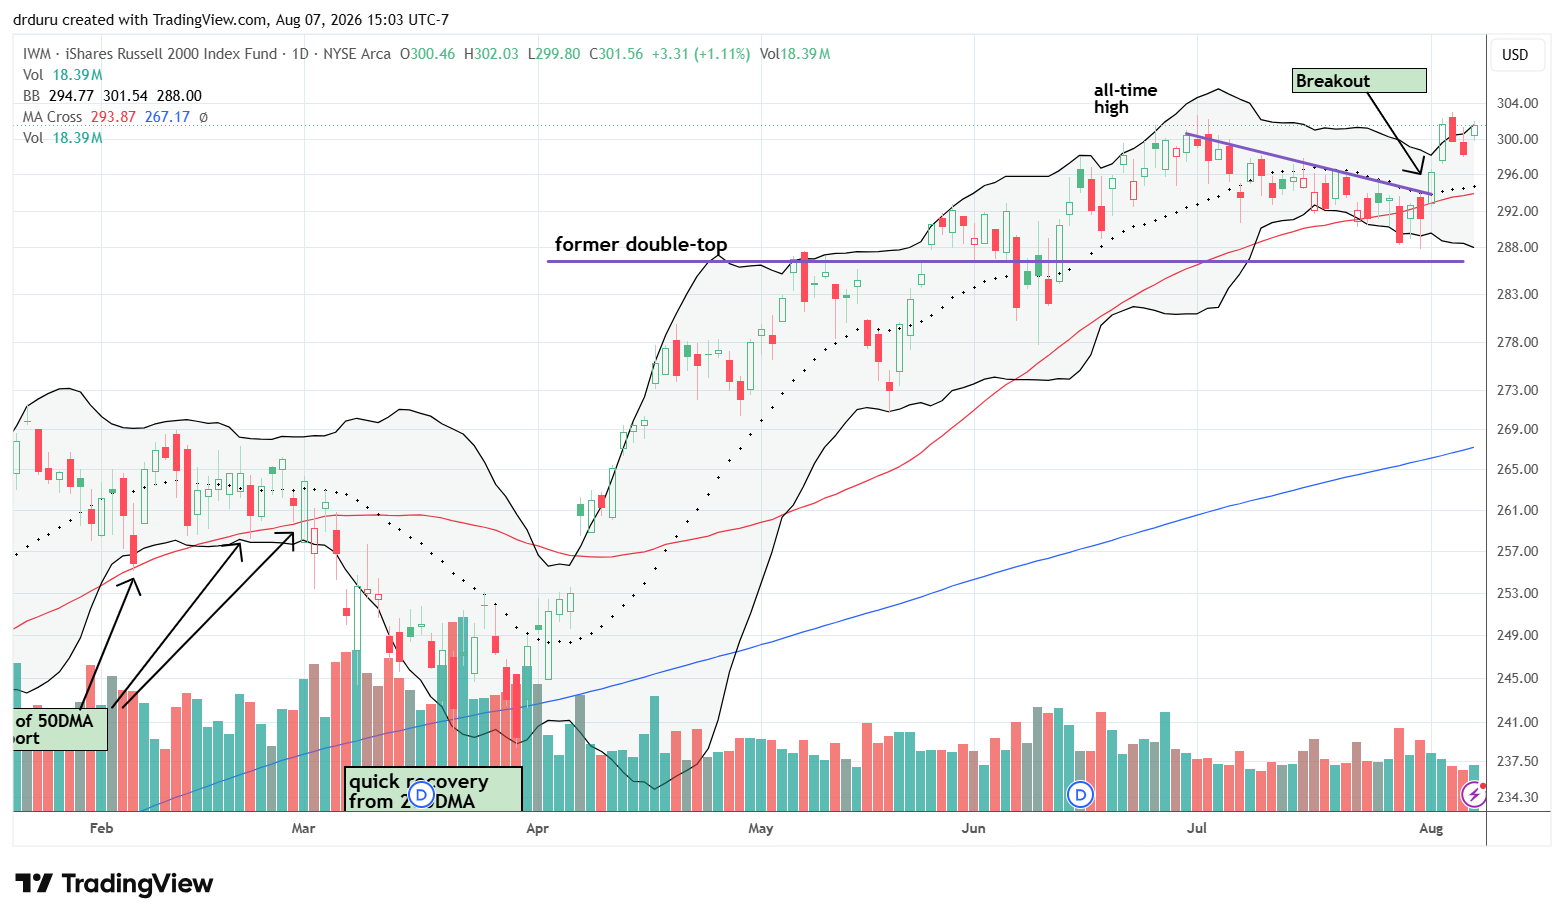
iShares Russell 2000 ETF (IWM)
The rebound for the iShares Russell 2000 ETF (IWM) was much less dramatic than the moves for the S&P 500 and the NASDAQ. IWM did not plunge as deeply as those indices, so a shallower rebound makes sense. Still, IWM made new all-time highs and looks ready to continue higher. I profited from the call options going into the week, but I did not reestablish a fresh position going into the coming trading week.
The Short-Term Trading Call While Powered
- AT50 (MMFI) = 61.4% of stocks are trading above their respective 50-day moving averages
- AT200 (MMTH) = 61.3% of stocks are trading above their respective 200-day moving averages
- Short-term Trading Call: cautiously bullish
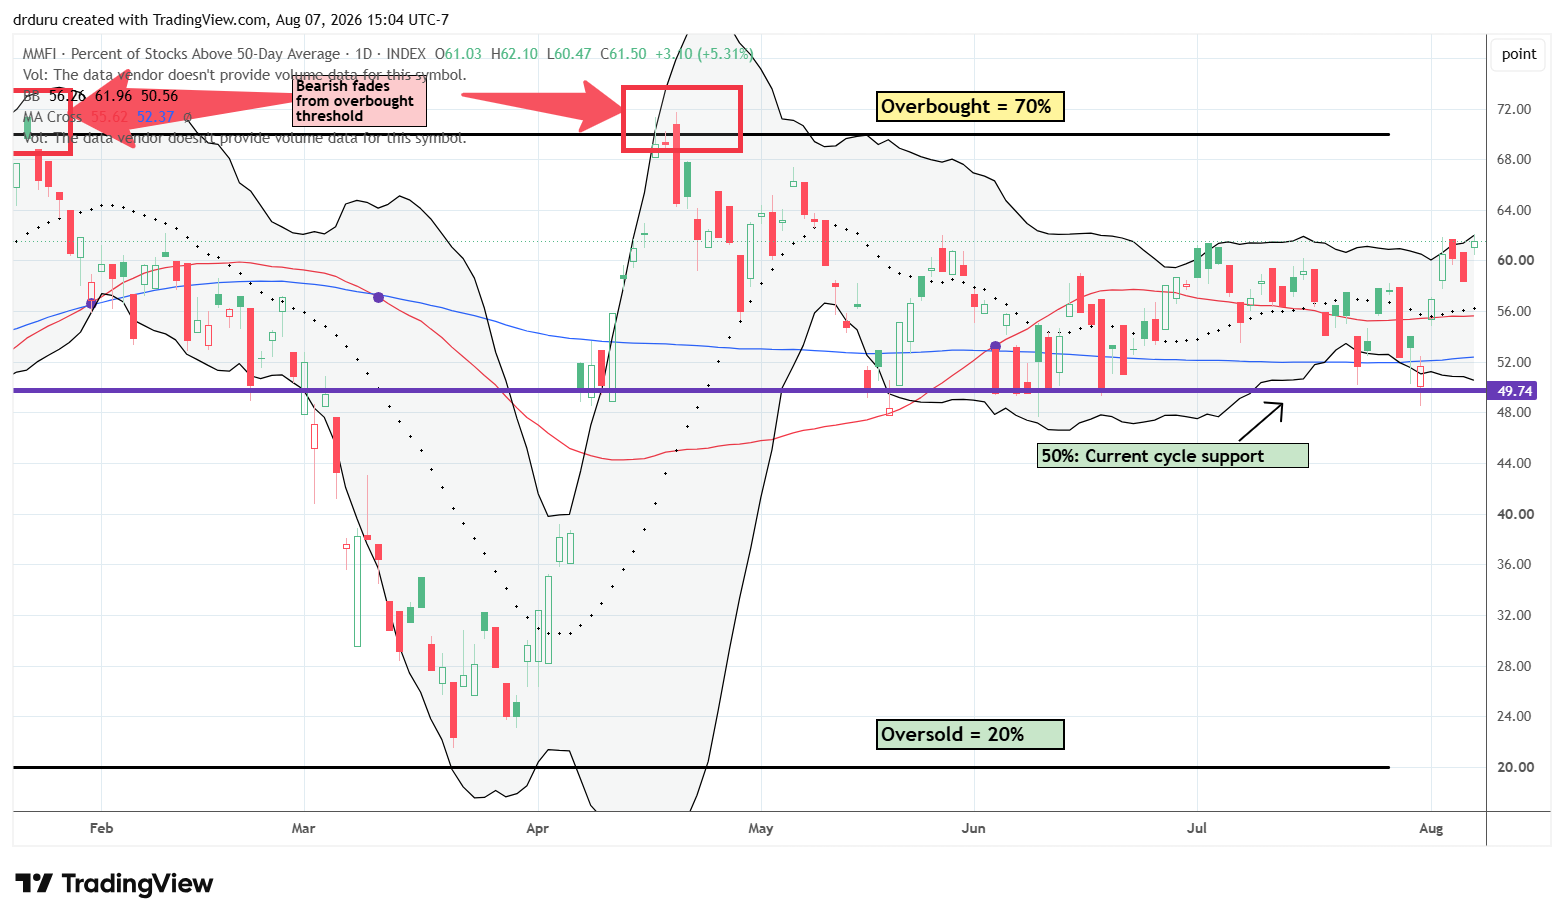
AT50 (MMFI), the percentage of stocks trading above their respective 50DMAs, closed the week at 61.4%, a 3-month high.
My favorite technical indicator managed a breakout above its recent trading range. The move confirms an underlying bullishness in the market without making me worried about overbought conditions. The 10 percentage points to go make me comfortable enough to switch the short-term trading call back to cautiously bullish. I do not foresee a potential change until/unless AT50 reaches the overbought threshold or the S&P 500 closes below its 50DMA support.
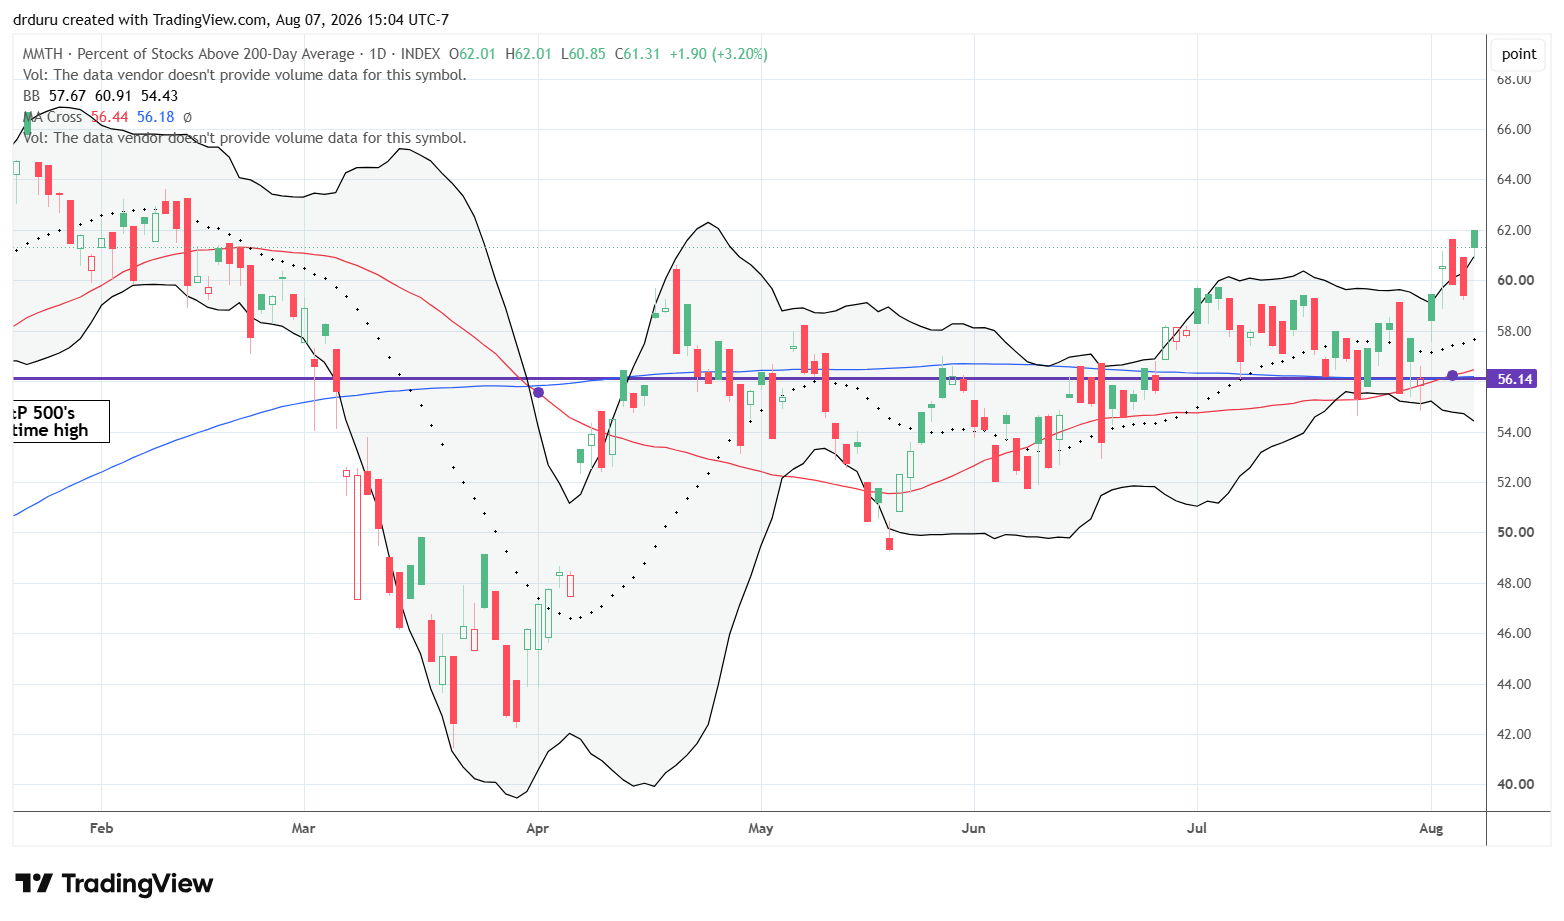
AT200, the percentage of stocks trading above their respective 200DMAs, closed the week at 61.3%. This rare alignment with AT50 is a timely reinforcement of the bullish undertones for the stock market. The 6-month high confirms that the majority of stocks are in constructive trading positions.
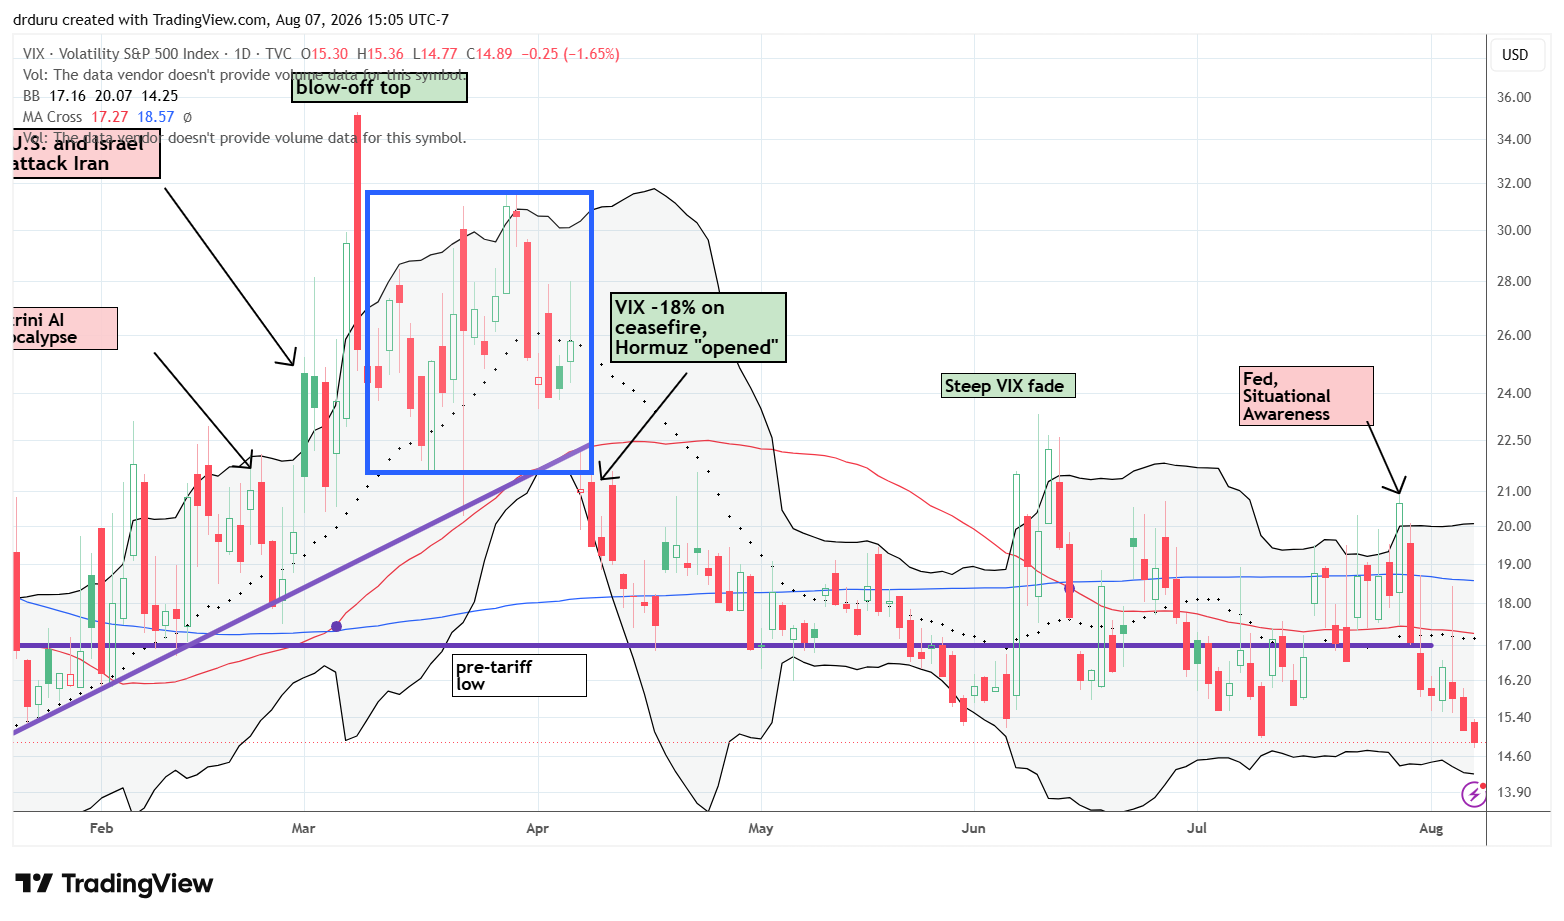
The volatility index (VIX) added its weight to the bullish undertones for the market. The VIX closed at 15.9 and is close to a new low for the year. As a reminder, I treat extra low volatility as a bullish signal even as I recognize that the end to an extended period of low volatility can deliver an extreme jolt of selling in the market. Thus, this is a great time to buy cheap protection. As I mentioned earlier, I have an SMH put spread in place; I figure semiconductors will again be the hardest hit by the next wave of selling in the market.
In case you missed it…
Last week I explained why I sold short a MSFT call spread (I took profits the very next day!). I also spent some time on economic issues describing how Nebraska has an “oversupply” of jobs.
The Equities
Palantir Technologies (PLTR)
Description: Palantir provides AI-powered data-integration and analytics software to government and commercial organizations.
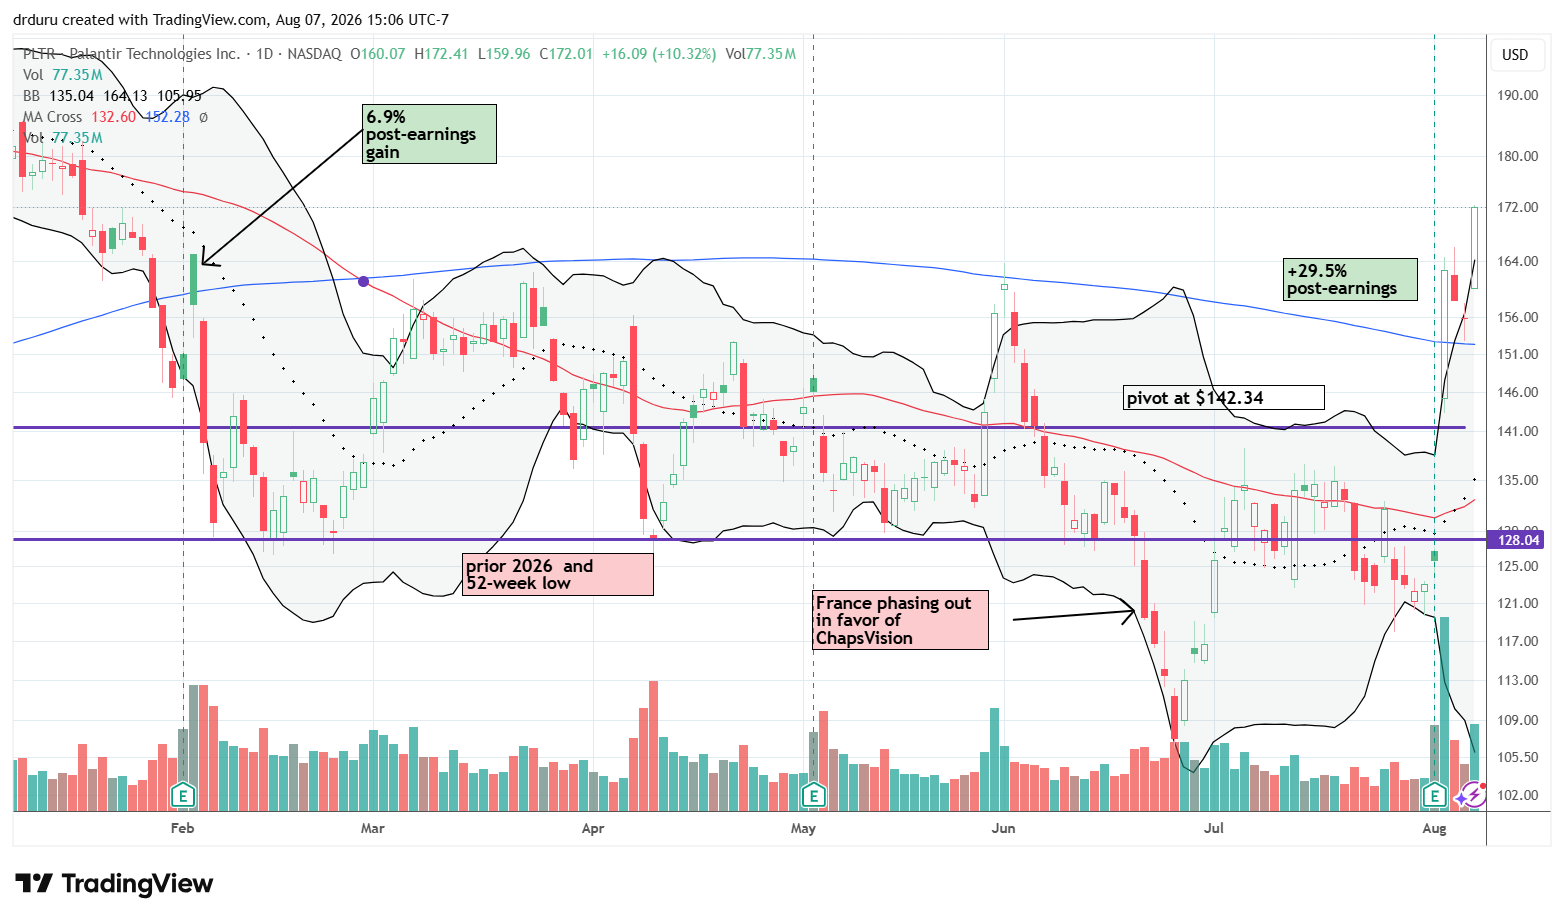
Technical status: Palantir Technologies (PLTR) surged above its 200DMA by 29.5% post-earnings, rising above its upper Bollinger Band and reaching levels from last January.
Trade commentary: Palantir delivered the week’s loudest rebuttal to the AI crash. According to Investopedia, second-quarter revenue surged 93% to $1.94 billion, U.S. commercial revenue jumped 149%, and management raised full-year revenue guidance by roughly $500 million. The strong earnings report represents a vote of confidence in enterprise and sovereign AI demand. I missed a golden opportunity to buy PLTR when a post-earnings cooling perfectly tapped 200DMA support. The stock soared 10.3% the next day. I am treating PLTR as a buy-on-the-dips from here given the stock has cleared layers of critical resistance levels.
Caterpillar (CAT)
Description: Caterpillar manufactures construction and mining equipment, diesel engines, industrial turbines and related power systems.
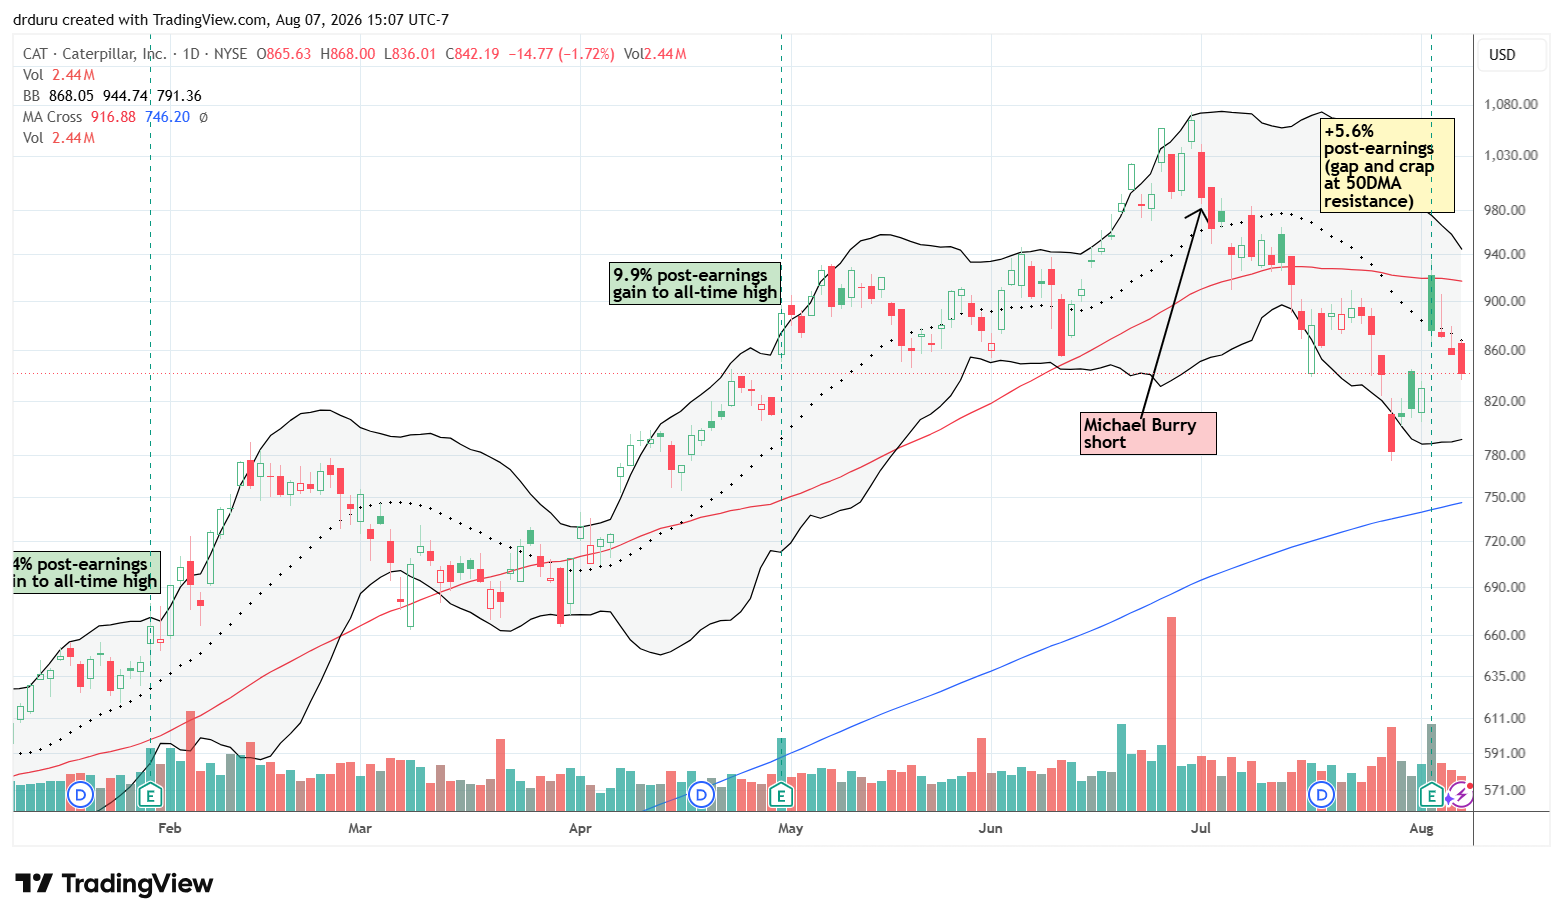
Technical status: Caterpillar (CAT) bounced off of its lower Bollinger Band after the AI crash but confirmed 50DMA resistance after rising by 5.6% post-earnings.
Trade commentary: CAT is an honorary AI trade given its heavy construction equipment is used in building data centers and its generators are used to supply quick and accessible power to data centers. The company reported that revenue increased 24% to a record $20.5 billion, adjusted earnings reached $8.17 per share, and management raised its 2026 sales-growth forecast. Construction and power-generation equipment benefited directly from data-center building and electricity demand, while backlog expanded to $72.1 billion. Despite this good news, CAT faded perfectly from 50DMA resistance and nearly finished a reversal of its post-earnings gains. With the 20DMA downtrend still intact and the stock trading in limbo between its 200DMA and 50DMA, I am not buying CAT here.
Arista Networks (ANET)
Description: Arista supplies high-speed networking hardware and software for cloud, enterprise and AI data centers.
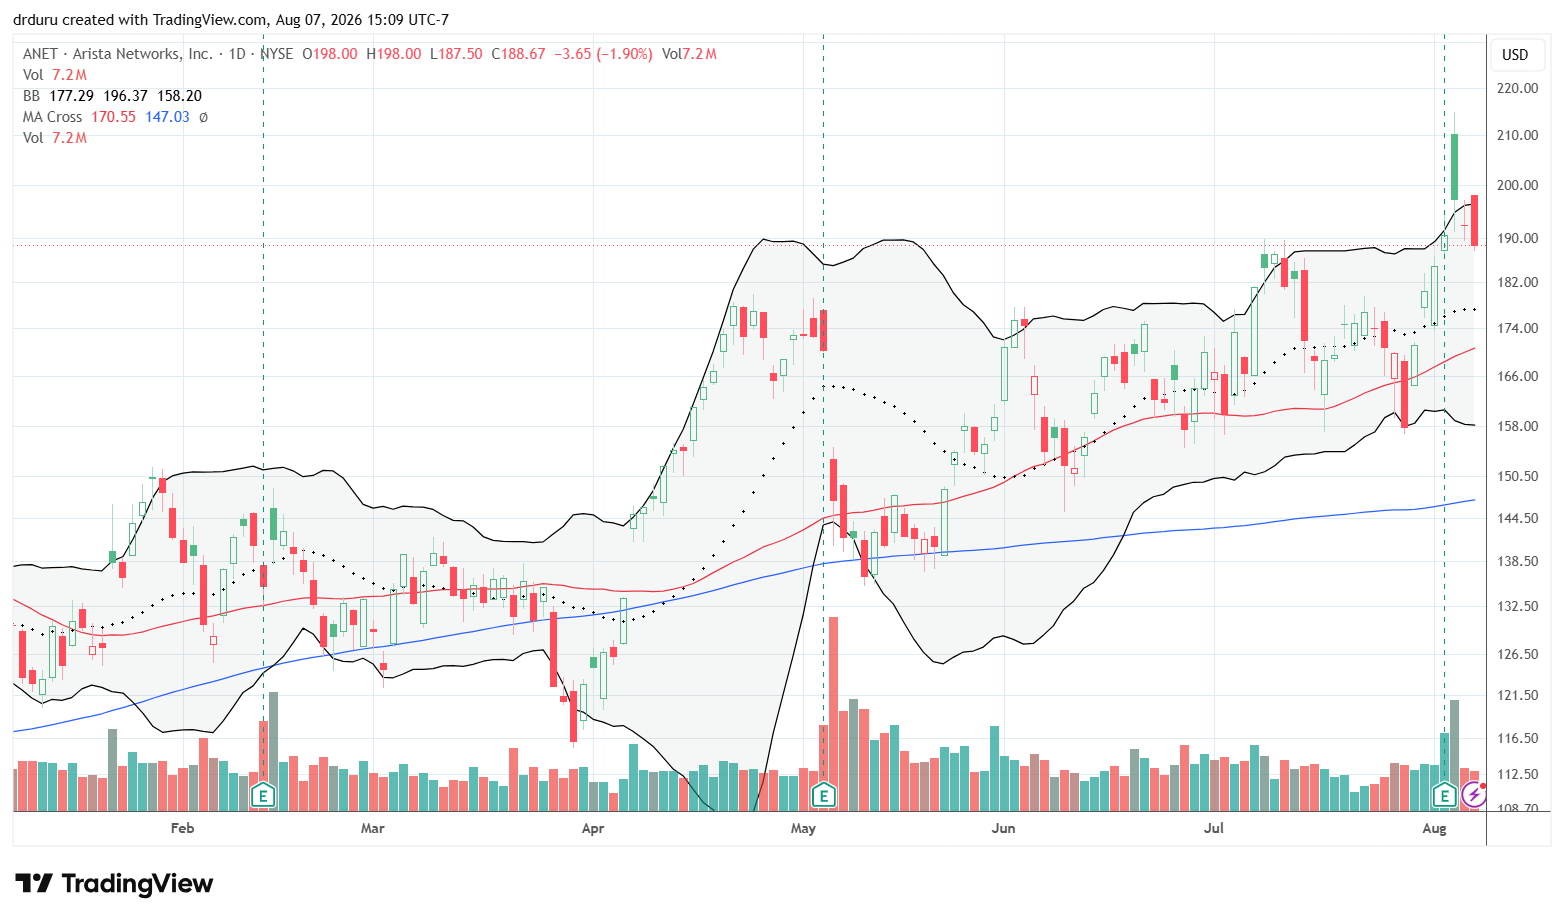
Technical status: Arista Networks (ANET) gapped post-earnings to an all-time high but quickly faded all its gains, leaving in question the bullishness of the latest surge.
Trade commentary: Arista reported second-quarter revenue of $3.04 billion, up 37.7%, while adjusted earnings of $1.02 easily exceeded expectations. The report confirmed that hyperscaler spending continues to flow into the networking layer of the AI buildout. However, ANET gapped and crapped post-earnings and on Friday finished reversing all its post-earnings gains. The stock remained in an uptrend but also looks topped out for now.
Applied Optoelectronics (AAOI)
Description: Applied Optoelectronics manufactures fiber-optic networking products and transceivers for data centers, broadband networks and telecommunications systems.
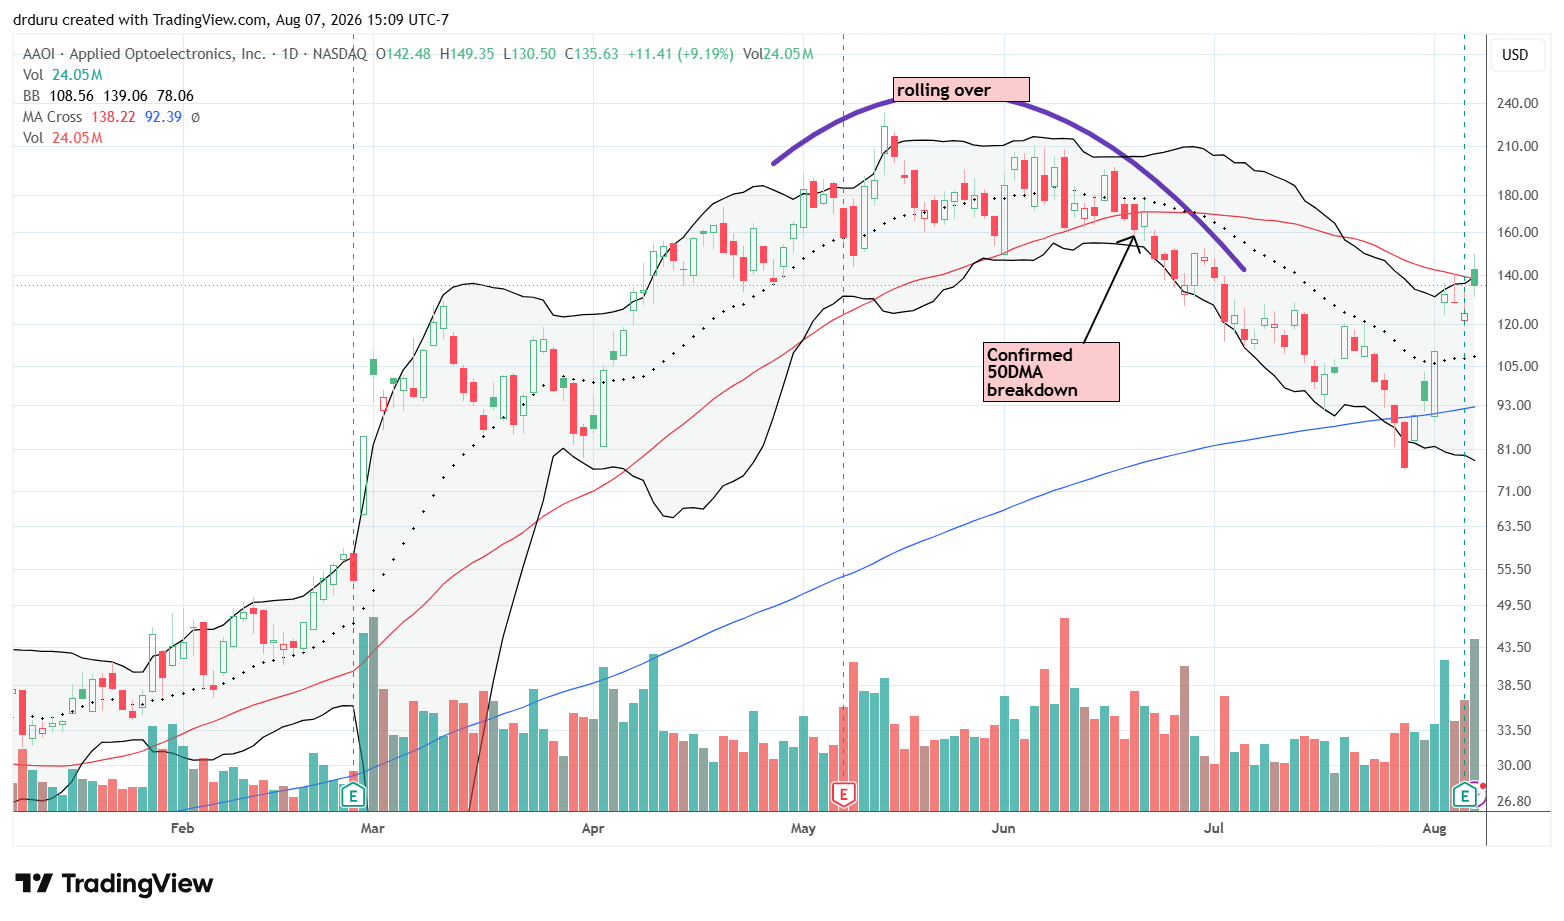
Technical status: Applied Optoelectronics (AAOI) perfectly pivoted around its 200DMA, ending its bearish rollover phase. However, a 9.2% post-earnings gain closed right on 50DMA resistance.
Trade commentary: Applied Optoelectronics reported an adjusted quarterly profit as revenue surged 86% to $191.9 million. While third-quarter earnings guidance fell short of “expectations”, accelerating shipments of 800-gigabit and 1.6-terabit products for AI data centers helped boost the stock. AAOI was also boosted by reports that the FCC is preparing restrictions on Chinese optical-transceiver imports. Overall, AAOI gained 45% for the week…and yet only reversed most of its loss from July. A close over 50DMA resistance will finish invalidating the topping pattern I described earlier.
ATI (ATI)
Description: ATI produces specialty alloys and advanced materials primarily for aerospace, defense and other demanding industrial applications.
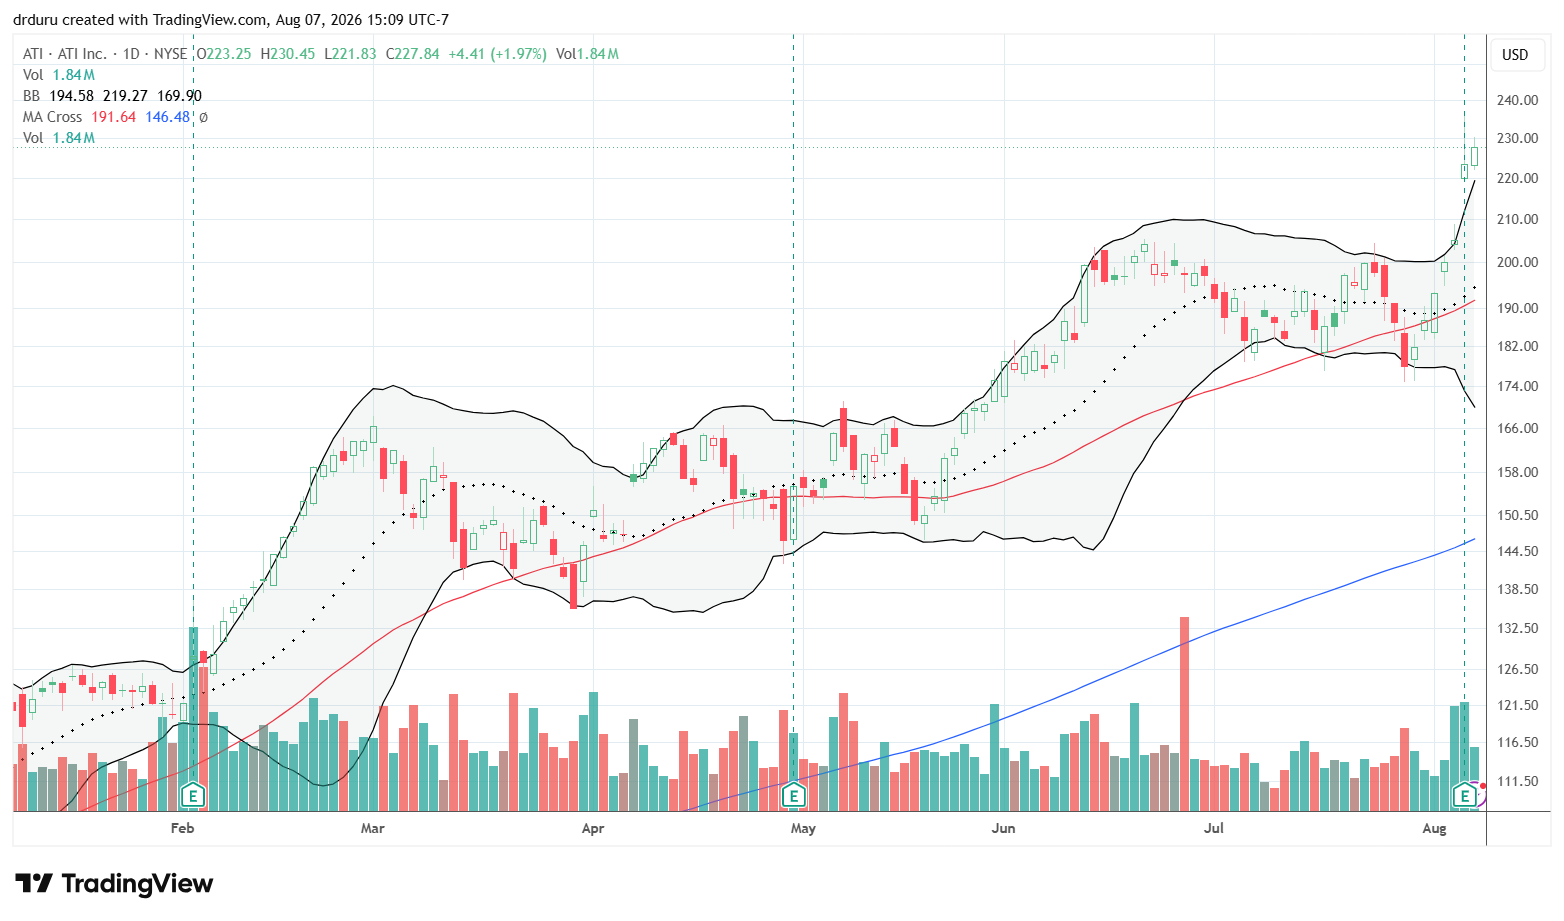
Technical status: ATI (ATI) broke out above its 50DMA and then reached a new all-time high thanks to an 8.9% post-earnings jump.
Trade commentary: ATI jumped more than 10% after reporting adjusted earnings rose 66% to $1.23 per share and revenue increased 11%. Aerospace and defense generated 68% of revenue, while a $4.4B backlog provided strong visibility. Management lifted full-year adjusted earnings guidance and issued third-quarter guidance well above “consensus.” My timely purchase of ATI was challenged by the AI crash but validated by the post-earnings surge.
ON Semiconductor Corporation (ON)
Description: ON Semiconductor Corporation manufactures power-management, sensing and connectivity semiconductors for automotive, industrial and data-center applications.
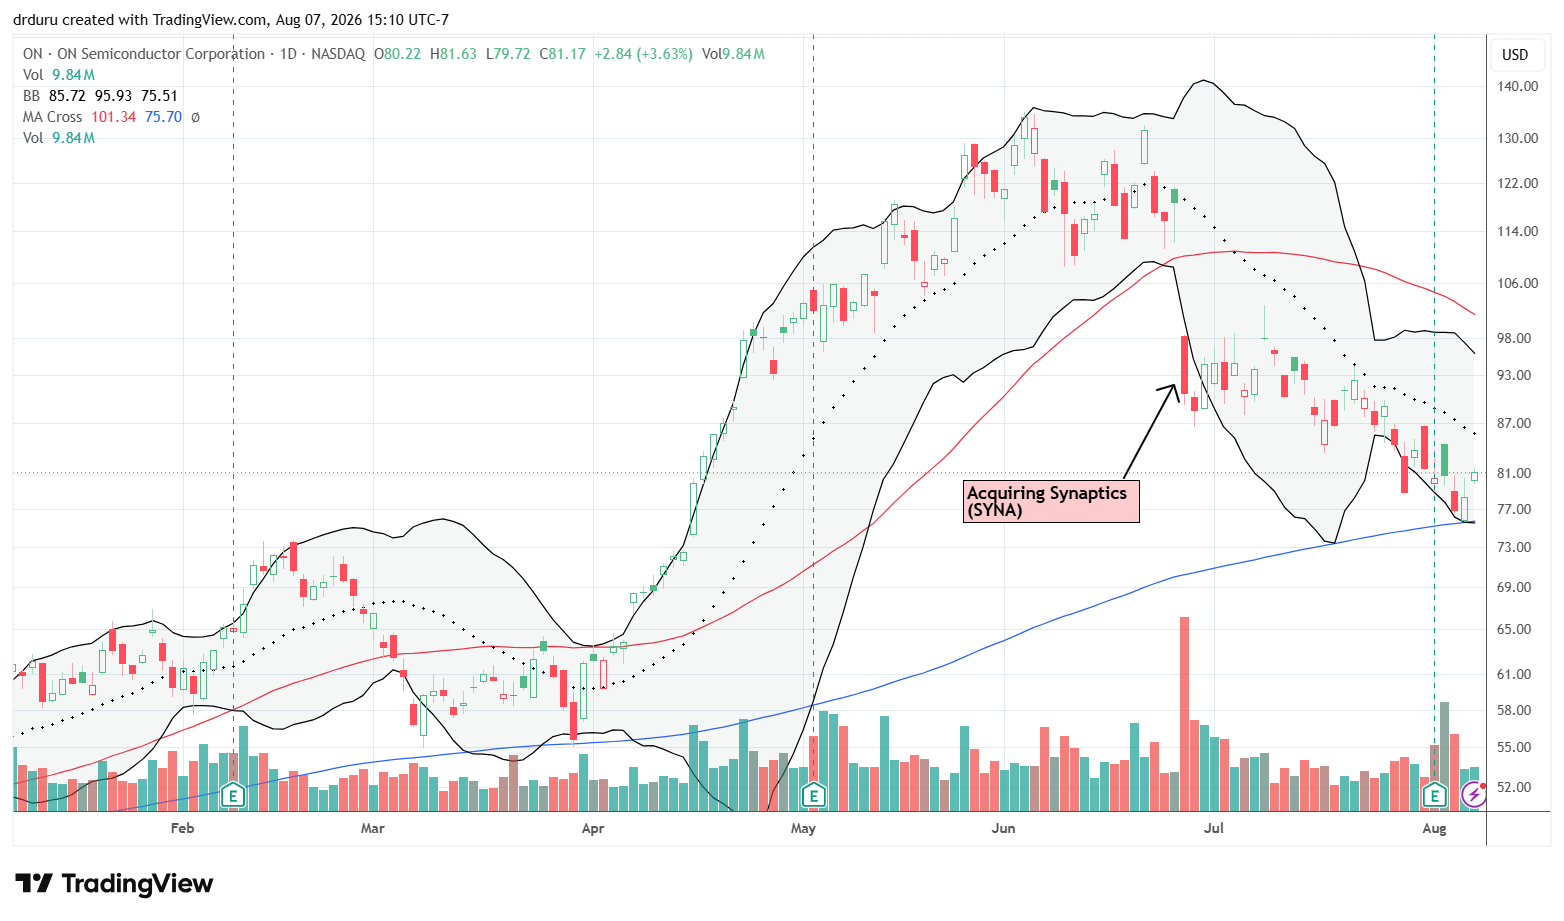
Technical status: ON Semiconductor Corporation (ON) lightly tapped its 200DMA after a brief post-earnings gain, confirming support and still looking to end its month-long downtrend.
Trade commentary: ON Semiconductor Corporation reported $1.60 billion in revenue and adjusted earnings of $0.74 per share. Management expects AI data-center revenue to more than double in 2026 and account for approximately 8% of annual sales. That news was enough to nudge the stock higher but sellers quickly returned. The test of 200DMA support looks tepid, so the stock looks vulnerable to another bearish breakdown. Note that ON is still suffering overhang from its acquisition of Synaptics.
Coherent (COHR)
Description: Coherent supplies lasers, optical components and photonics products used in data centers, telecommunications and industrial systems.
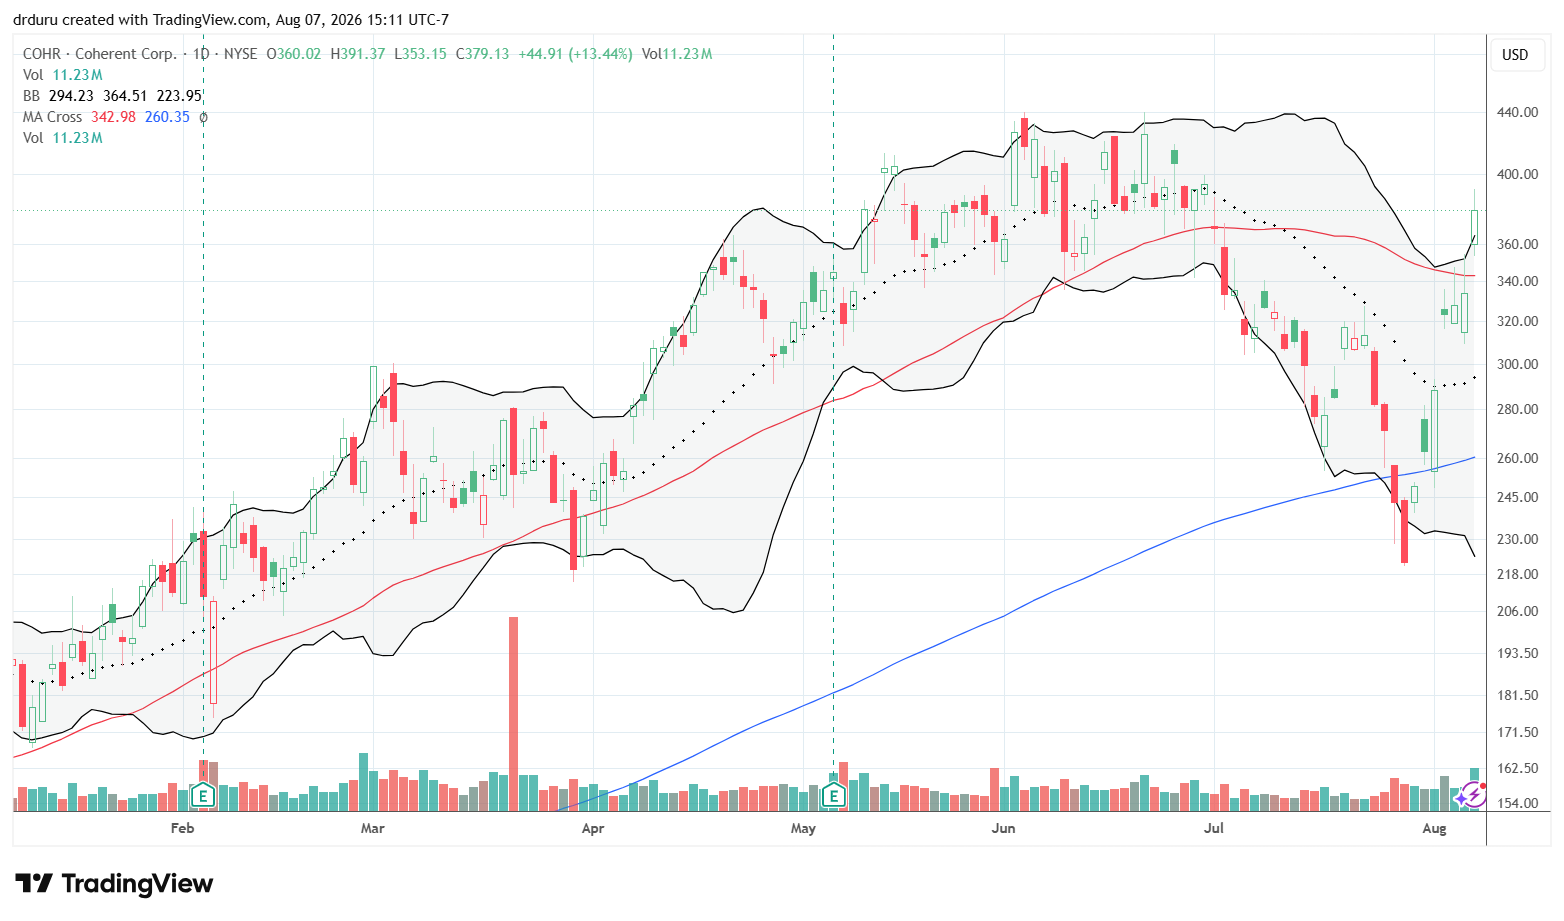
Technical status: Coherent (COHR) rapidly regained all of its July losses, breaking out above its 200DMA and 50DMA in a sharp uptrend.
Trade commentary: Coherent also benefited from news of a proposed U.S. restriction on Chinese optical transceivers. The subsequent 50DMA breakout returns the stock to bullish trading territory. I will be watching how the stock responds to upcoming earnings.
Amazon.com (AMZN)
Description: Amazon operates global e-commerce, advertising and subscription businesses along with the AWS cloud-computing platform.
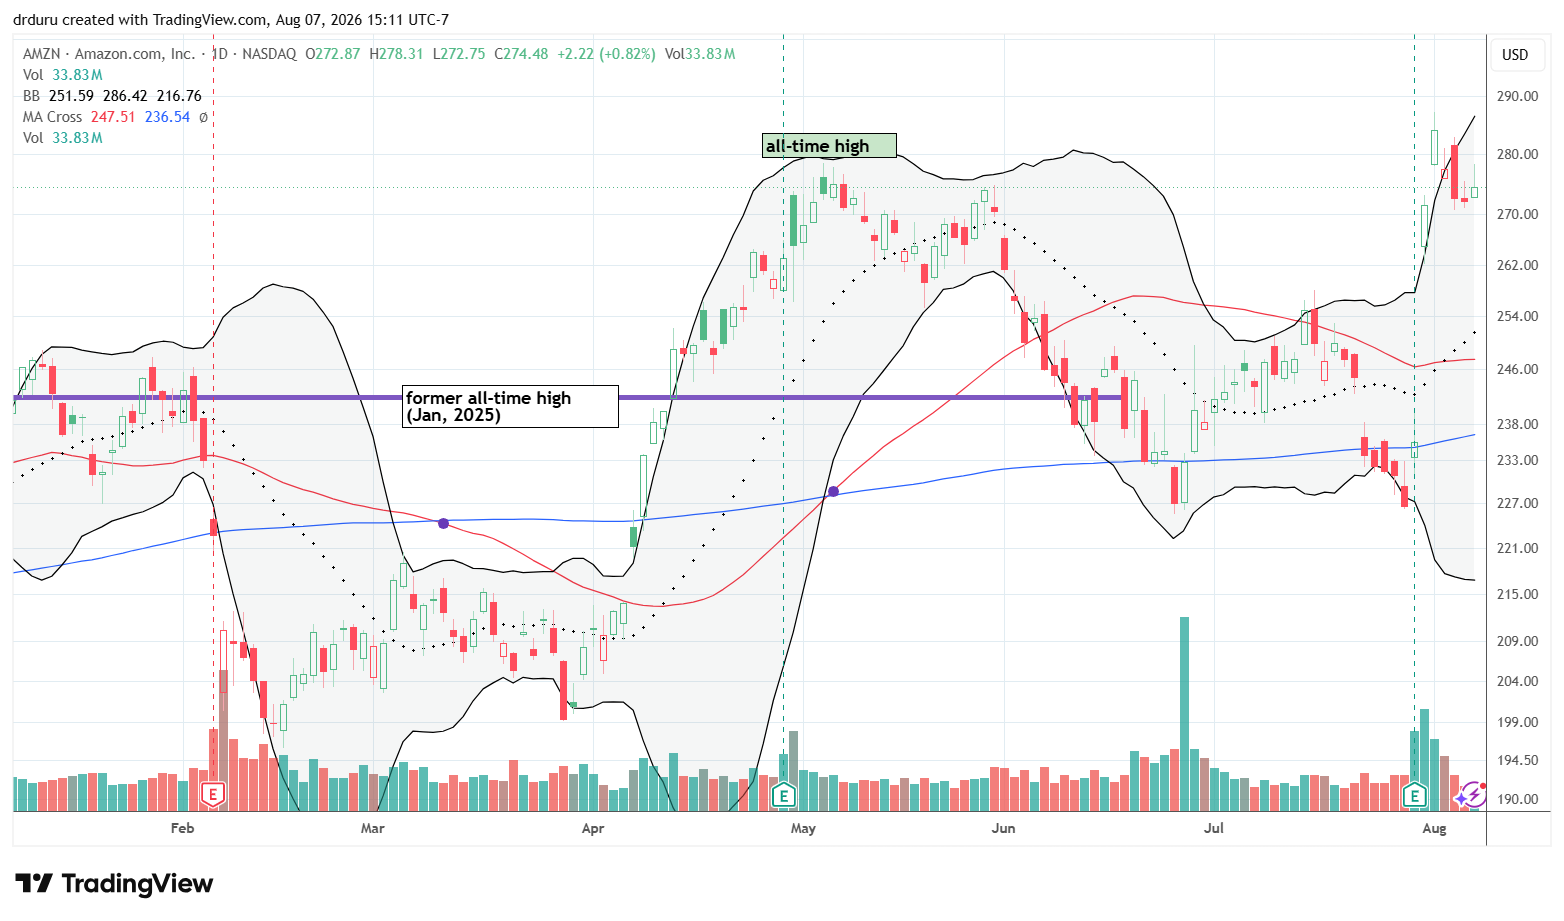
Technical status: Amazon.com (AMZN) surged above its 200DMA and 50DMA after a 15.3% post-earnings jump, reaching a new all-time high before filling the last gap.
Trade commentary: I missed the AMZN post-earnings trade and missed out on Monday’s impressive 4.6% follow-through buying. When on Wednesday the stock reversed all those gains, I bought a calendar call spread as a belated post-earnings play. Much to my surprise, Friday’s brief move higher was enough to close out my position at its target profit level. With the stock below its former all-time high, I am wary of going long above natural support, for example at the 20DMA.
CDW Corporation (CDW)
Description: CDW provides hardware, software, cloud services and other IT solutions to businesses, governments, schools and healthcare organizations.
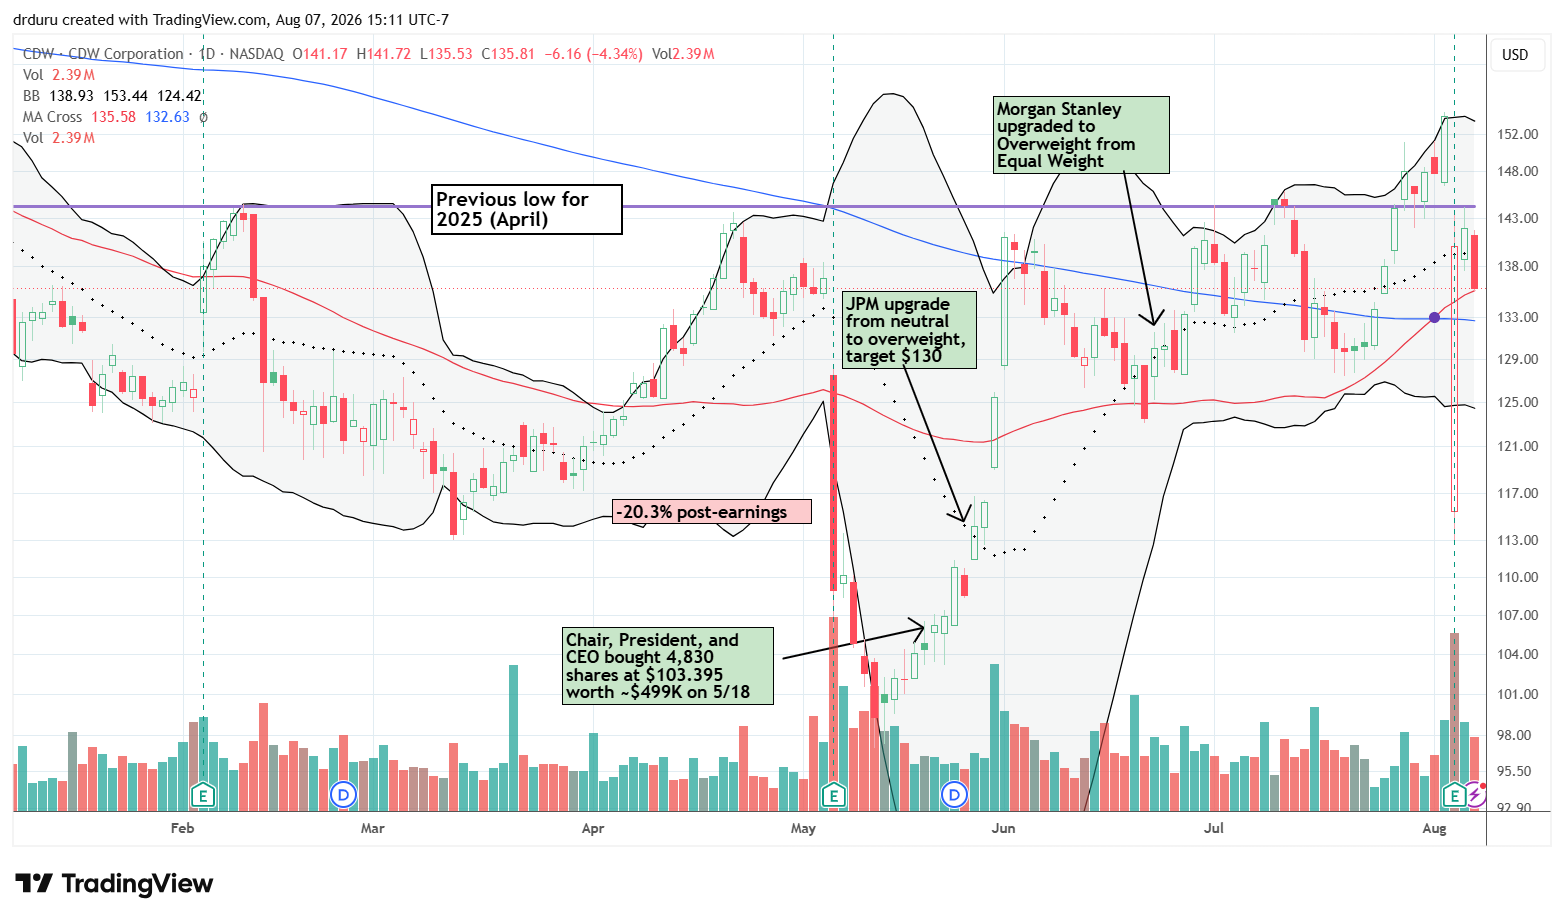
Technical status: CDW Corporation (CDW) temporarily broke down below its 50DMA and 200DMA in a post-earnings 9% stumble, ending the prospects for follow-through from a breakout.
Trade commentary: CDW is one enigmatic stock! The company produced record second-quarter net sales of $6.57 billion, up 10%, as customers advanced infrastructure-modernization, cloud and AI projects. Management also raised its 2026 outlook. Yet, the stock plunged as much as 26% before buyers rushed in to minimize the loss to 9%. The rebound stopped cold the next day at former resistance from the previous low from April 2025 (see chart below). Friday’s close on top of 50DMA support has me waiting for a buy signal from a fresh move higher.
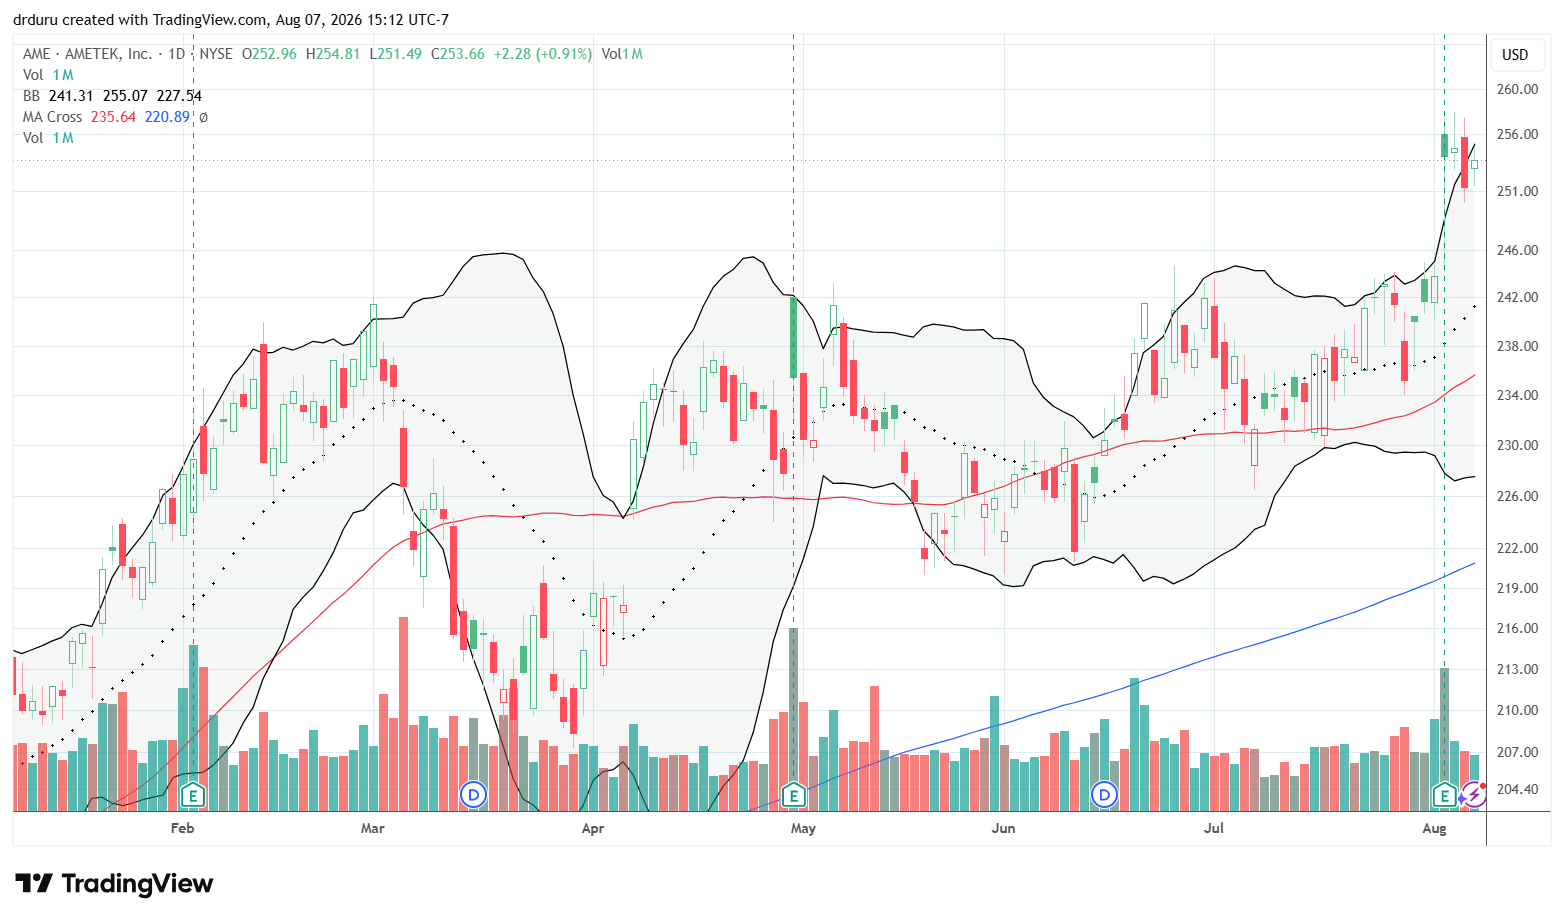
AMETEK (AME)
Description: AMETEK manufactures electronic instruments and electromechanical devices for aerospace, automation, energy, medical and industrial markets.
Technical status: AMETEK (AME) surged above its upper Bollinger Band after a 4.2% post-earnings rise, setting a new all-time high.
Trade commentary: AMETEK reported record revenue of $2.04 billion, up 15%, with 10% organic growth. Adjusted earnings increased 17% to $2.09 per share, orders reached a record level, and management raised full-year guidance. The report reinforced the broader strength in specialized equipment and instrumentation without relying exclusively on the AI trade. AME managed to hold its post-earnings gains and all-time high for the rest of the week.
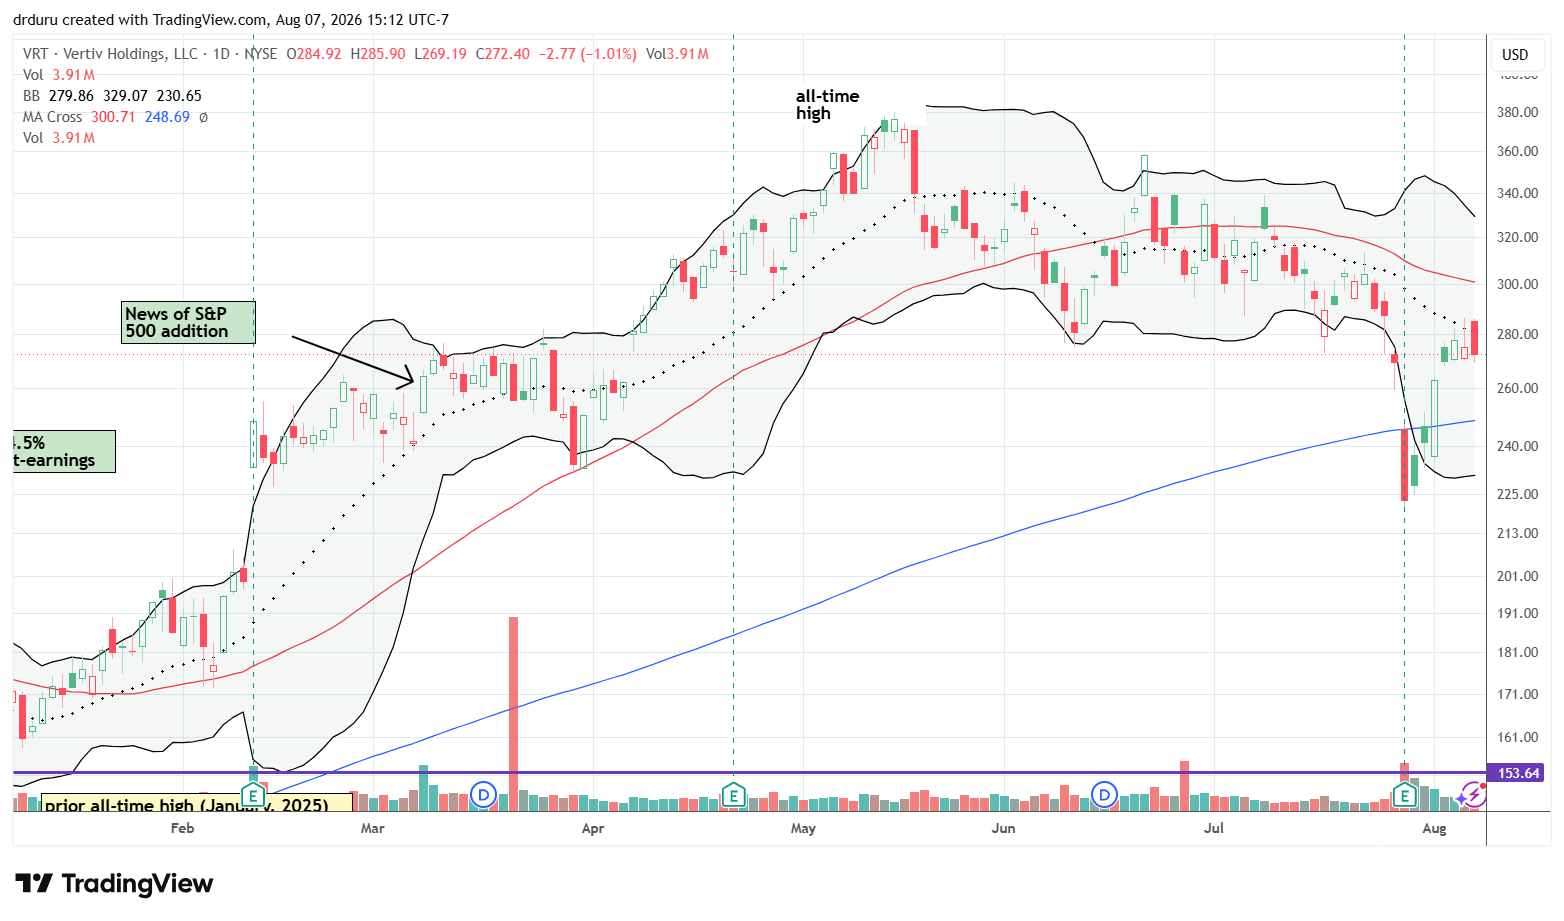
Vertiv Holdings (VRT)
Description: Vertiv supplies power-management, cooling and other critical infrastructure for data centers and communications networks.
Technical status: Vertiv Holdings (VRT) crashed down below its 200DMA after a 17.3% drop, before recovering all the way back to 20DMA resistance.
Trade commentary: VRT was unfortunate enough to report earnings right before the AI crash. As I mentioned in the previous Market Breadth, I sold a put after concluding the selling was way overdone. However, I did not have a complete recovery on my bingo card. Still, VRT’s impressive recovery stalled right at 20DMA resistance. The stock looks ready for some churn for a few weeks. As one of my favorite AI-related stocks, I will continue to follow its price dynamics for clues to the next trade.
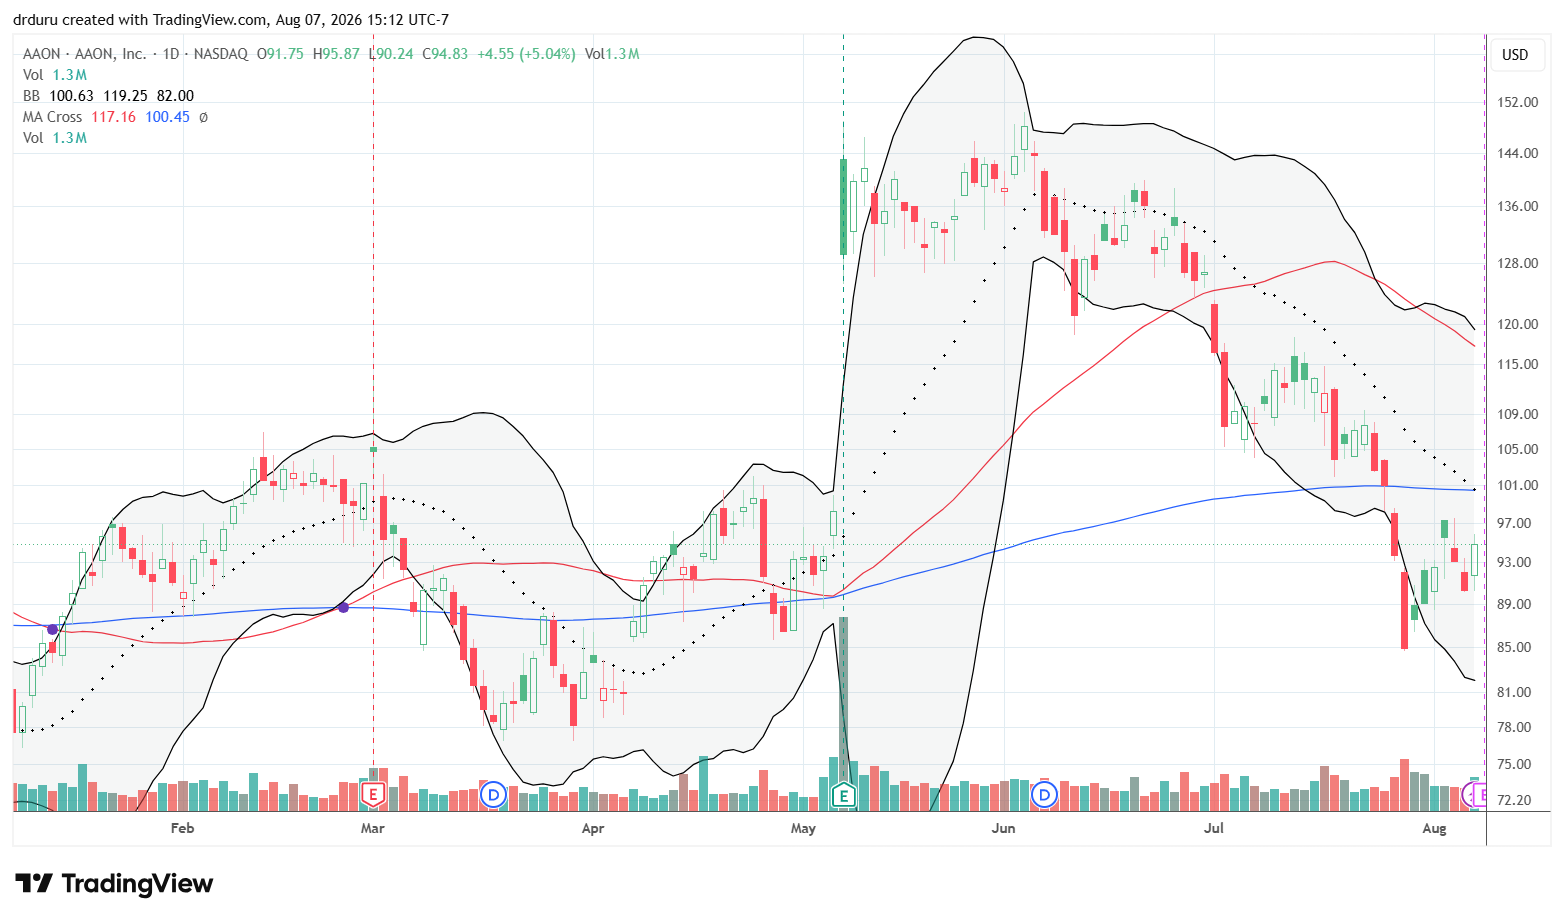
AAON (AAON)
Description: AAON manufactures energy-efficient commercial HVAC systems, including specialized cooling equipment for data centers.
Technical status: AAON (AAON) broke down below its 200DMA, dropping to April levels before rebounding just short of 200DMA resistance.
Trade commentary: AAON also made a complete recovery from the AI crash. However, the stock’s approach to upcoming earnings looks very tenuous. Selling from here would confirm the stock’s bearish position under converged 20DMA and 200DMA resistance.
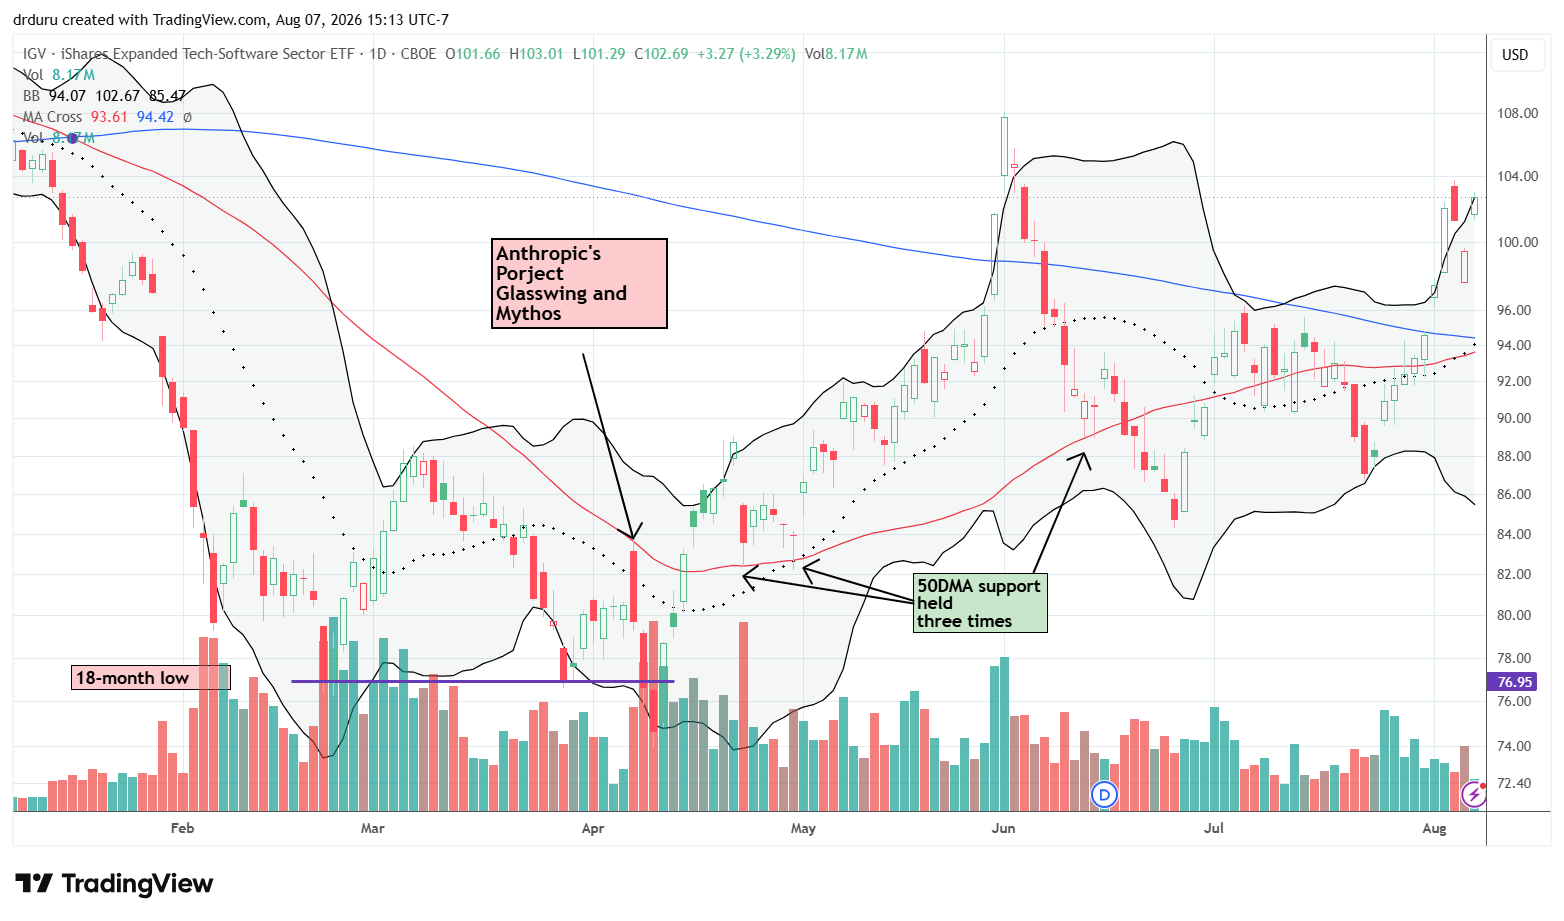
iShares Expanded Tech-Software Sector ETF (IGV)
Description: IGV tracks North American software companies along with selected interactive-media and digital-services businesses.
Technical status: The iShares Expanded Tech-Software Sector ETF (IGV) broke out above its 50DMA and 200DMA, but fell short of challenging its parabolic June high.
Trade commentary: IGV started the week with an impressive 200DMA breakout. After stumbling midweek, IGV soared Friday for a 3.3% gain and a 2-month high. I am watching closely for a breakout that finishes reversing losses for the year.
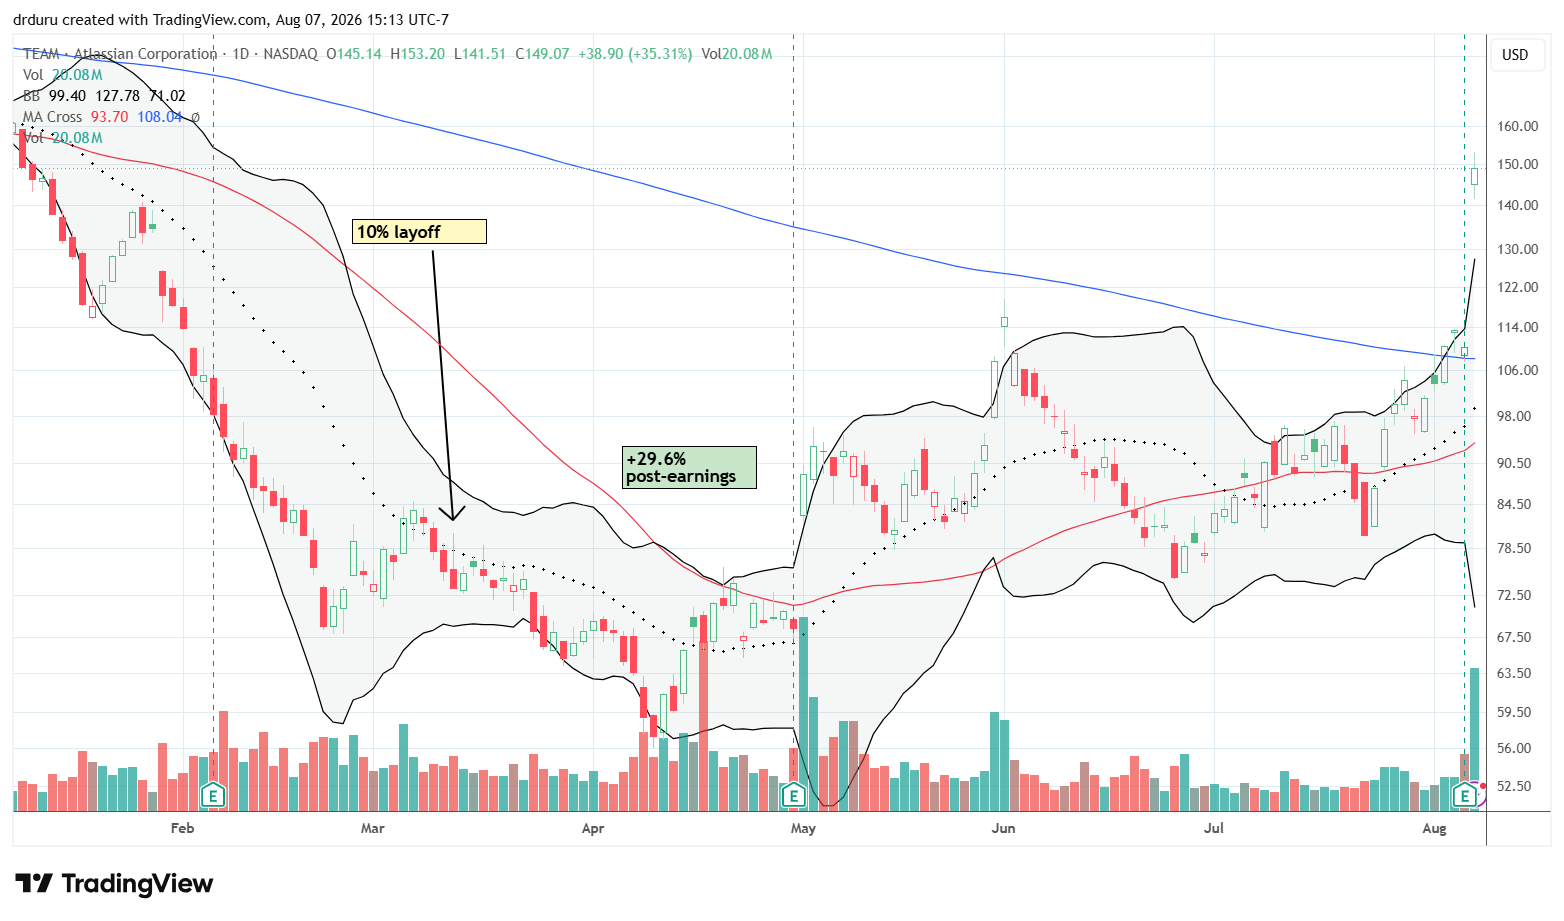
Atlassian (TEAM)
Description: Atlassian develops collaboration and work-management software including Jira, Confluence and Loom.
Technical status: Atlassian (TEAM) skyrocketed above its 200DMA and upper Bollinger Band after a 35.3% post-earnings surge that nearly brought the stock to flat for the year.
Trade commentary: Atlassian delivered an exclamation point for the fresh software rally. As a high conviction position for my PAIROS trade, TEAM delivered resounding validation and a strong counter to the AI Panic producing the SaaSpocalypse while finishing a reversal of most of its year-to-date loss. Unfortunately, I had gotten into such a regular habit of selling calls against my position that I misread the growing bullishness ahead of last week’s earnings. I left a lot of money on the table even as I sold my remaining shares in the after hours with the stock up about 30%. TEAM is now way over-extended above its upper Bollinger Band but is a good buy-the-dip candidate. Needless to say, I made sure that I have no other call options sold against high conviction positions.
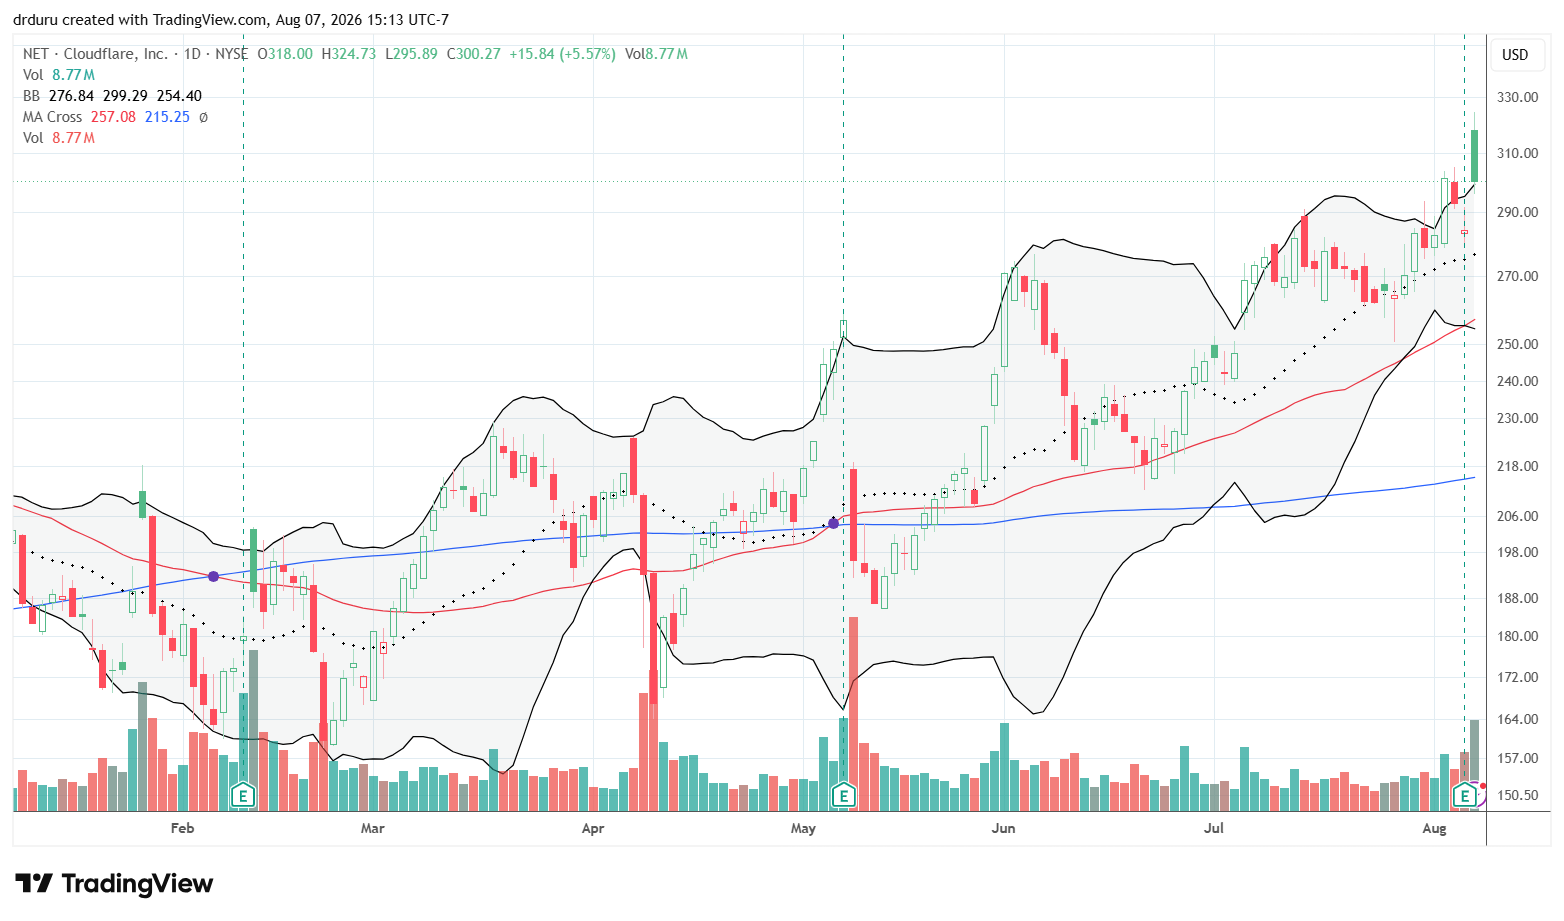
Cloudflare (NET)
Description: Cloudflare provides internet security, content delivery, networking and serverless-computing services through its global cloud platform.
Technical status: Cloudflare (NET) jumped 5.6% post-earnings but an immediate fade left the stock clinging to an all-time high.
Trade commentary: After NET crashed post-earnings in May, I concluded that NET would remain stuck in a trading range. Instead, the stock soon reversed those losses and moved to an all-time high. Last week, the stock gapped and crapped from a post-earnings all-time high (intraday). I wish the stock was not so expensive; otherwise, I would love to buy and hold.
According to Reuters, Cloudflare reported 36% revenue growth to $696 million and raised its full-year revenue and earnings forecasts. Management attributed the acceleration to AI agents, developer adoption and growing usage of its Workers platform.
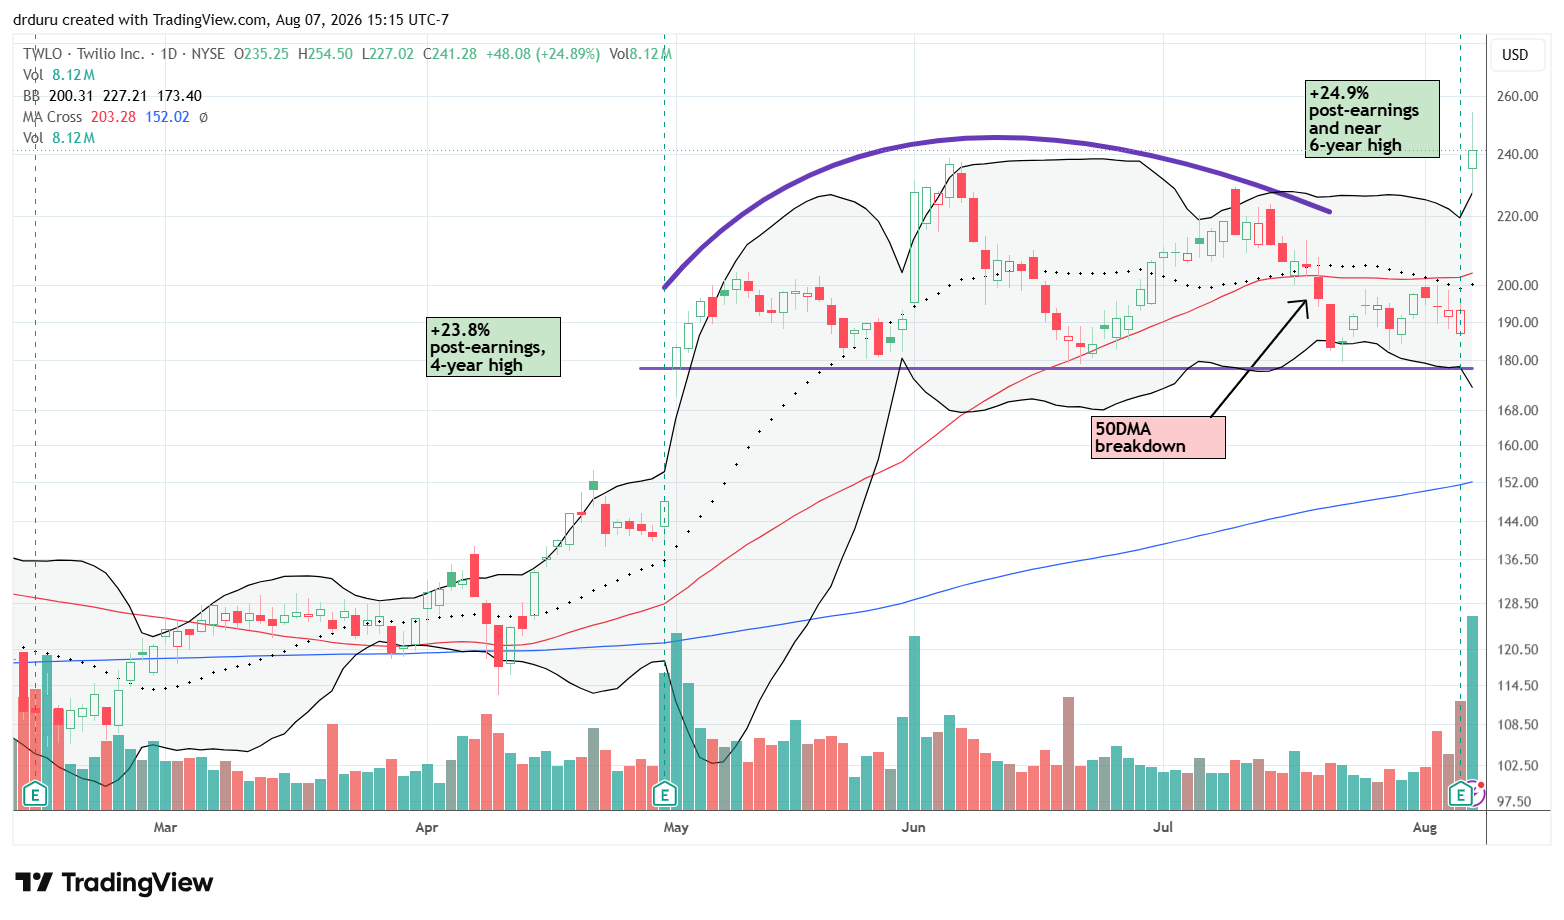
Twilio (TWLO)
Description: Twilio provides cloud-based communications APIs and customer-engagement software for messaging, voice, email and authentication.
Technical status: Twilio (TWLO) surged 24.9% post-earnings and invalidated a topping pattern with a near 6-year high.
Trade commentary: Trading in TWLO has just been too choppy for me to stick with the trade/investment. This latest abrupt move threw me for another loop. The near 6-year high following earnings invalidated the last topping pattern and reaffirms the stock’s bullishness.
Twilio reported that revenue increased 22% to $1.50 billion, while organic growth accelerated to 17%. Management raised full-year reported revenue-growth guidance to 18%–18.5% and highlighted early traction for Voice AI.
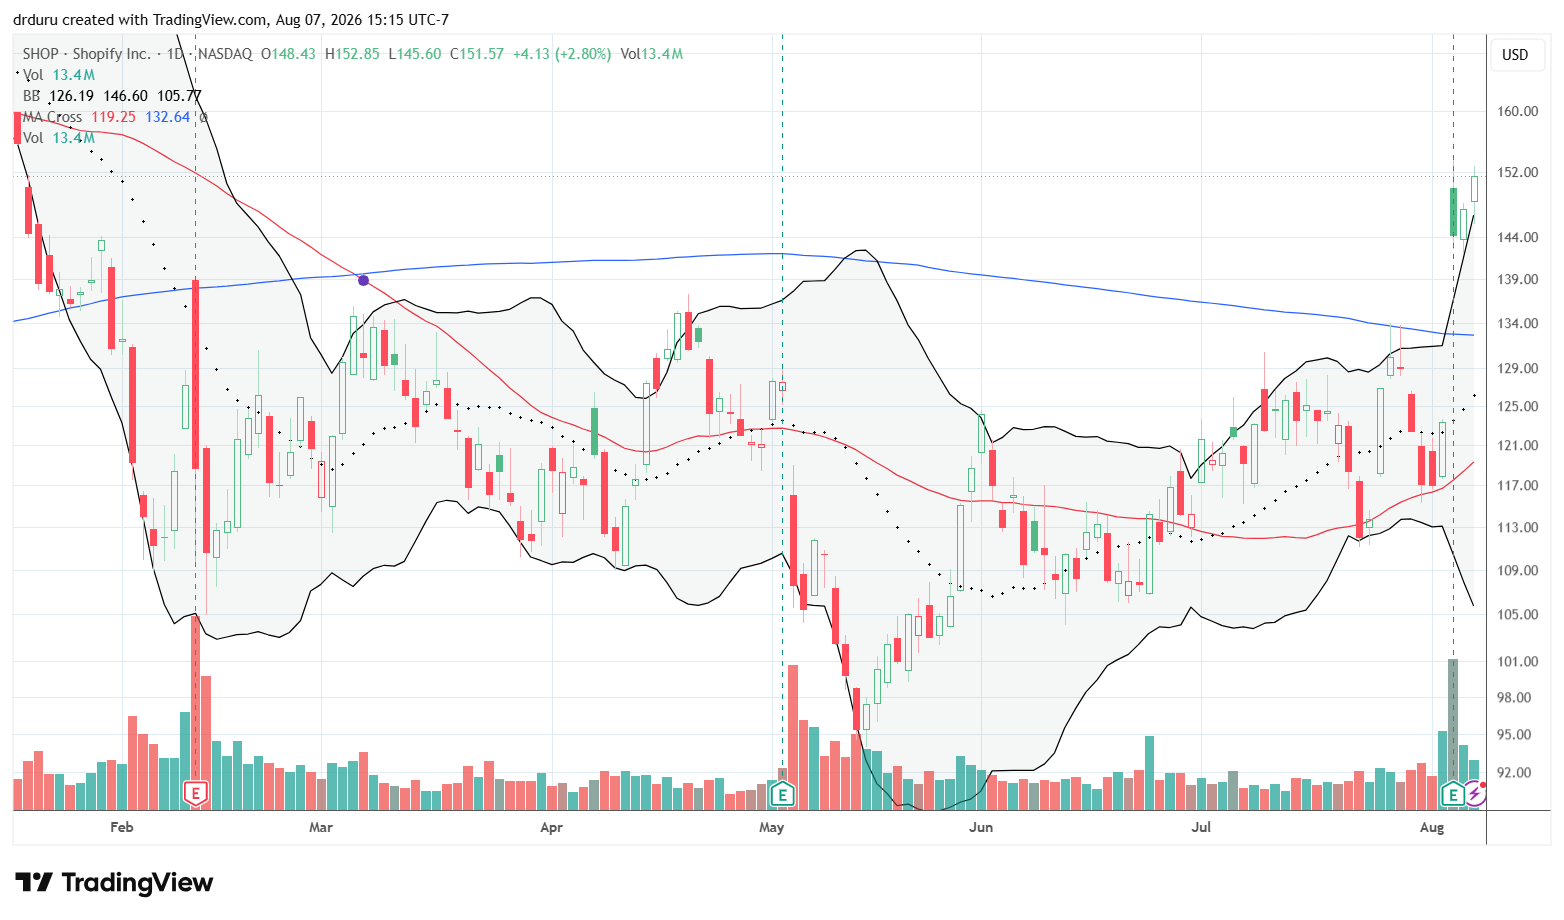
Shopify (SHOP)
Description: Shopify provides cloud-based commerce software, payments and merchant services to businesses of all sizes.
Technical status: Shopify (SHOP) jumped 17.0% post-earnings to a 200DMA breakout and 6-month high.
Trade commentary: SHOP is another stock that has been too choppy for me. The latest chop took the stock clear above 200DMA resistance and back into bullish territory. The strong close on Friday suggests the stock will not pullback anytime soon.
Shopify reported 34% revenue growth to $3.58 billion and 32% growth in gross merchandise volume. Management projected another quarter of revenue growth in the low-thirties percentage range.
AppLovin (APP)
Description: AppLovin operates an AI-driven advertising and marketing platform focused on mobile applications and digital commerce.
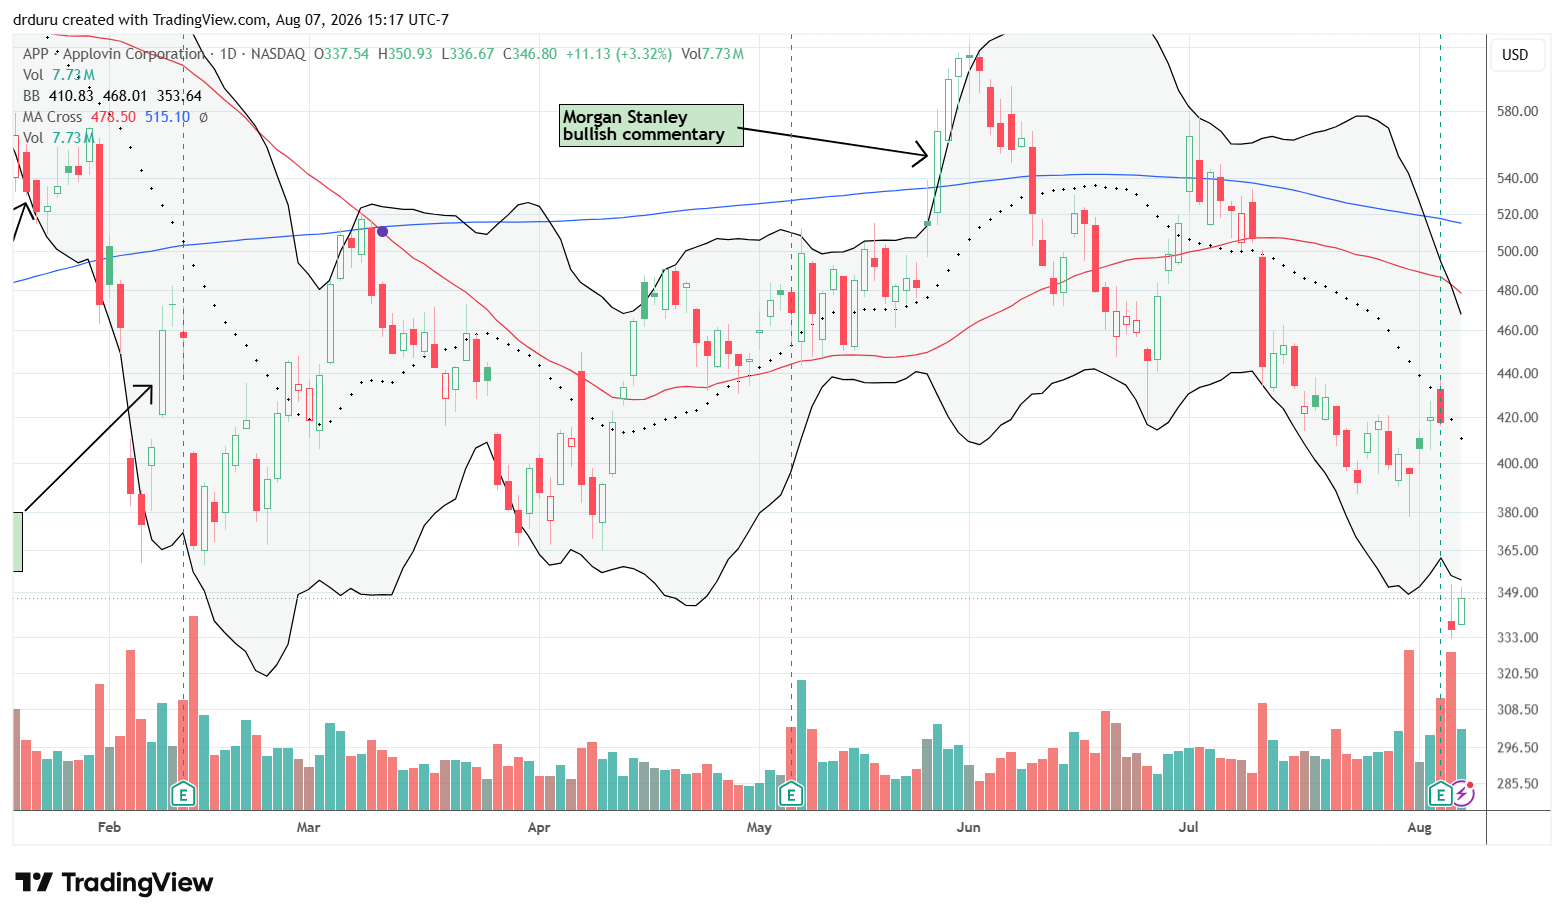
Technical status: AppLovin (APP) dropped to a 52-week low after a 19.7% post-earnings plunge.
Trade commentary: AppLovin provided the major exception to last week’s software surge. The company reported that revenue increased 53% to $1.92 billion, but it missed expectations, adjusted EBITDA fell just below guidance, and management acknowledged slower progress on its next advertising model. The subsequent breakdown to a 52-week low put the stock in bearish territory. A new post-earnings closing low gets me interested in APP put spreads.
Unity Software (U)
Description: Unity provides real-time 3D development tools and advertising technology for games, applications and interactive content.
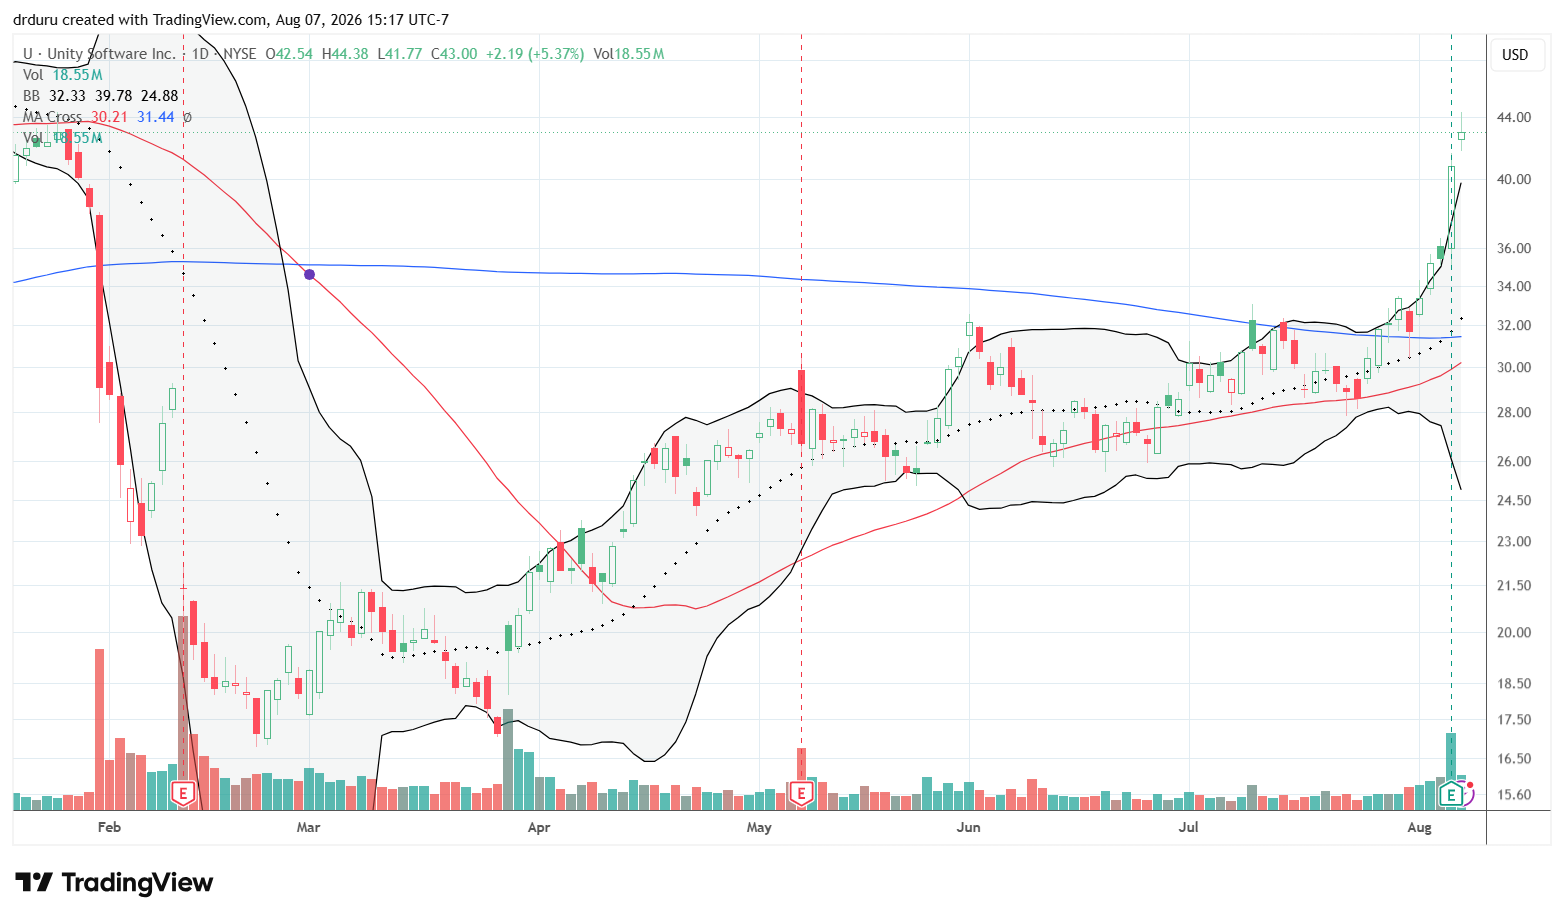
Technical status: Unity Software (U) extended a parabolic move with a 15.1% post-earnings surge that nearly brought the stock to flat for the year.
Trade commentary: Unity reported that revenue increased 24% to $546 million, with strategic revenue up 38% and adjusted EBITDA reaching $160 million. Its Vector advertising platform accelerated to a revenue run rate above $1 billion, helping Grow Solutions revenue jump sharply. If not for upcoming earnings, I would have bought the 200DMA breakout the previous week. Now, I wait for a dip to buy. Friday’s buying follow-through suggests a significant dip will be a long time coming.
JFrog (FROG)
Description: JFrog provides software-supply-chain, DevOps and security tools used to manage and distribute software packages and AI models.
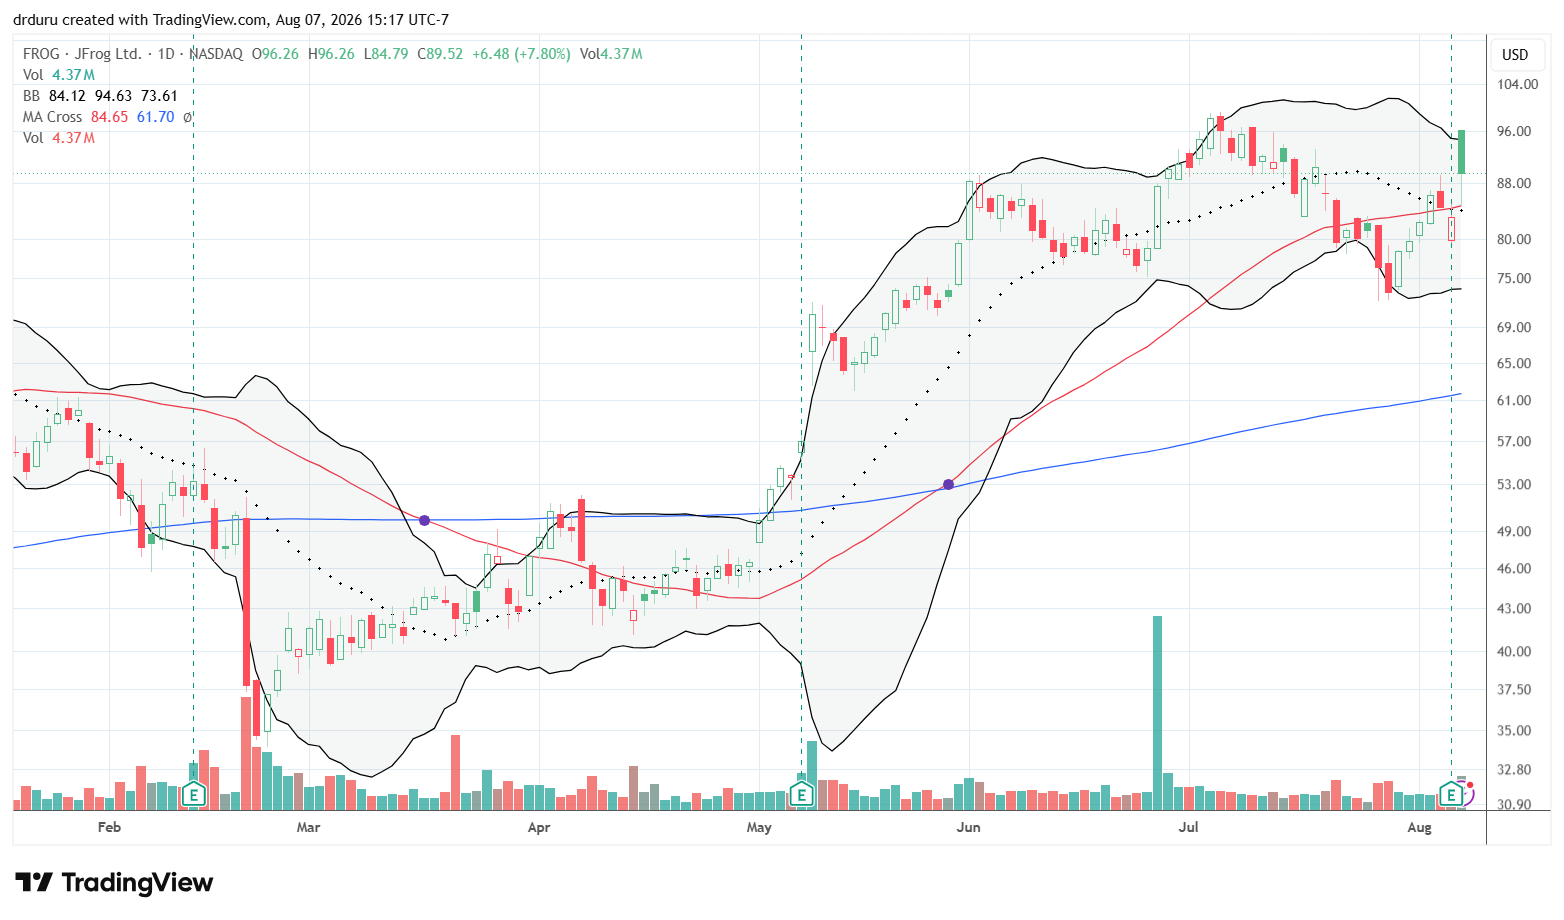
Technical status: JFrog (FROG) gained 7.8% post-earnings but faded from its all-time high.
Trade commentary: FROG is yet another tech stock that gapped and crapped post-earnings right at or under critical resistance. The stock looks positioned to fill its post-earnings gains with a fresh test of 50DMA support. On Friday, the stock bounced intraday from 200DMA support.
JFrog reported 29% revenue growth to $163.8 million, while cloud revenue surged 53% and exceeded half of total revenue. Net-dollar retention improved to 121%, and free cash flow reached $53.7 million.
Teradata (TDC)
Description: Teradata provides enterprise data warehousing, analytics and cloud data-management software.
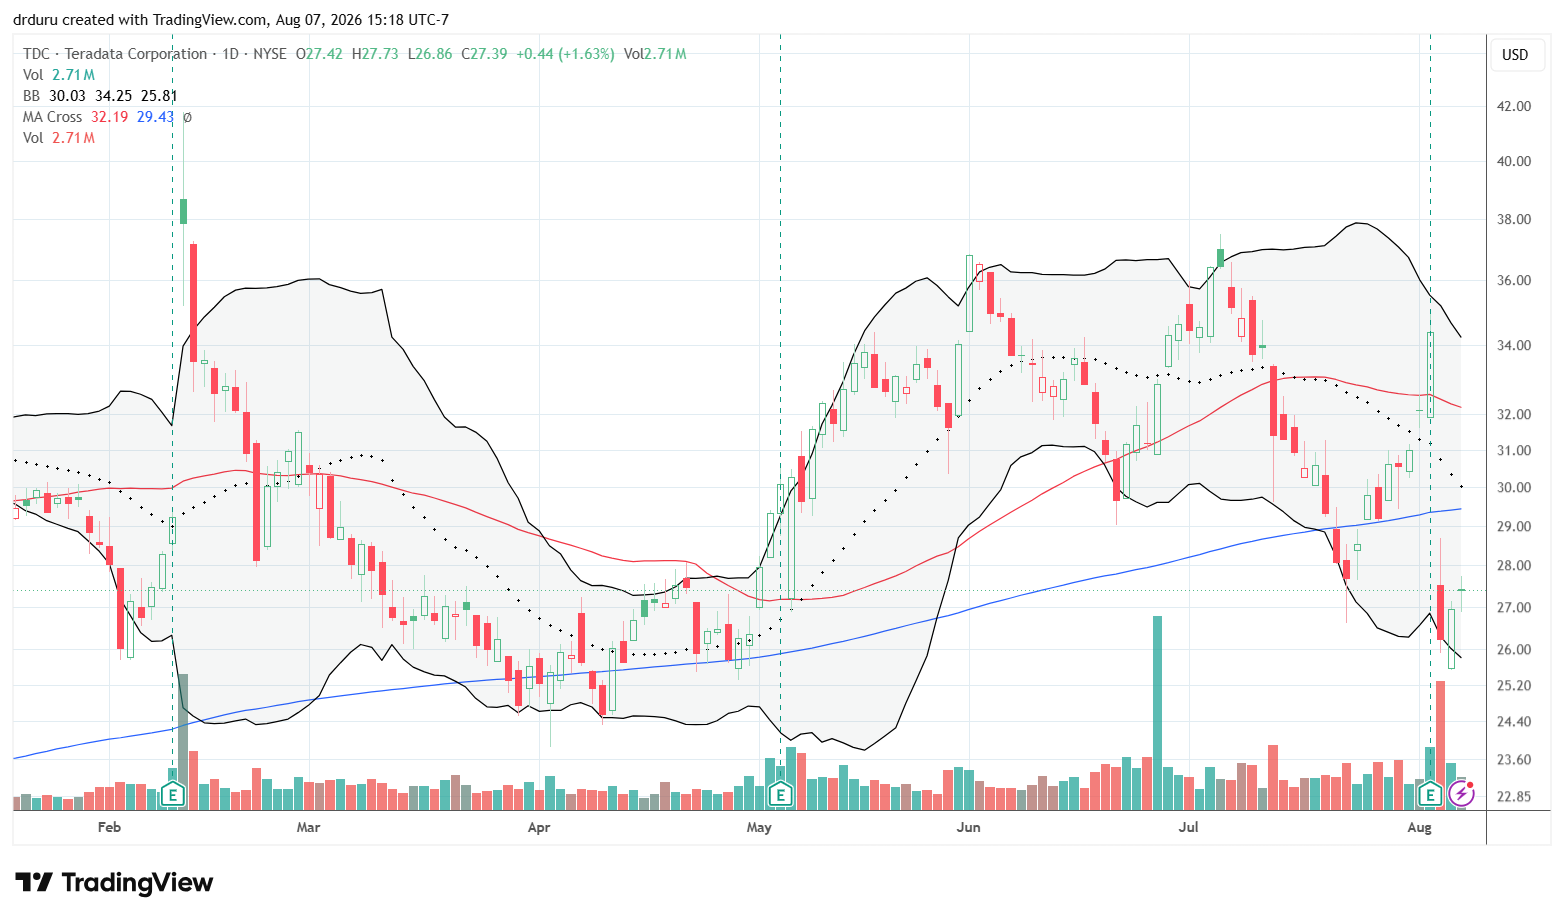
Technical status: Teradata (TDC) crashed 23.7% post-earnings but avoided a new low for the year.
Trade commentary: See my earnings review on Seeking Alpha for more details.
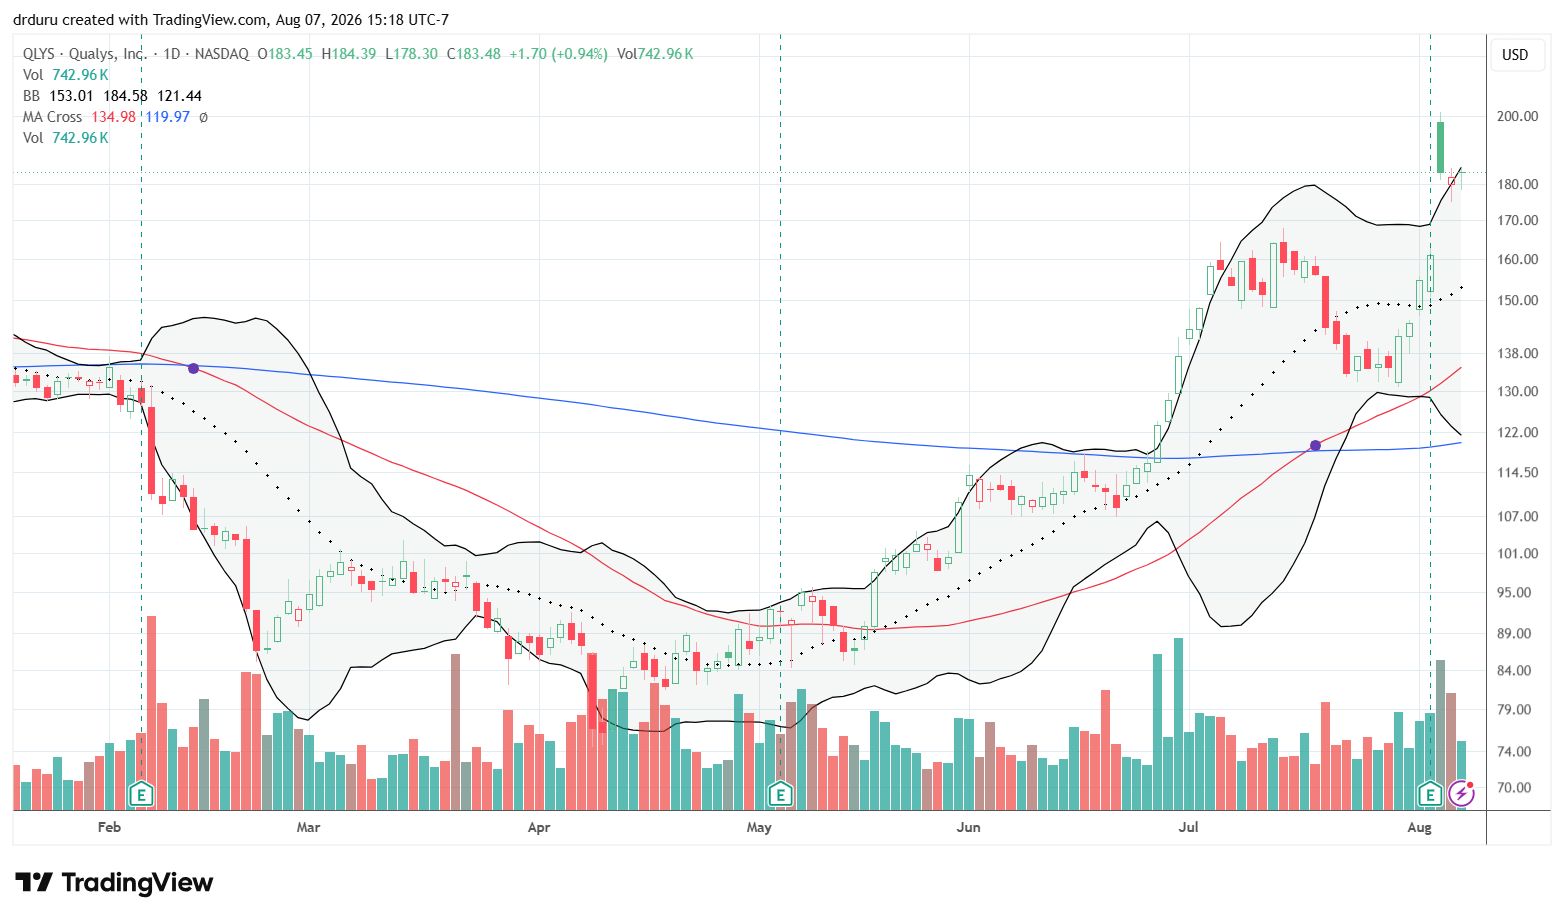
Qualys (QLYS)
Description: Qualys provides cloud-based cybersecurity, vulnerability-management and compliance software.
Technical status: Qualys (QLYS) gained 13.8% post-earnings but faded from its all-time high.
Trade commentary: QLYS gapped and crapped but closed the week above its former all-time high. Thus, the stock is a buy candidate with a tight stop below Thursday’s intraday low around $175.
Qualys reported 11% year-over-year revenue growth to $182.2 million and adjusted earnings of $1.98 per share. Billings increased 16%, while operating cash flow surged 77%. The company increased guidance as follows:
“Full Year 2026 Guidance: Management now expects revenues for the full year of 2026 to be in the range of $732.0 million to $738.0 million, representing 9% to 10% growth over 2025. This compares to the previous guidance range of $721.0 million to $727.0 million. GAAP net income per diluted share is now expected to be in the range of $5.76 to $5.90, up from the previous guidance range of $5.40 to $5.61. This assumes an effective income tax rate of 21%. Non-GAAP net income per diluted share is now expected to be in the range of $7.74 to $7.88, up from the previous guidance range of $7.44 to $7.65. This assumes a non-GAAP effective income tax rate of 20%. Full year 2026 net income per diluted share estimates are based on approximately 35.2 million weighted average diluted shares outstanding.”
Gartner (IT)
Description: Gartner provides technology research, market analysis, conferences and consulting services to business executives.
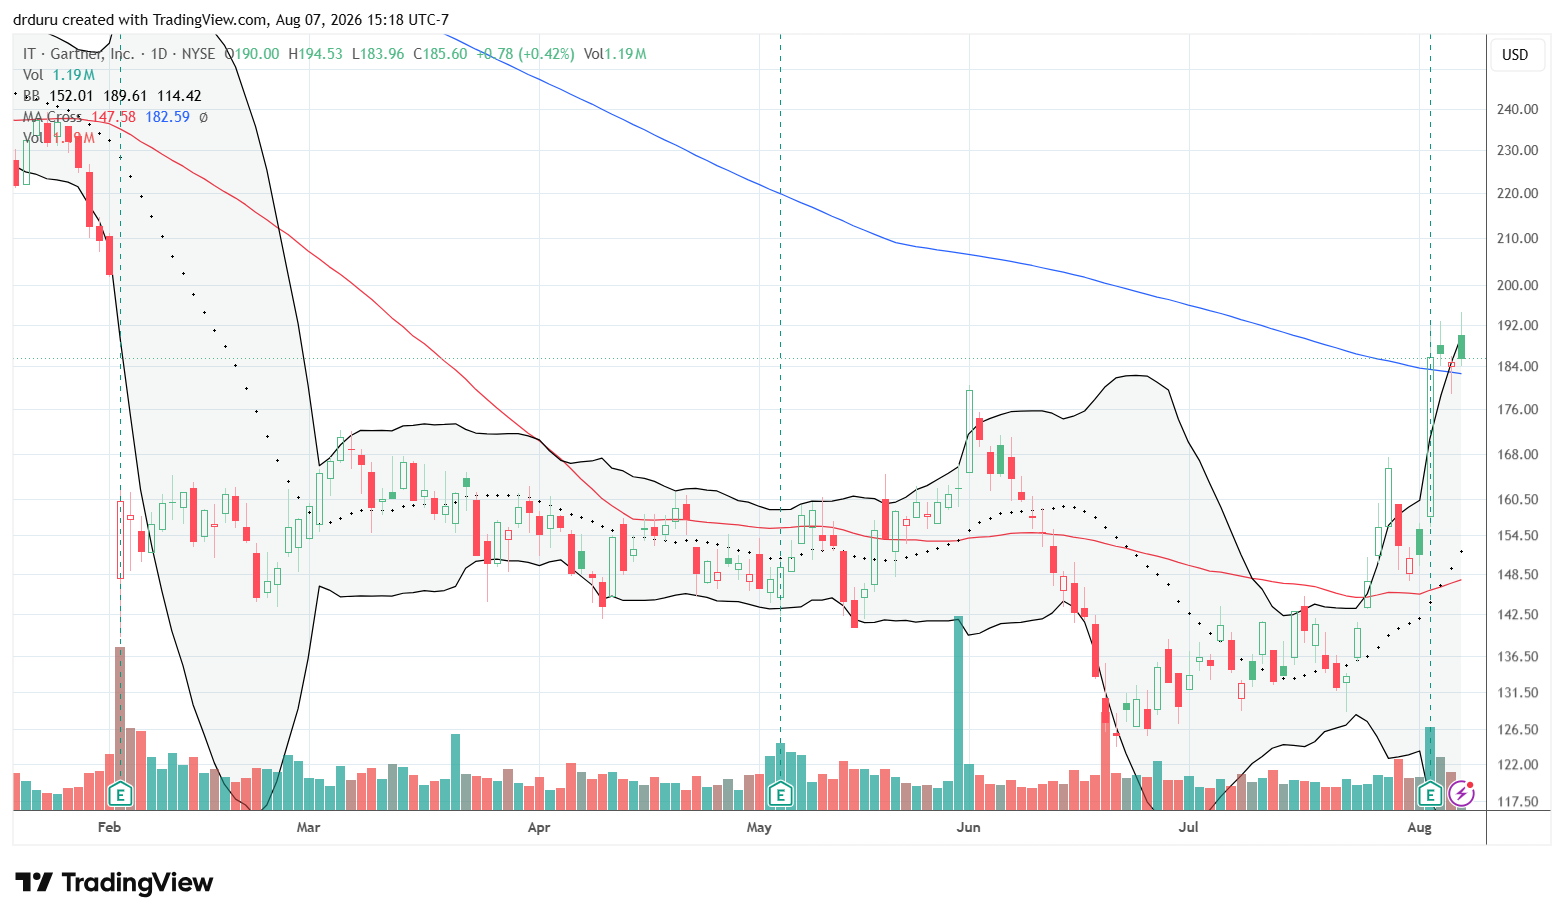
Technical status: Gartner (IT) surged 22.6% post-earnings and held on to a 200DMA breakout.
Trade commentary: My decision to cling to IT position despite June’s sell-off paid off last week. The stock is now positioned to carve out a sustained bottom with a post-earnings 200DMA breakout.
Gartner reported that adjusted earnings increased 24% to $4.37 per share despite reported revenue declining slightly because of a divested operation. Contract-value growth accelerated for a second consecutive quarter and improved to 3.3% when the U.S. federal government was excluded.
Thomson Reuters (TRI)
Description: Thomson Reuters provides information, workflow software and news services to legal, tax, accounting, compliance and media professionals.
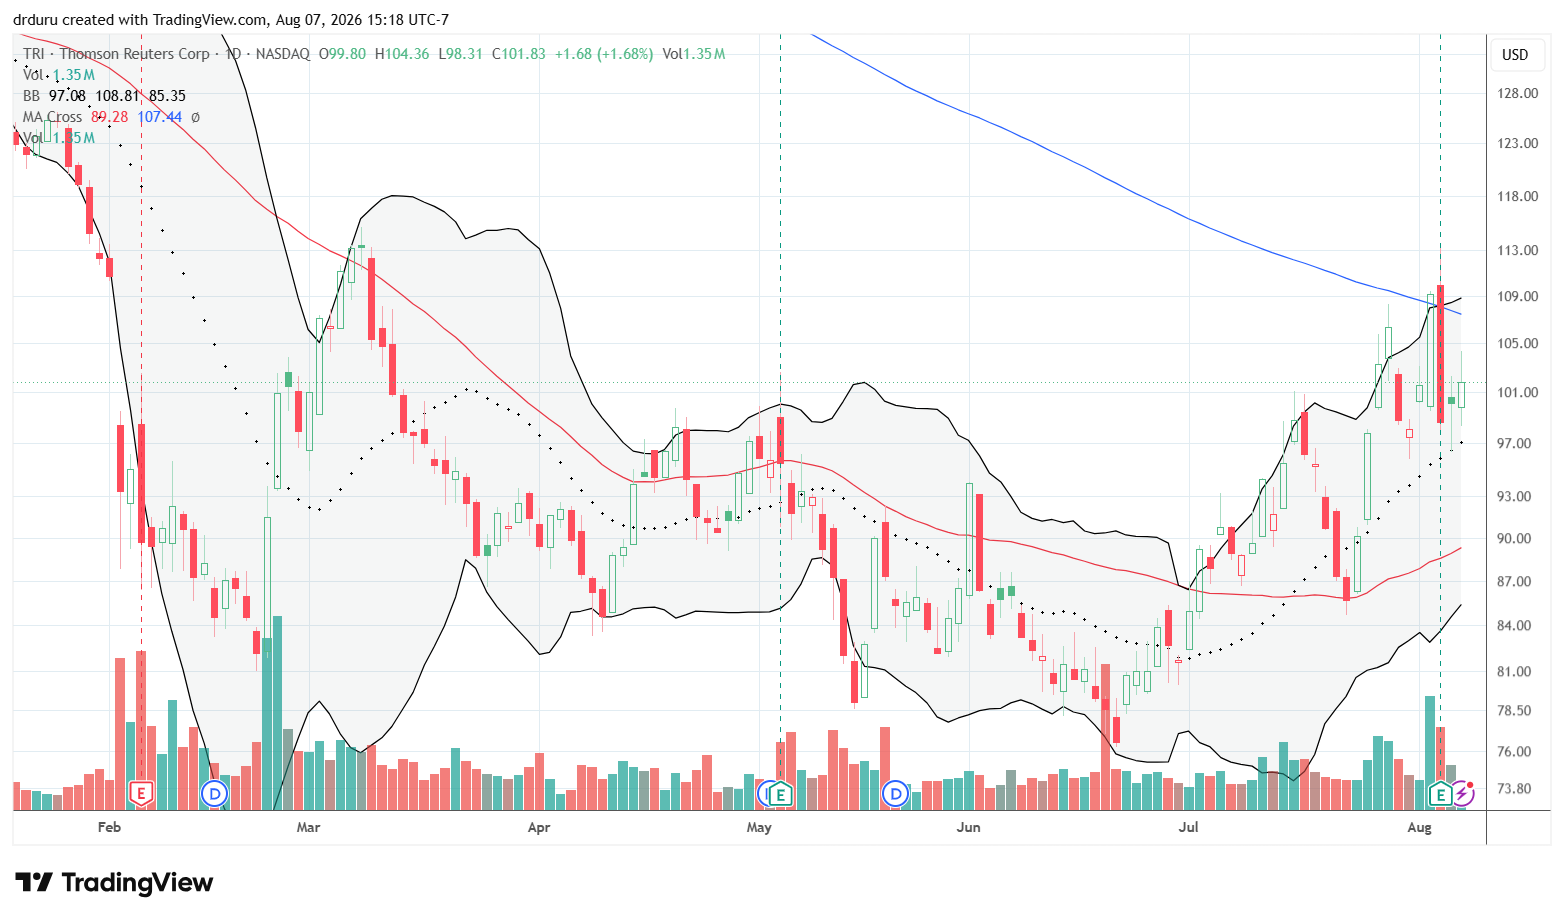
Technical status: Thomson Reuters (TRI) faded from 200DMa resistance with a 9.7% post-earnings loss.
Trade commentary: TRI was almost the reverse of IT. The stock’s post-earnings fade from 200DMA resistance left a sustained bottom hanging in doubt. I am holding for now as a still successful trade playing a bounce from 50DMA support last month.
Thomson Reuters raised its full-year organic revenue-growth forecast to approximately 8% after second-quarter revenue rose 9% to $1.95 billion. Management said its proprietary Thomson AI model outperformed several major external models on professional tasks, while generative-AI products represented 32% of contract value. These results tell me that TRI is another oversold victim of the AI Panic. I will soon make a more detailed review using my PAIROS model.
Zoom Communications (ZM)
Description: Zoom provides video meetings, workplace collaboration, cloud telephony and AI-enabled business communications software.
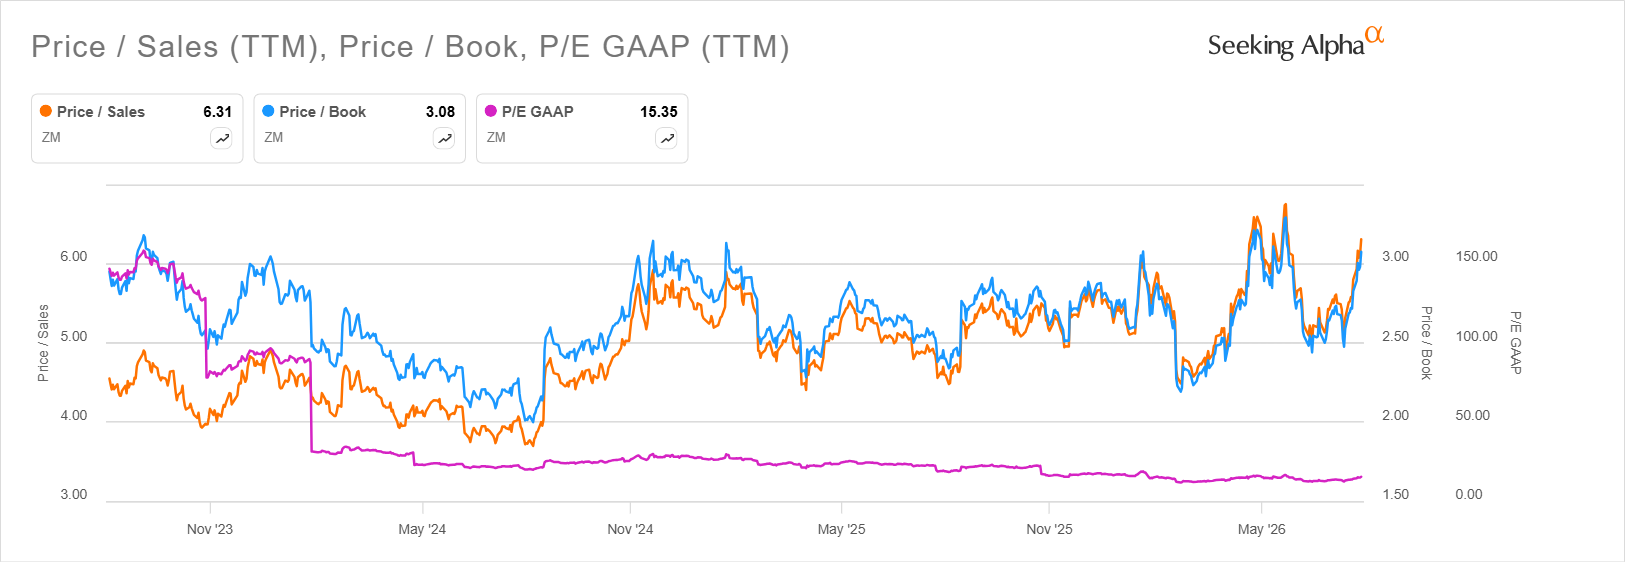
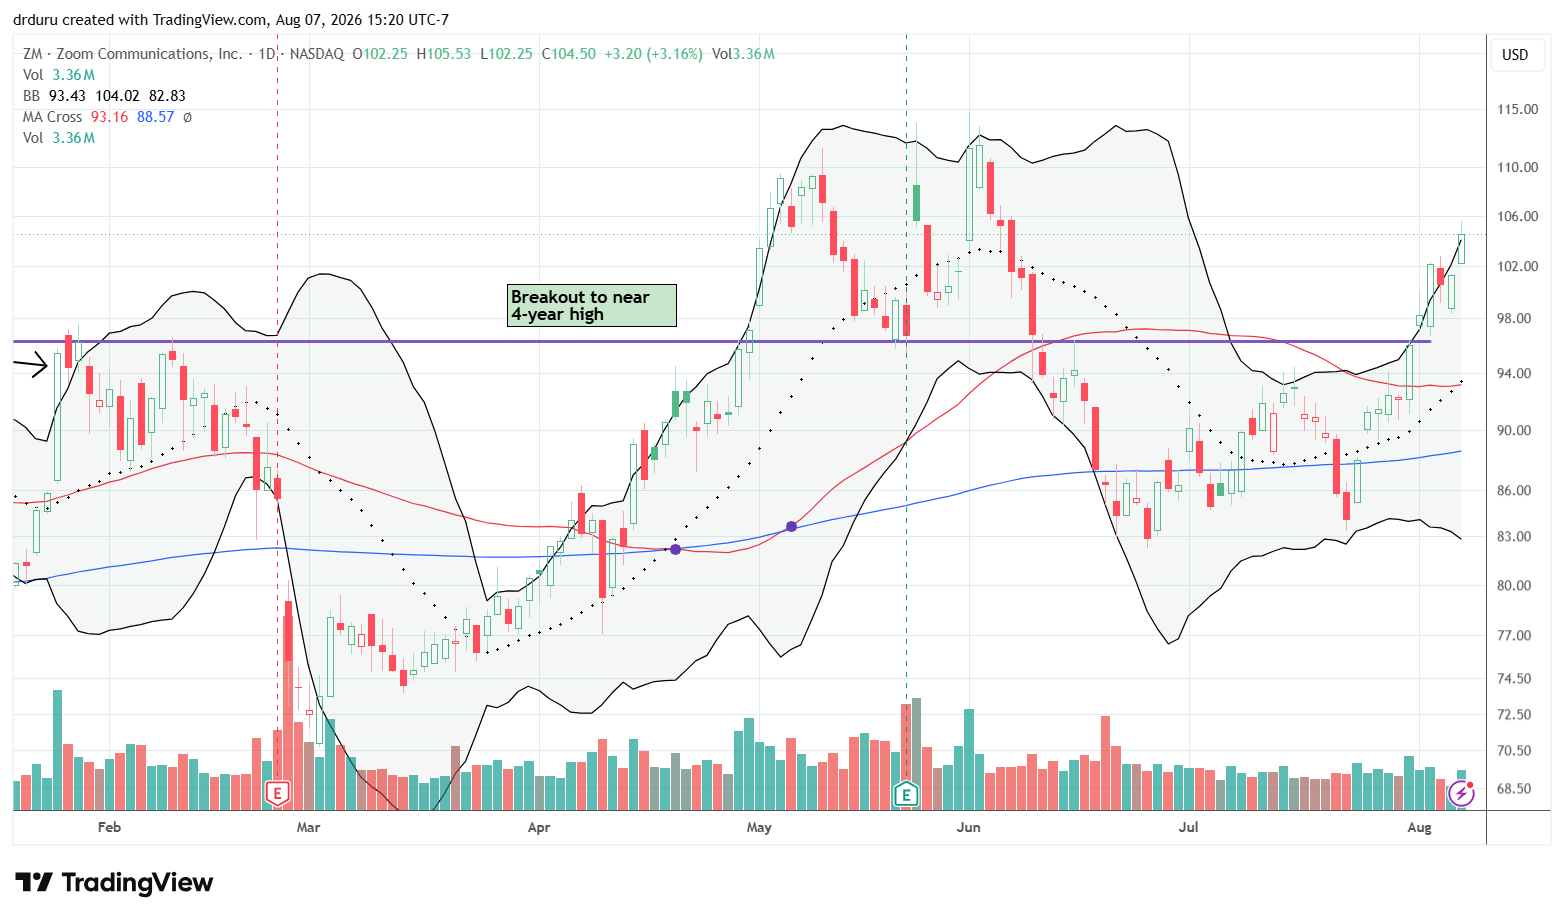
Technical status: Zoom Communications (ZM) broke out above resistance from its former 4-year high as part of an ongoing rebound.
Trade commentary: Here I go again with ZM. My price alerts got me back into the stock with last week’s breakout. I bought shares and flipped call options. ZM’s valuation (price/earnings) gets cheaper and cheaper with time. This latest breakout motivates me to add call options back into the mix ahead of upcoming earnings (August 25).
Elastic (ESTC)
Description: Elastic provides search, observability, security and AI-data-retrieval software built around the Elasticsearch platform.
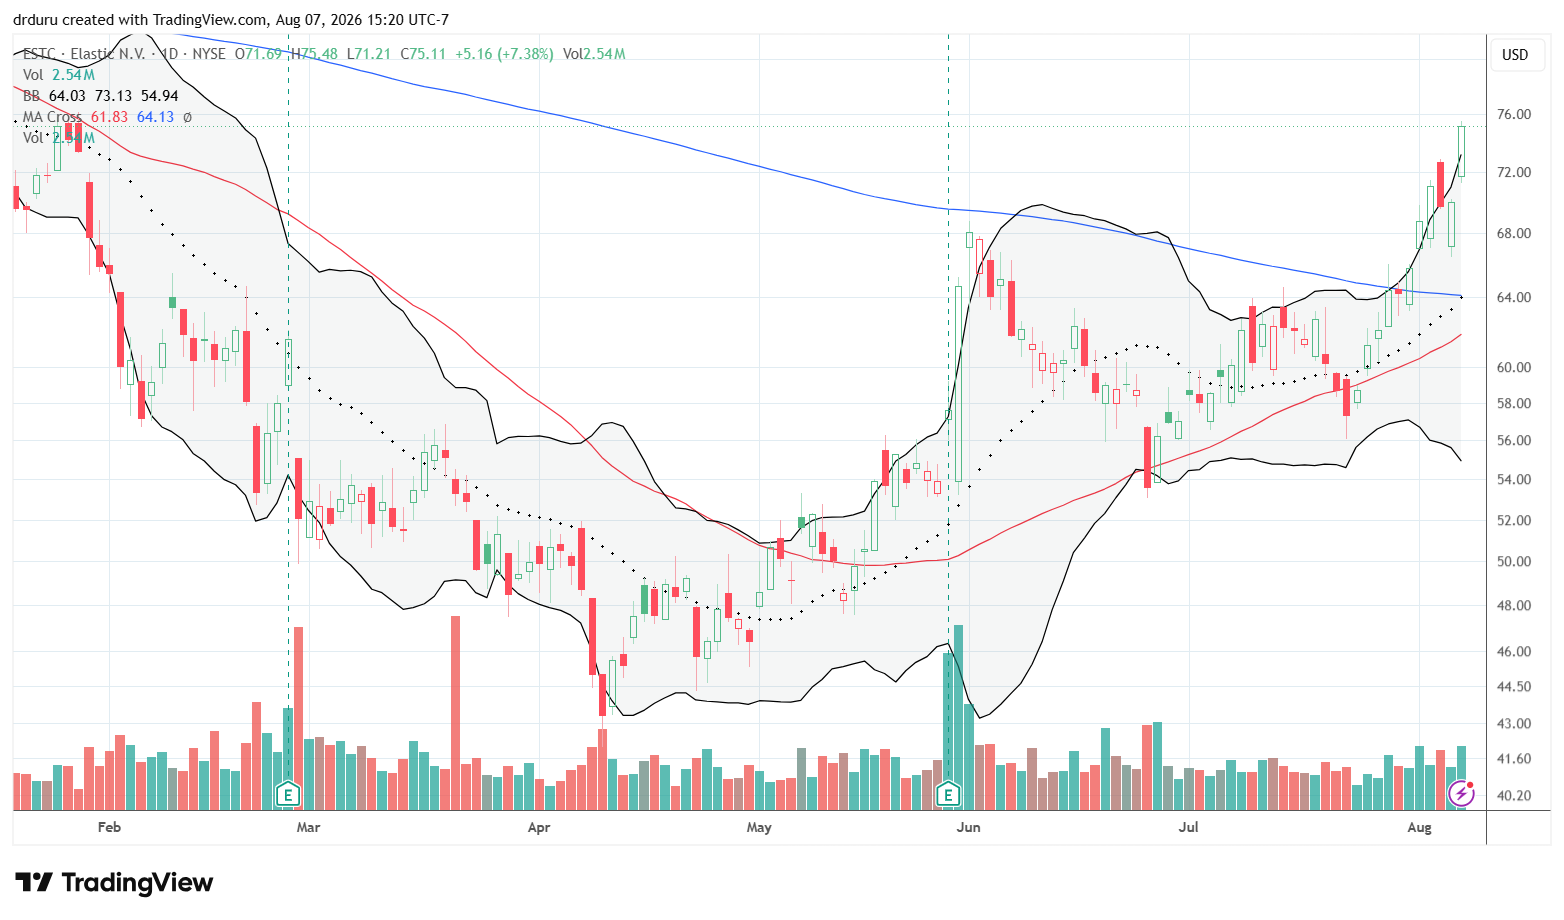
Technical status: Elastic (ESTC) confirmed a 200DMA breakout as post-earnings momentum pushed the stock to flat for the year.
Trade commentary: I stuck to my trading trigger on ESTC and am now benefiting from the resounding 200DMA breakout. With a flat year-to-date performance in view, I am readying to add to my position on future dips.
Hertz Global Holdings (HTZ)
Description: Hertz operates vehicle-rental brands and manages a large fleet of cars sold through rental and used-vehicle channels.
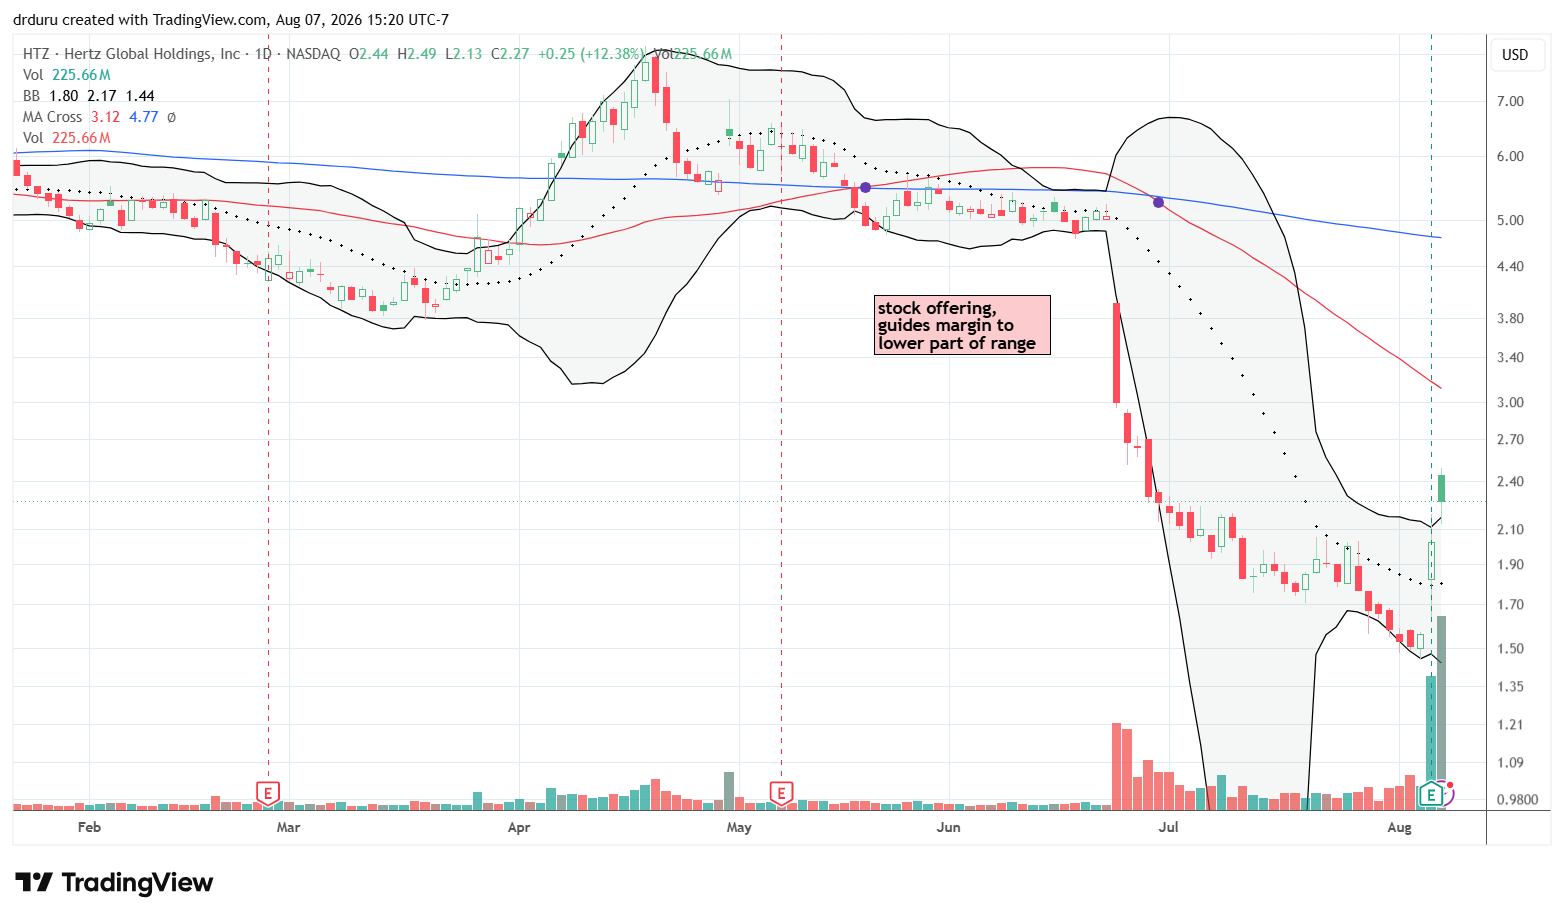
Technical status: Hertz Global Holdings (HTZ) came back to life with a 29.5% post-earnings surge and follow-through buying.
Trade commentary: It is finally time to put aside my bearish inclinations on HTZ. The company reported an adjusted loss of $0.11 per share on $2.4 billion in revenue. Revenue per rental unit increased 8%, and adjusted EBITDA reached the high end of management’s guidance. The subsequent price surge put an abrupt end to the stock’s slide. The stock looks like a buy on the dips with a first upside profit target at 50DMA resistance.
TrueBlue (TBI)
Description: TrueBlue provides temporary staffing, workforce-management and recruitment services through brands including PeopleReady and PeopleScout.
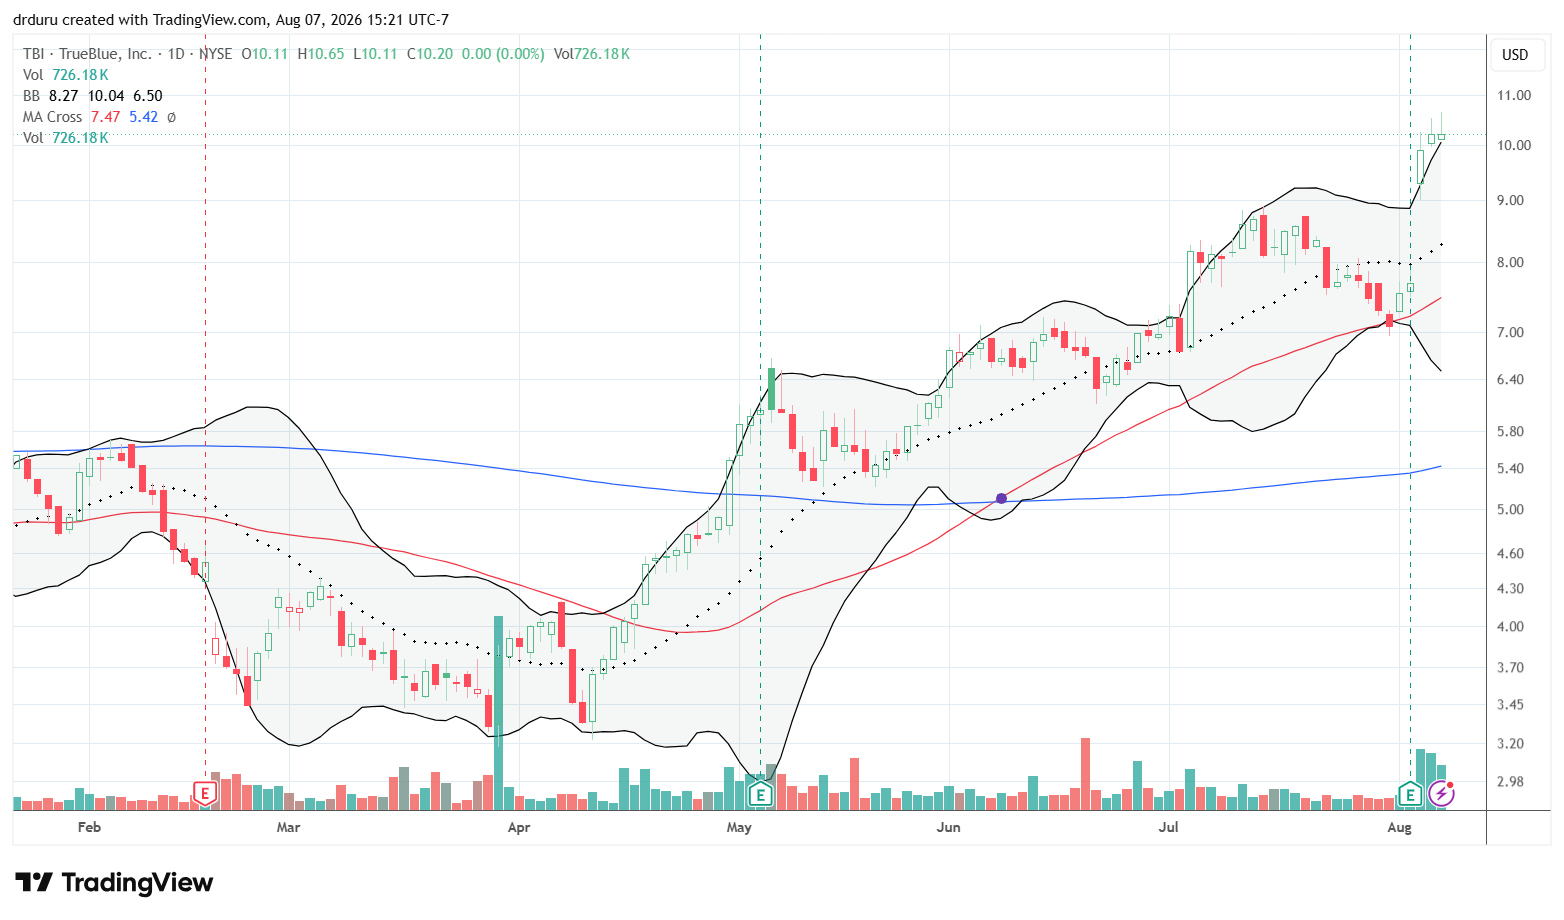
Technical status: TrueBlue (TBI) achieved a 2-year high after a 28.7% post-earnings surge.
Trade commentary: TrueBlue is a new company to me. Its big post-earnings move on high trading volume put the stock on my radar. The company reported that revenue increased 12% to $443 million and adjusted EBITDA rose to $11 million from $3 million. Adjusted earnings of $0.06 per share beat “expectations” for a loss. Ironically, the company reported stronger results days before the July jobs numbers came in well under economist consensus.
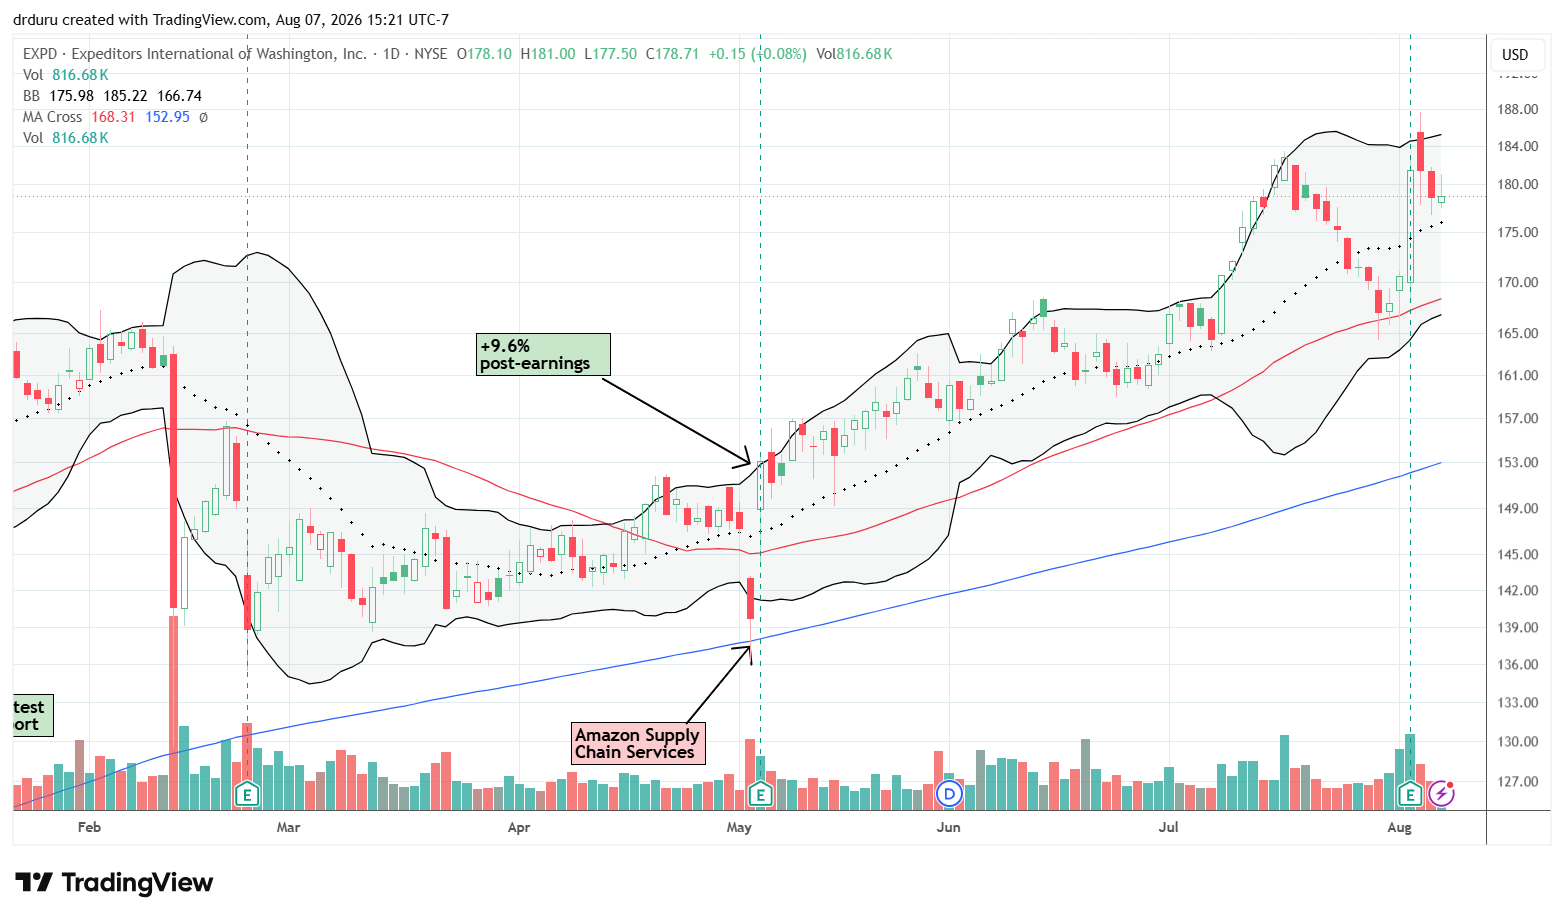
Expeditors International of Washington (EXPD)
Description: Expeditors provides international freight forwarding, customs brokerage and supply-chain logistics services.
Technical status: Expeditors International of Washington (EXPD) confirmed 50DMA support with a 6.4% post-earnings jump.
Trade commentary: EXPD has steadily recovered from February’s AI panic in trucking and logistics stocks. Unfortunately, the stock could not hold a new all-time high following its 6.4% post-earnings gain. Still, I am actively looking to buy the stock on a fresh test of 20DMA and/or 50DMA uptrending support. (I really should have bought the stock after May earnings).
Expeditors reported a 32% revenue increase to $3.50 billion and a 51% increase in earnings to $2.03 per share. Airfreight tonnage grew 14%, ocean-container volume remained flat, and customs-related businesses posted another quarter of double-digit growth.
DoorDash (DASH)
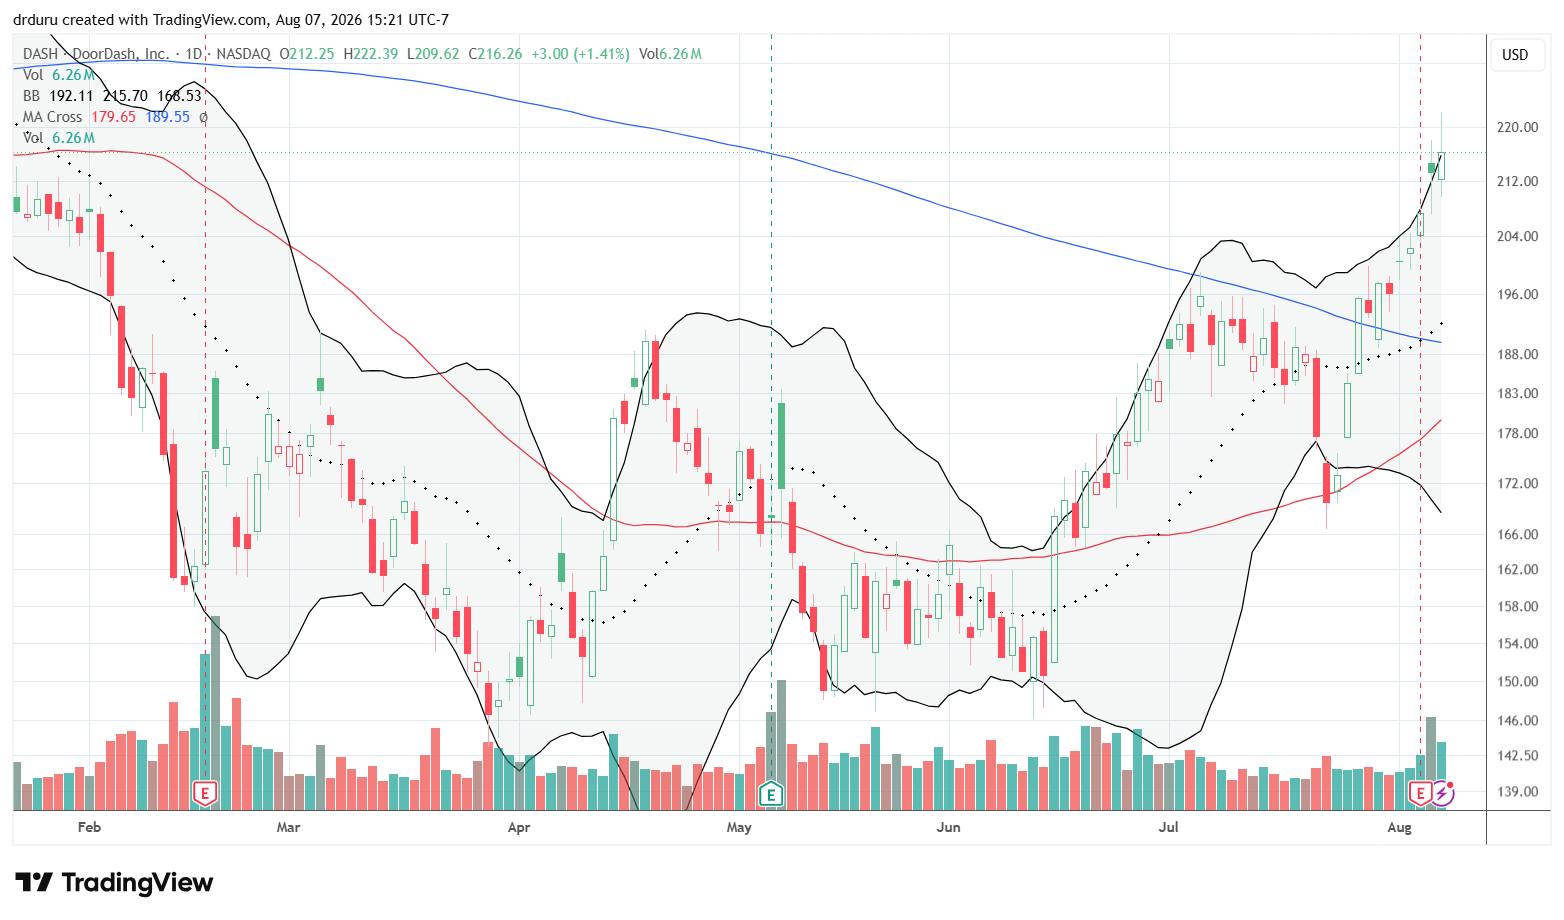
Description: DoorDash operates local delivery marketplaces connecting consumers with restaurants, retailers and independent couriers.
Technical status: DoorDash (DASH) used a 2.9% post-earnings gain to nudge closer to a flat year-to-date performance.
Trade commentary: DASH looks like it will sustain a 200DMA breakout after a positive response to its earnings report. Thus, the stock goes back to my buy-the-dip list.
DoorDash reported that revenue and marketplace gross order value both increased 36%, while total orders rose 27% to 970 million. Profit nevertheless declined to $200 million as delivery, marketing and product-development costs climbed.
The New York Times Company (NYT)
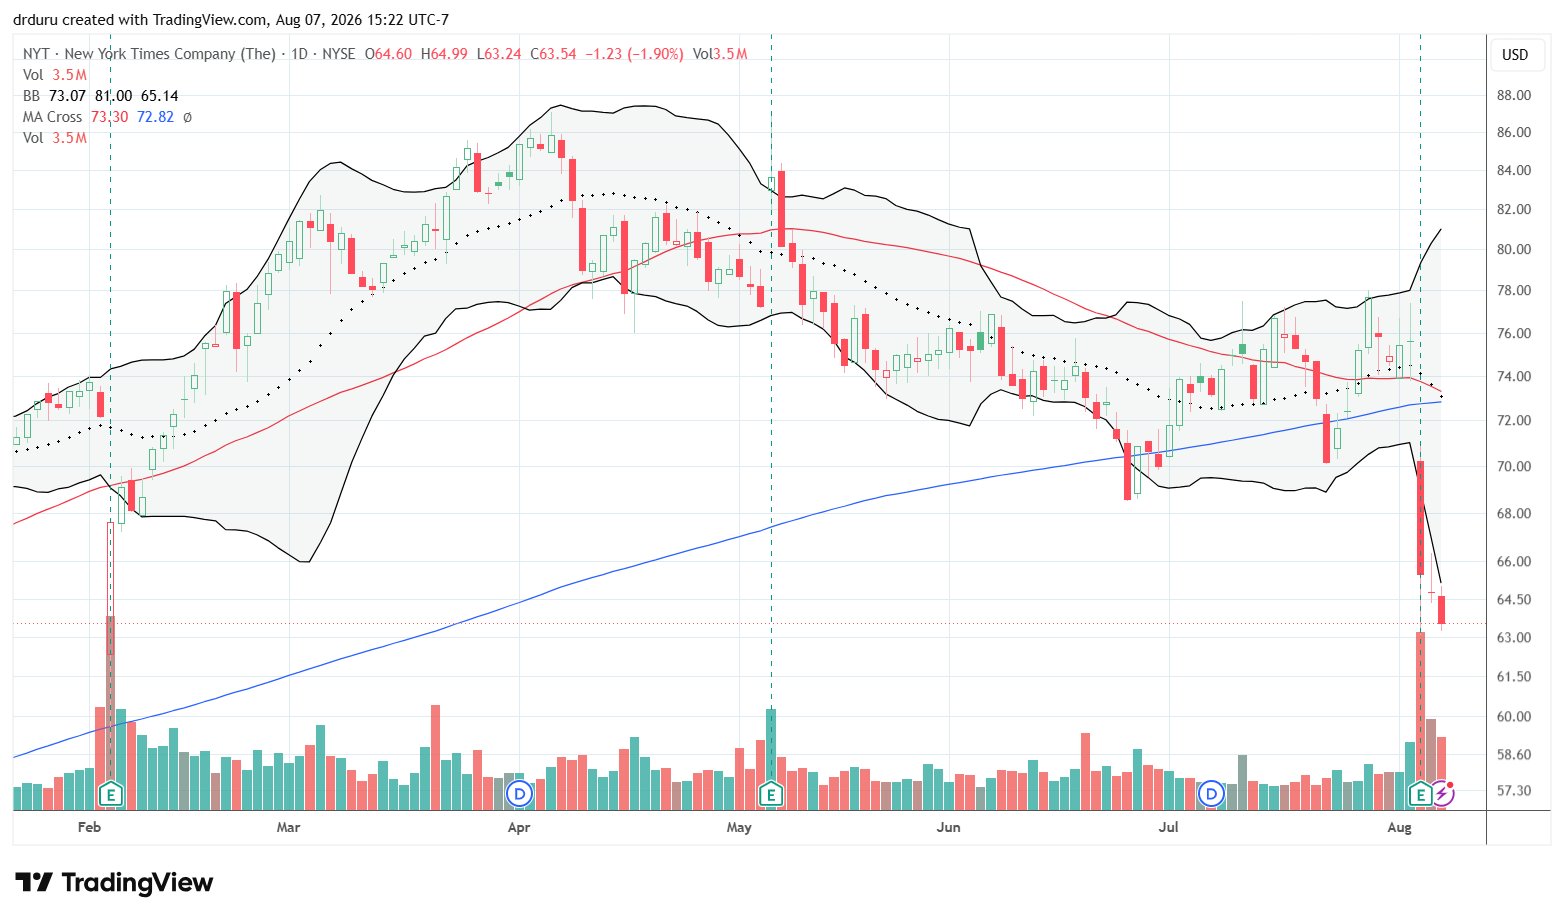
Description: The New York Times Company operates a subscription-based news, information, sports, games, cooking and product-review business.
Technical status: The New York Times Company (NYT) suffered a bearish breakdown below all its major averages with a 13.4% post-earnings loss.
Trade commentary: I almost bought NYT as an over-extended post-earnings loser. However, I decided to wait for confirmation that the lows from the last post-earnings plunge will hold as support. In February, NYT gapped down and traded as low as $58.87 before buyers rushed in. The selling follow-through on Thursday and Friday seemed to validate my decision to wait.
Reuters reported that revenue rose 11% to $762.5 million and adjusted earnings beat expectations. However, the company added fewer digital subscribers than analysts expected. The miss was apparently especially jarring during an unusually active news cycle. Management acknowledged declining search and referral traffic from major technology platforms, adding a structural concern to the slower subscriber growth.
FIGS, Inc (FIGS)
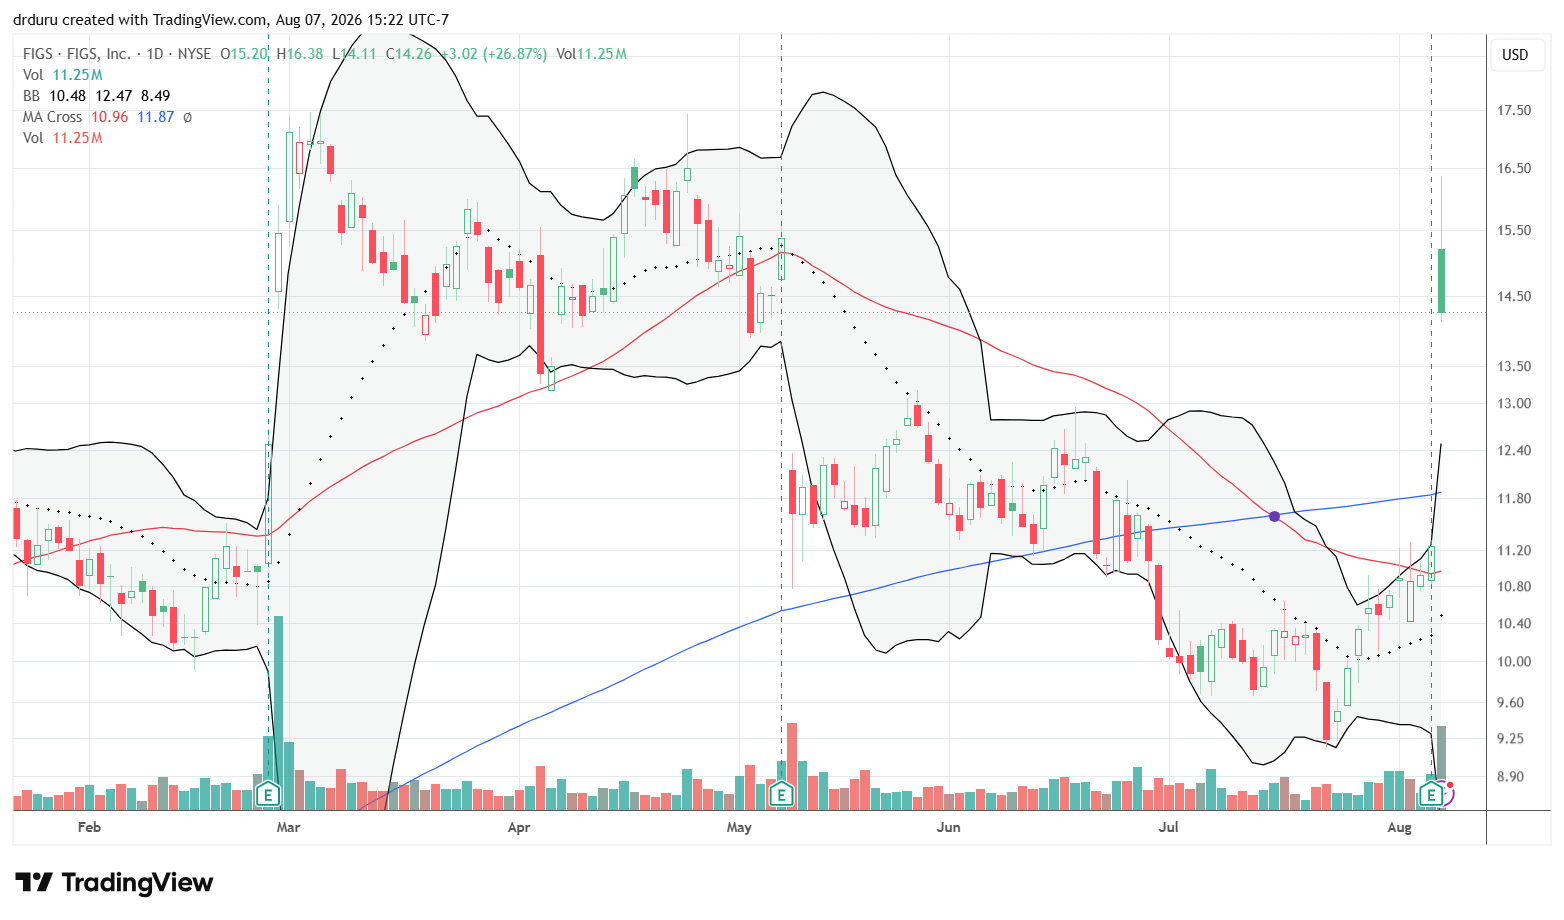
Description: FIGS is a direct-to-consumer healthcare apparel company best known for medical scrubs and related professional clothing.
Technical status: FIGS, Inc (FIGS) gapped and crapped but held on to a 26.9% post-earnings gain that filled the previous post-earnings gap down.
Trade commentary: FIGS only held 50DMA support once after I put it on the buy-the-dips list back in March. Last week’s post-earnings breakout puts the stock back on that list. This time I am waiting for a return to the upper Bollinger Band before deciding on a buy.
FIGS reported that it grew second-quarter revenue 28.8% to $196.6 million and produced a 14.4% net-income margin. Management raised its full-year outlook and increased its share-repurchase authorization by $100 million.
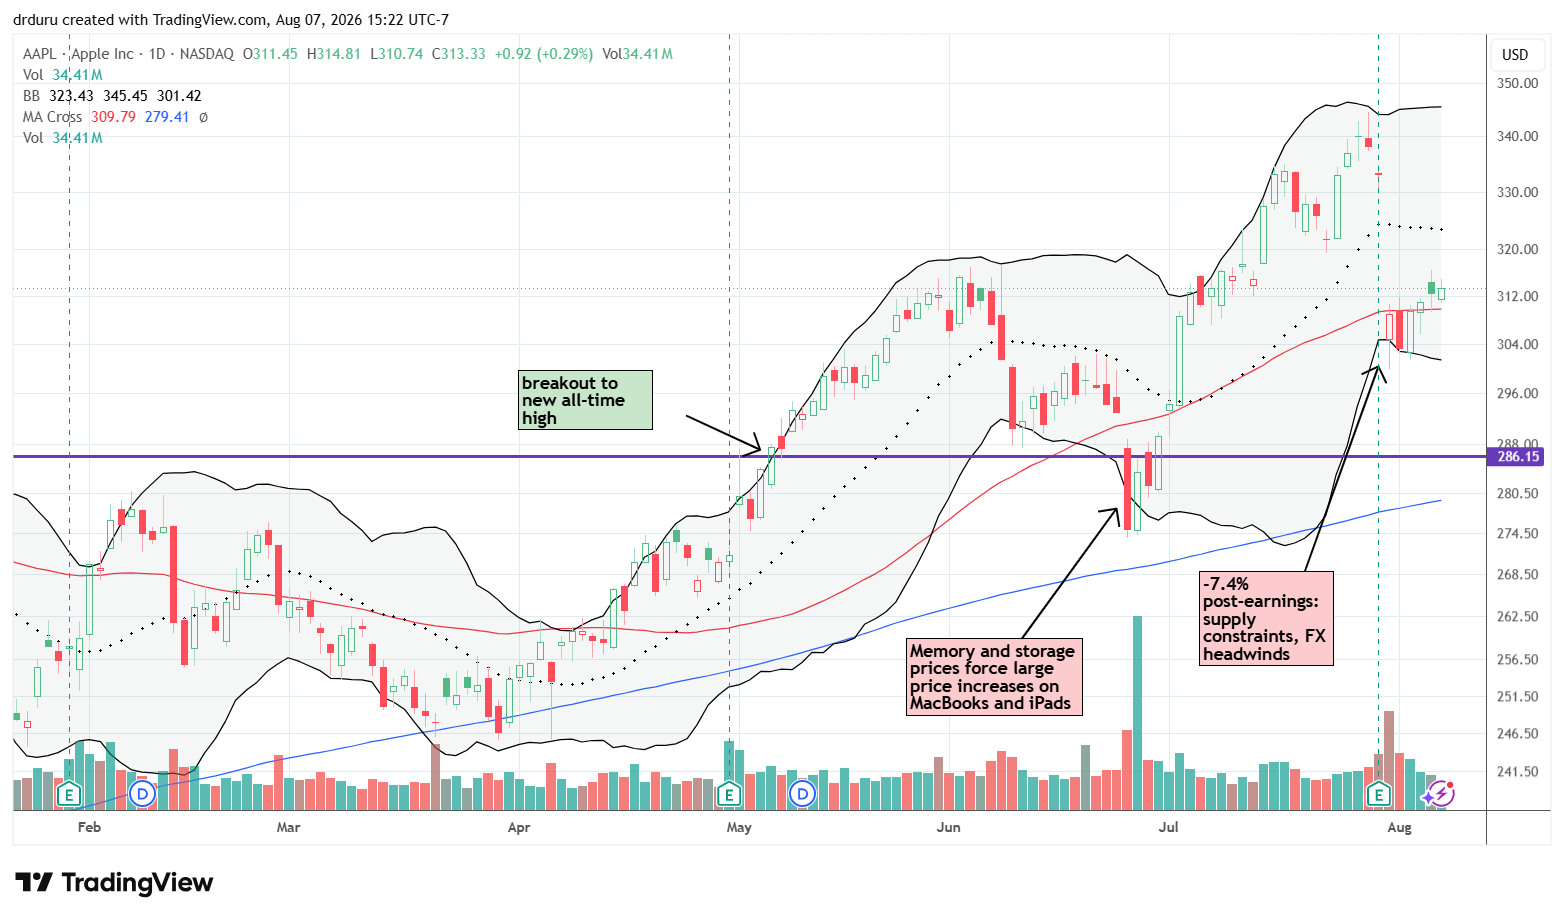
Apple (AAPL)
Description: Apple designs and sells consumer devices, operating systems and digital services led by the iPhone, Mac and App Store.
Technical status: Apple (AAPL) confirmed a 50DMA breakout as a slow post-earnings recovery unfolded.
Trade commentary: AAPL managed to pull itself over the 50DMA hurdle. I bought a speculative call (see the Apple Trading Model) in anticipation of a stronger rebound perhaps as early as Monday.
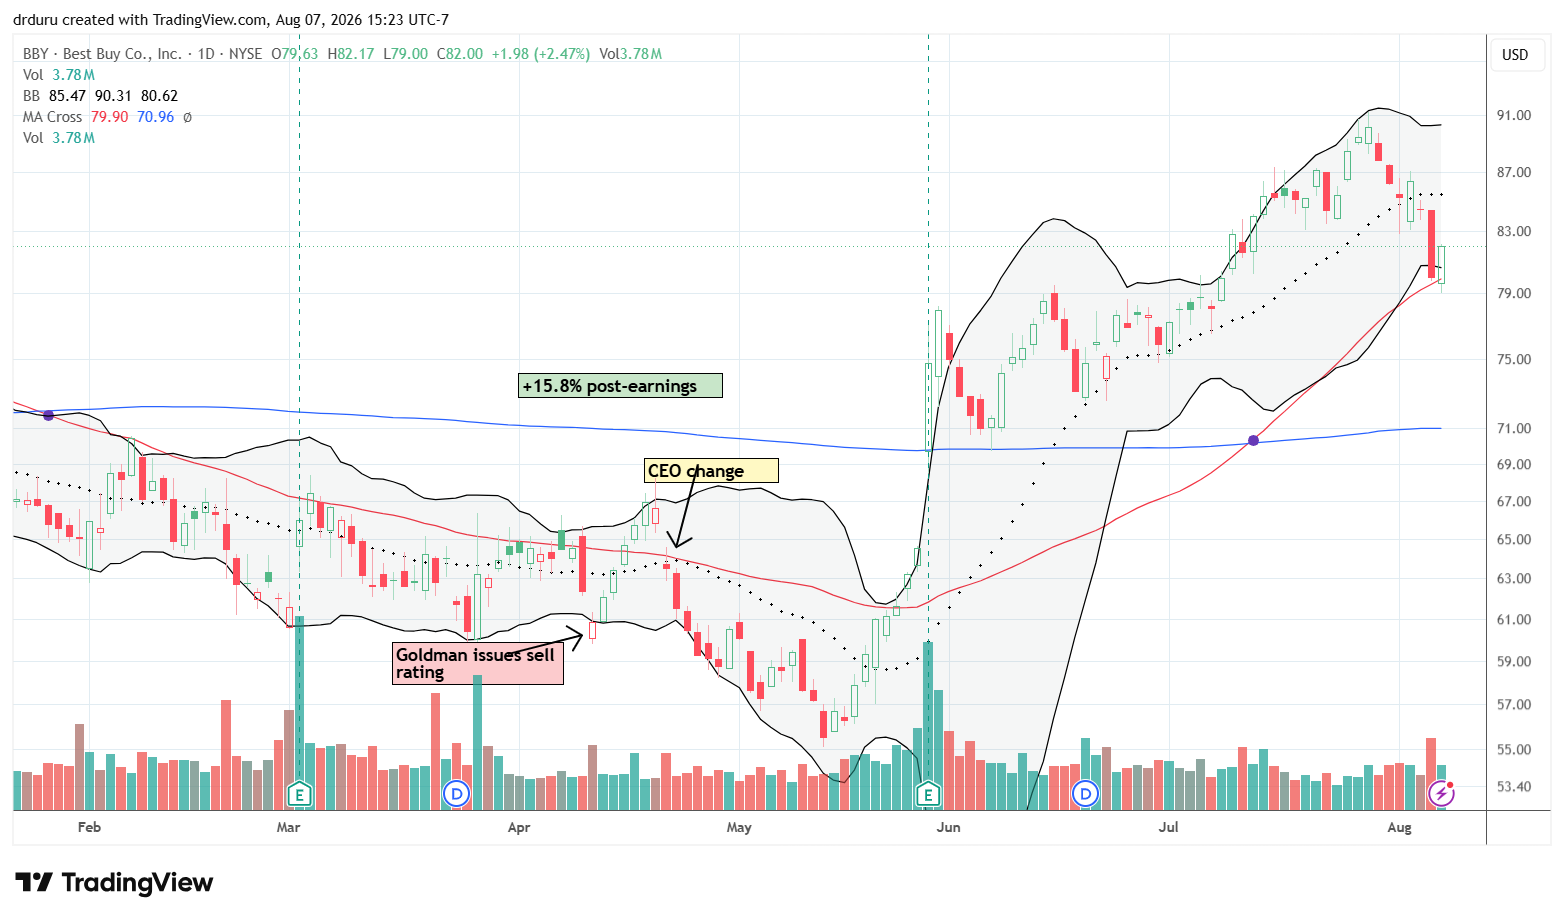
Best Buy (BBY)
Description: Best Buy sells consumer electronics, appliances and technology services through stores and digital channels.
Technical status: Best Buy (BBY) successfully tested 50DMA support after falling from an 18-month high.
Trade commentary: I thought I noticed BBY’s uptrend just in time when it held 20DMA support. The stock proceeded to slip further including a test of 50DMA support. I stubbornly added to my call options once the stock bounced off 50DMA support on Friday. I will add shares if the stock enjoys buying follow-through.
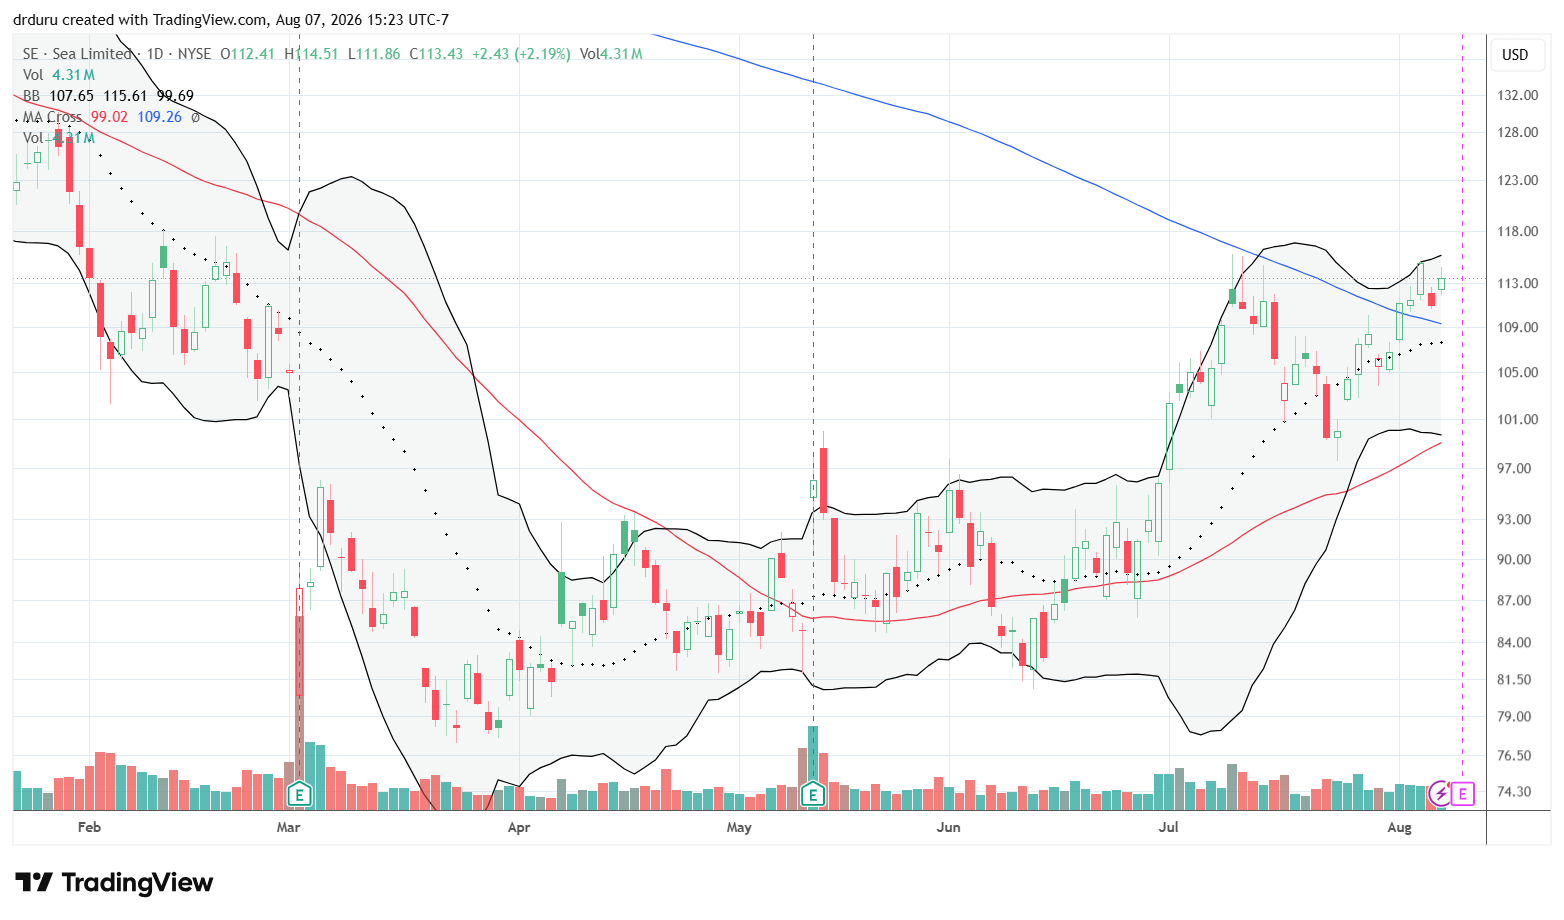
Sea Limited (SE)
Description: Sea operates the Shopee e-commerce platform, the Garena gaming business and the Monee digital-financial-services platform in Southeast Asia and other markets.
Technical status: Sea Limited (SE) confirmed a 200DMA breakout ahead of earnings.
Trade commentary: If SE did not have earnings coming this week, I would buy the stock’s 200DMA breakout. Instead, I will be watching the post-earnings response for clues on a good risk/reward trade.
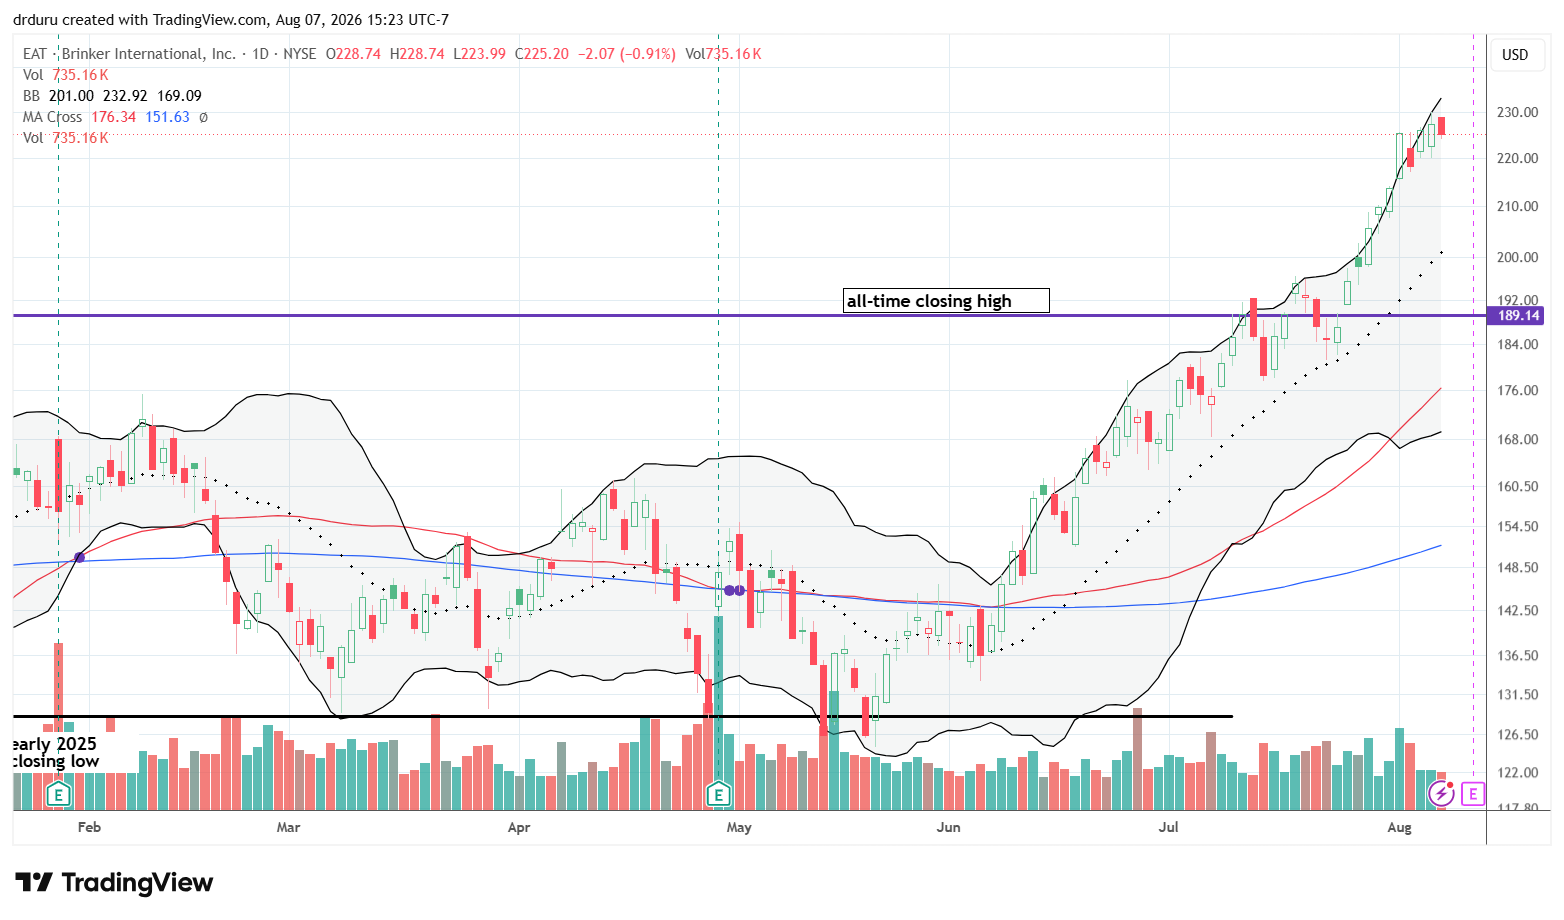
Brinker International (EAT)
Description: Brinker owns and franchises the Chili’s Grill & Bar and Maggiano’s Little Italy restaurant chains.
Technical status: Brinker International (EAT) continued its string of all-time highs ahead of earnings.
Trade commentary: EAT is confidently rallying into this week’s earnings report. The stock has steadily rallied off its May low. I should have bought the stock after June’s breakout above converged 50DMA and 200DMA resistance for a play at least to the former all-time high.
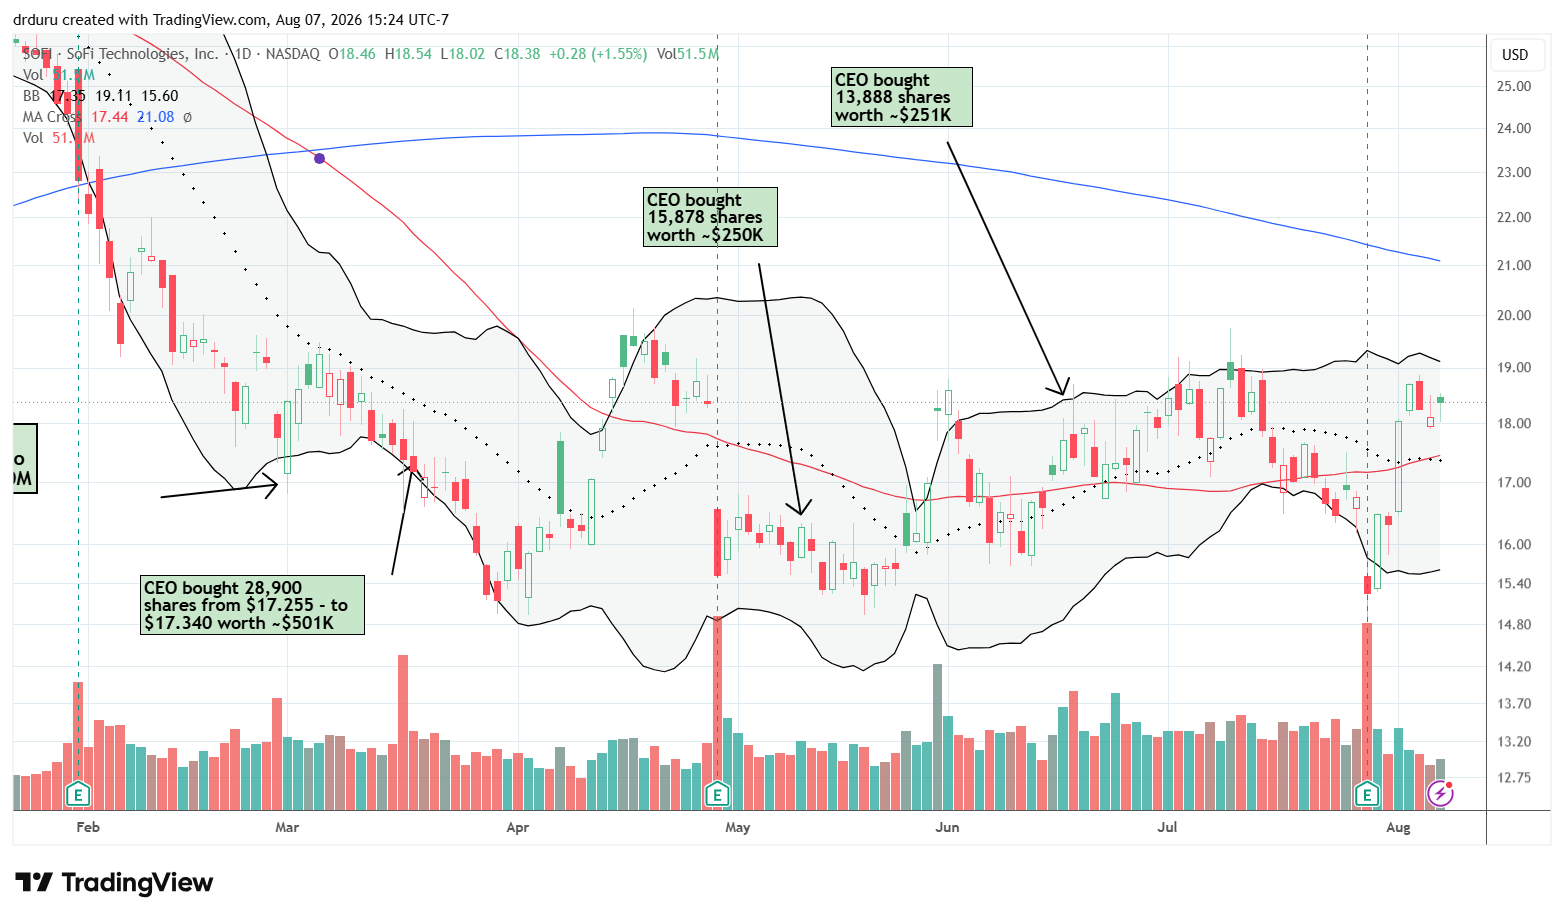
SoFi Technologies (SOFI)
Description: SoFi operates a digital financial-services platform offering lending, banking, investing and financial-technology infrastructure.
Technical status: SoFi Technologies (SOFI) quickly recovered from its post-earnings loss and is back to the top of its ongoing trading range.
Trade commentary: I am glad I held on to my “follow the leader” trade on SOFI. The gains after a full post-earnings recovery speak volumes. Still, the stock now needs to achieve a 200DMA breakout to bolster my confidence in the CEO’s purchases.
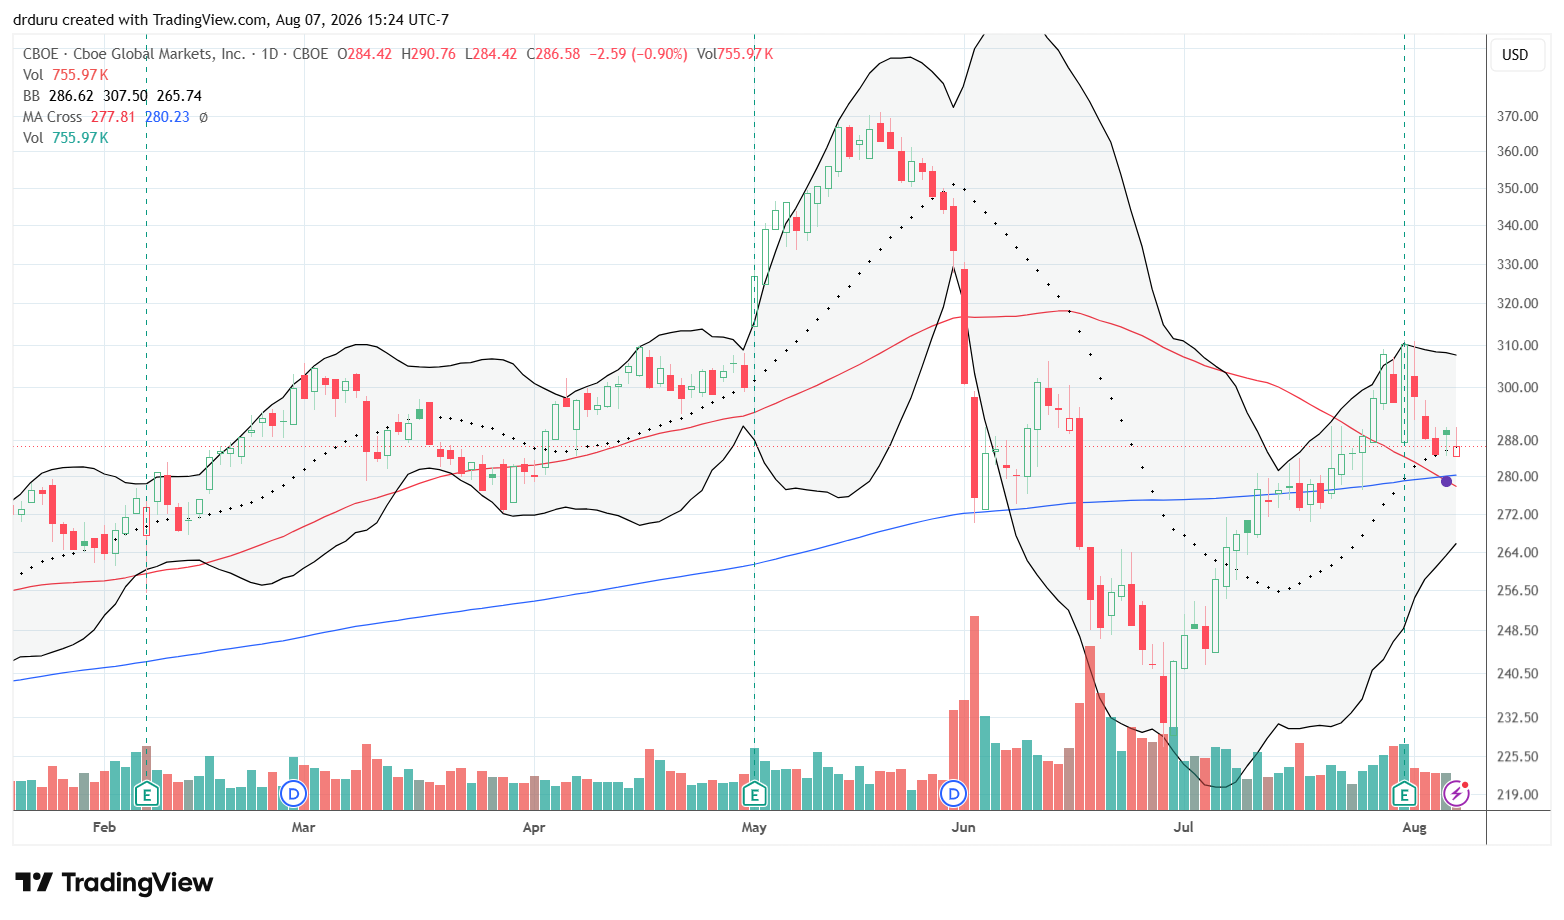
Cboe Global Markets (CBOE)
Description: Cboe operates exchanges and trading platforms for options, equities, futures, foreign exchange and market data.
Technical status: Cboe Global Markets (CBOE) is clinging to converged 50DMA and 200DMA support after losing a small post-earnings gain.
Trade commentary: I put CBOE on my radar last month. I bought shares two days after earnings and am now watching for the stock to hold support. Since this is a long-term position, I am not selling on short-term technicals, but I will have to reconsider if the stock punches below its June low.
Cboe reported that record net revenue increased 25% to $731.6 million, driven by another record quarter for index-option volumes, and management raised its organic-growth target. The company remained a beneficiary of elevated volatility and trading activity surrounding AI, oil, currencies and interest rates.
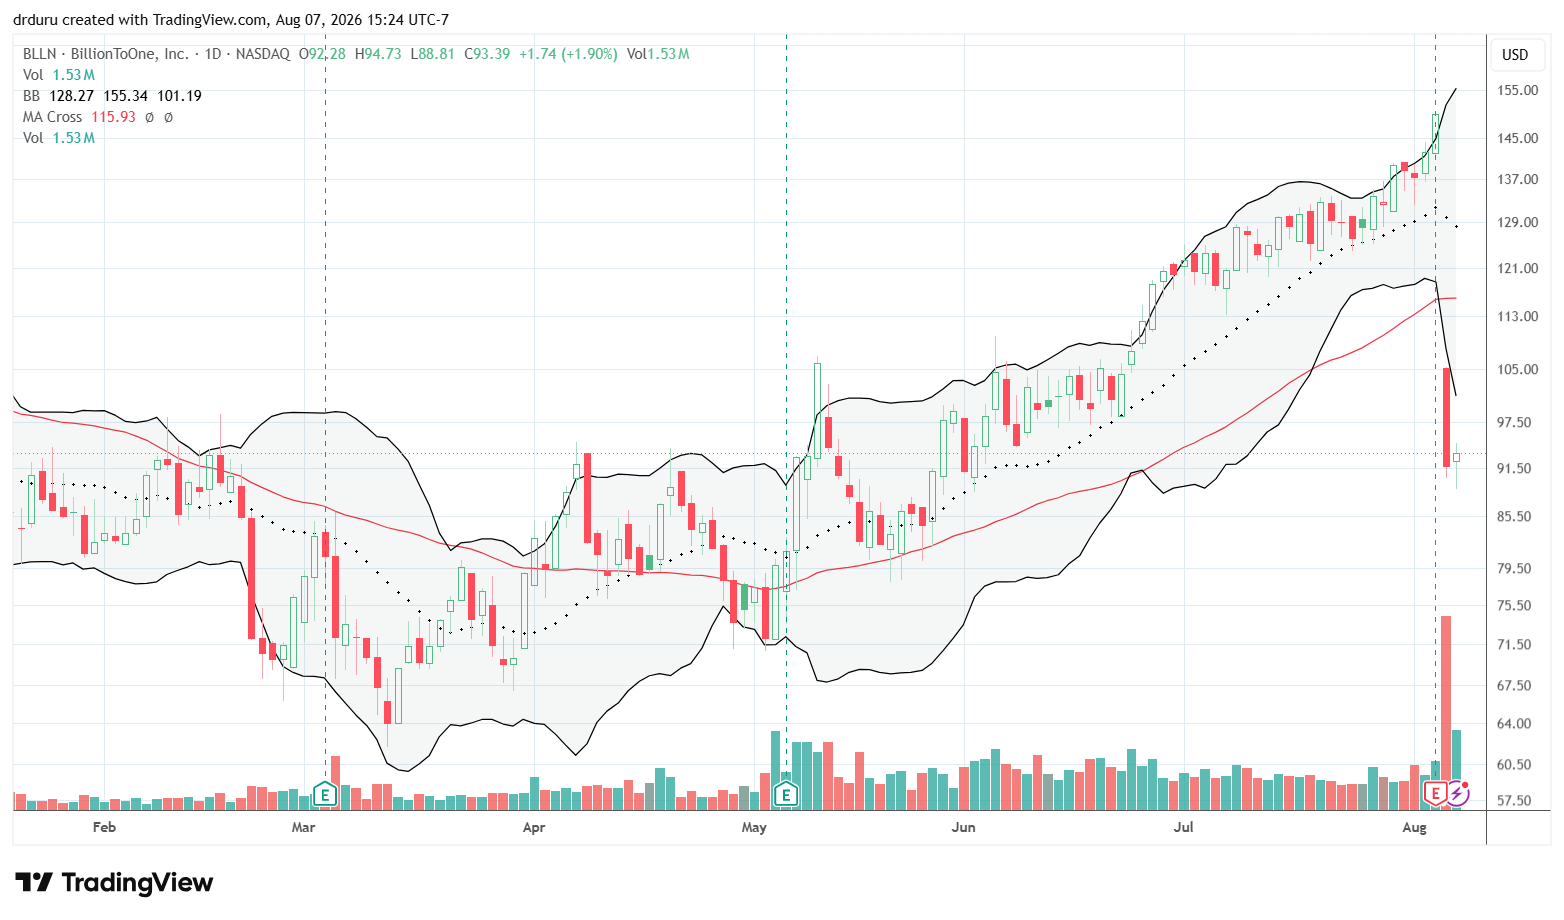
BillionToOne (BLLN)
Description: BillionToOne develops cell-free-DNA diagnostic tests for prenatal screening and cancer treatment selection and monitoring.
Technical status: BillionToOne (BLLN) crashed below 50DMA support with a 38.9% post-earnings loss.
Trade commentary: According to Investor’s Business Daily BLLN reported revenue growth of 64% to $109.4 million, earnings beating expectations and gross margin expanding to 70.5%. Management also reiterated full-year revenue guidance.
I bought shares as a trade on over-extended selling well below the lower Bollinger Band. It seems investor expectations were far too high given the run-up into earnings. I am playing for a rebound at least to 50DMA resistance.
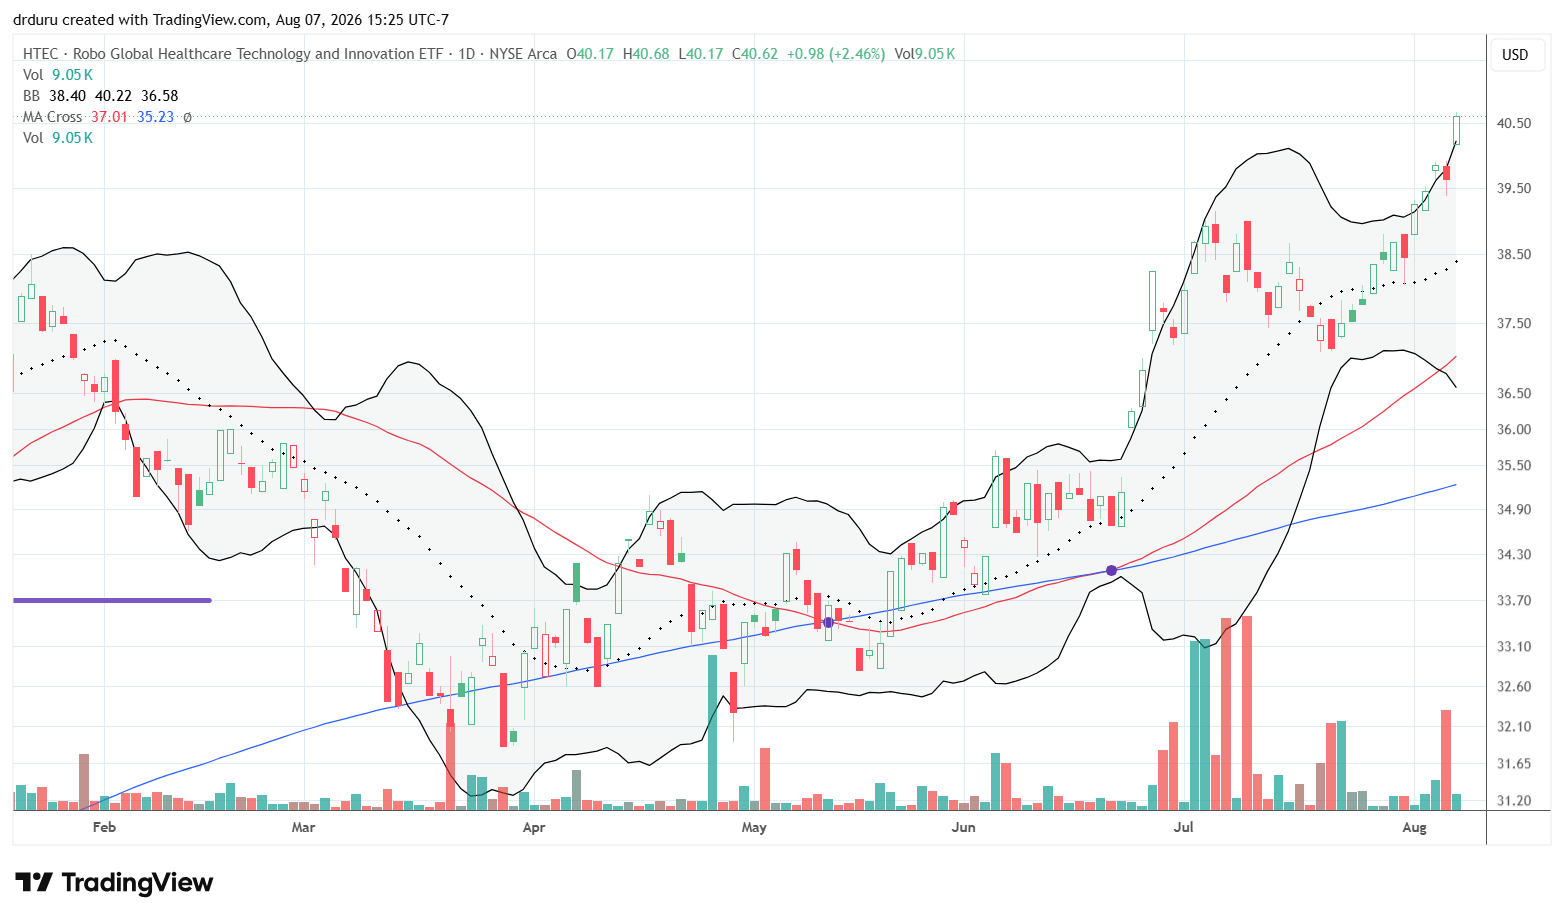
ROBO Global Healthcare Technology and Innovation ETF (HTEC)
Description: HTEC invests in companies using technology and innovation across diagnostics, medical devices, genomics, data analysis and healthcare delivery.
Technical status: ROBO Global Healthcare Technology and Innovation ETF (HTEC) resumed its major recovery with a fresh run-up to levels last seen in early 2022.
Trade commentary: Shortly after I celebrated my bet on a bottom in HTEC in January, the ETF went into a 2-month slide. Now HTEC is up 14.9% for the year. While last week’s run-up looks a bit over-extended, my investment thesis remains unchanged.
United States Oil Fund (USO)
Description: USO is an exchange-traded fund designed to track near-term West Texas Intermediate crude-oil futures.
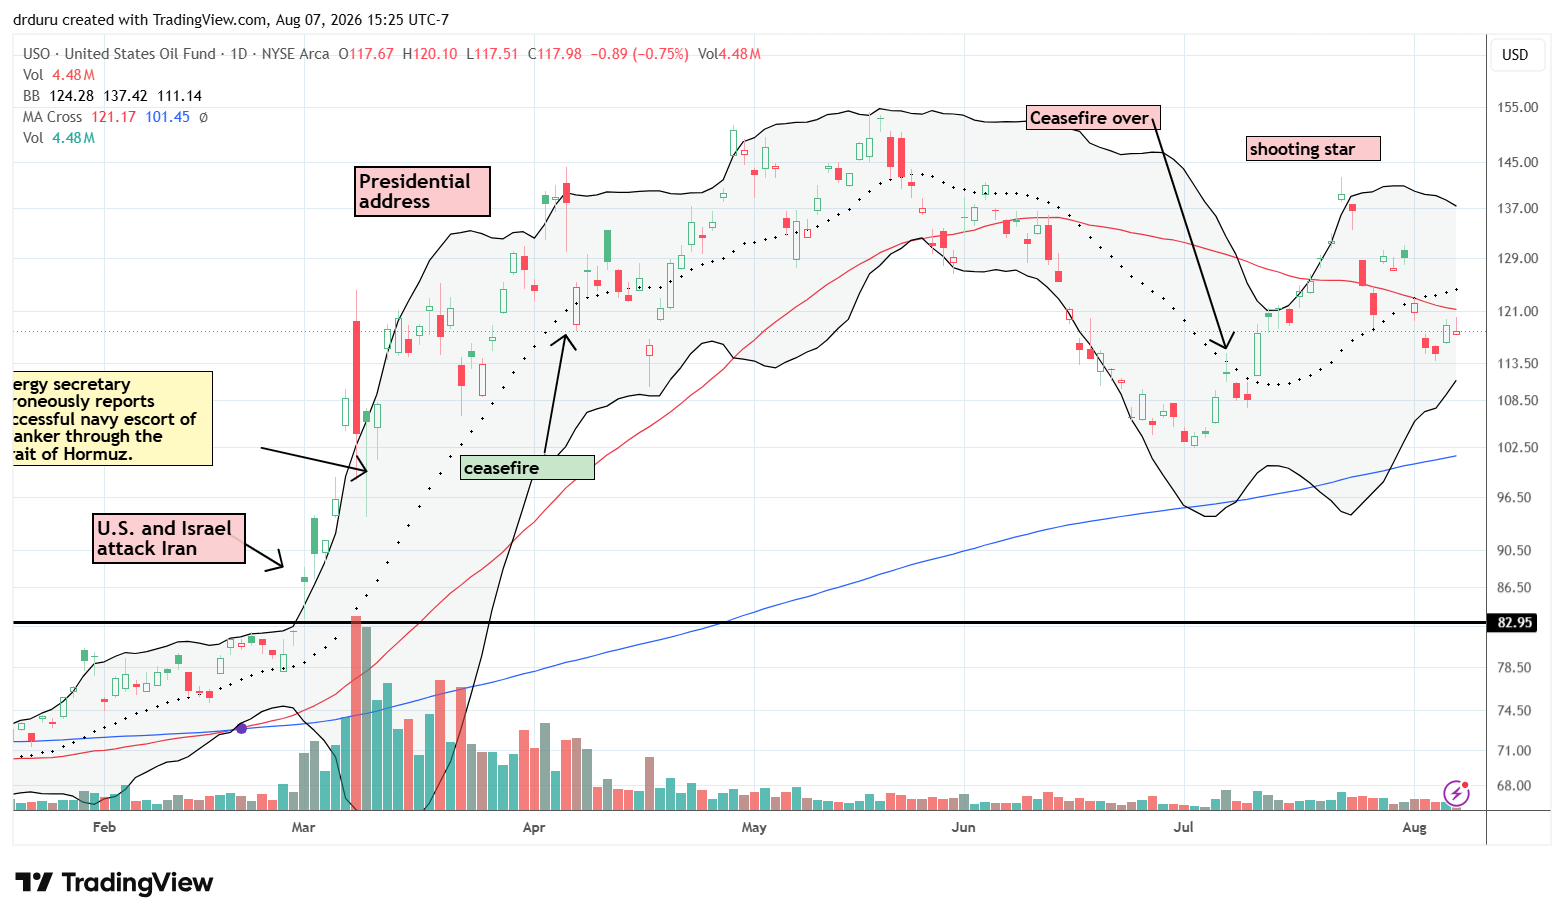
Technical status: The United States Oil Fund (USO) suffered a fresh and longer-lasting 50DMA breakdown.
Trade commentary: Last month’s bet that USO topped out worked out quickly. I took profits the next day. With tensions building yet again between the U.S. and Iran, I speculated on a USO call option with USO at its lows of the week. I was able to get a quick double the next day. These last two trades have me more interested in watching USO for extremes that are misaligned with the latest headlines.
SPDR Gold Shares (GLD)
Description: GLD is an exchange-traded trust designed to track the price of physical gold bullion.
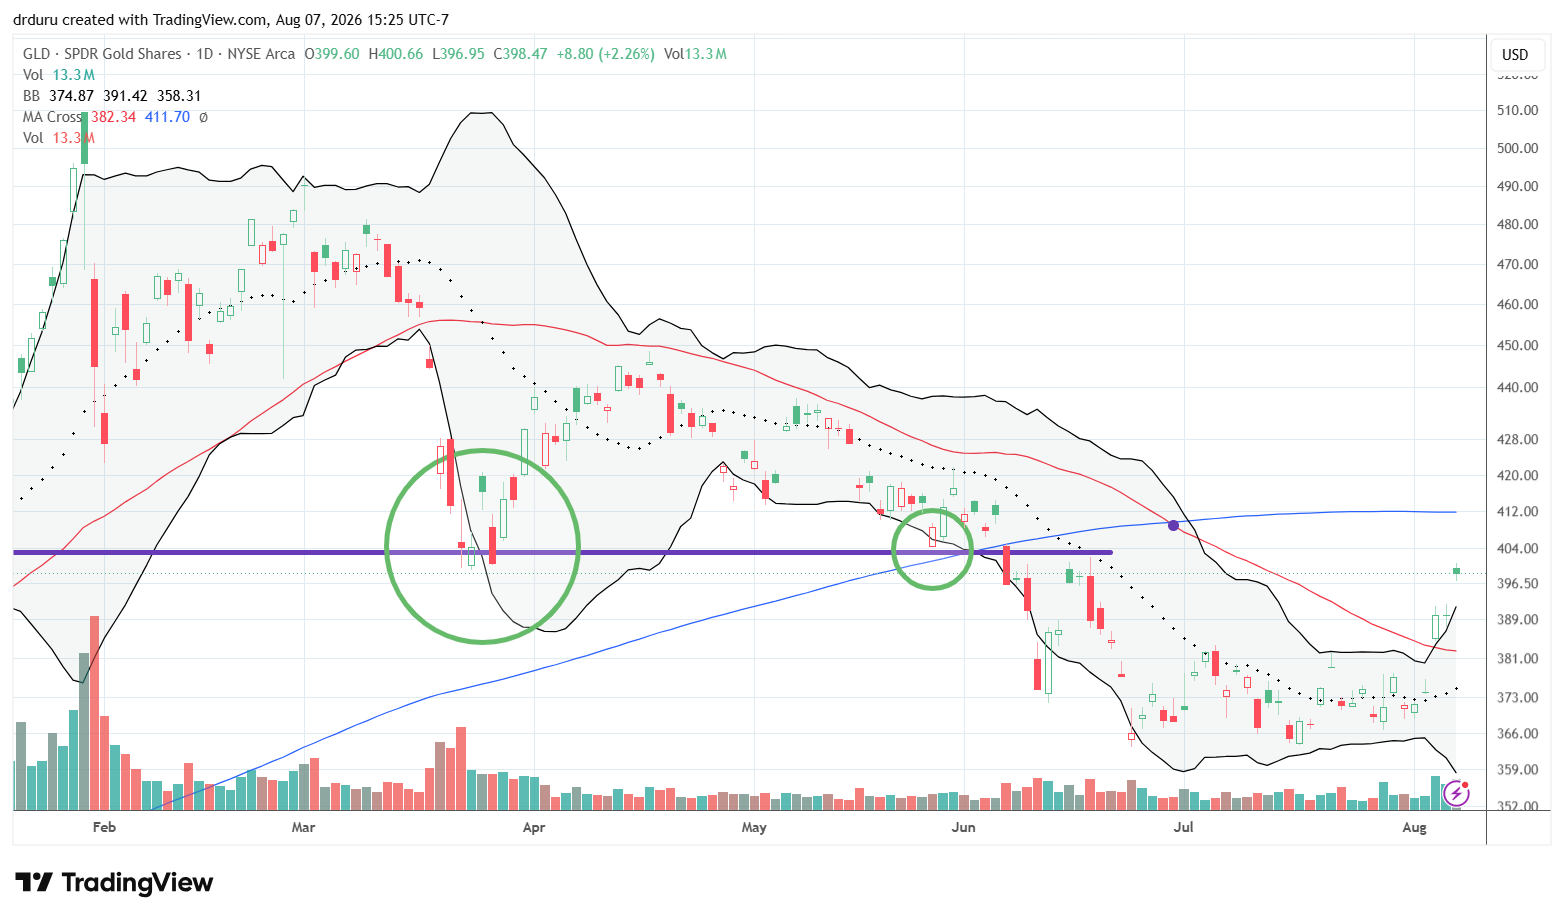
Technical status: The SPDR Gold Shares (GLD) woke up with a confirmed 50DMA breakout. Momentum looks strong enough for an imminent test of 200DMA resistance.
Trade commentary: Gold surged more than 7% for the week and reached a seven-week high after the July jobs report sent odds for a September rate hike well below 50%. Last month, I concluded I would not buy GLD again until a 200DMA breakout. However, the recent 50DMA breakout was so convincing I bought Sprott Physical Gold Trust EV (PHYS) the next day, prepared to add more on a dip. Friday’s jump was fortuitous timing. Looking back, I realize I should have purchased GLD call options alongside PHYS. I am looking to buy dips from here with call options (or call spreads).
Footnotes
Subscribe for free to get email notifications of future posts!
“Above the 50” (AT50) uses the percentage of stocks trading above their respective 50-day moving averages (DMAs) to measure breadth in the stock market. Breadth defines the distribution of participation in a rally or sell-off. As a result, AT50 identifies extremes in market sentiment that are likely to reverse. Above the 50 is my alternative name for “MMFI” which is a symbol TradingView.com and other chart vendors use for this breadth indicator. Learn more about AT50 on my Market Breadth Resource Page. AT200, or MMTH, measures the percentage of stocks trading above their respective 200DMAs.
Active AT50 (MMFI) periods: Day #262 over 20%, Day #89 over 30%, Day #85 over 40%, Day #40 over 50%, Day #1 over 60% (overperiod), Day #235 under 70% (underperiod)
Source for charts unless otherwise noted: TradingView.com
Full disclosure: long SMH put spread, long MSFT, long ATI, long TDC, long IT, long TRI, long PHYS, long ZM, long ESTC, long BBY calls, long AAPL call, long SOFI, long CBOE, long USO put spread
FOLLOW Dr. Duru’s commentary on financial markets via StockTwits, BlueSky, and even Instagram!
*Charting notes: Stock prices are not adjusted for dividends. Candlestick charts use hollow bodies: open candles indicate a close higher than the open, filled candles indicate an open higher than the close.
* Blog notes: I use ChatGPT to help with editing and news discovery.
Keep up the Great work. Ole Friend.
Thank you! You keep me motivated. 🙂