

The Market Breadth Summary: Punished
- The Federal Reserve rate hike punished market breadth, pushing AT50 to a seven-month low while rate-sensitive stocks and small caps came under renewed pressure.
- The S&P 500 and NASDAQ recovered quickly from their post-Fed weakness, even as broader participation deteriorated and the Russell 2000 remained in a downtrend.
- AI-related stocks rebounded sharply after an early-week selloff, with AIS, Coherent, Intel, and other AI-linked names resisting the broader post-Fed weakness.
- Consumer-facing stocks, financials, and housing-related equities showed notable weakness as higher rates, rising oil prices, and tighter financial conditions added pressure.
The Stock Market Summary
The Federal Reserve actually did it. America’s central bank channeled Kevin Warsh’s previous jawboning into an actual rate hike. The Fed’s first such move since 2023 was well-priced by the Fed fund futures market, but the stock market was initially caught off-guard. The rate hike punished market breadth to new lows for the current cycle as rate-sensitive stocks took some of the hardest hits. While AI-related stocks were barely fazed and continued to rally into the end of the week, the damage was done. Market breadth is back to questioning the underlying health of the stock market.
Consumer-facing stocks, retailers and dining establishments in particular, have my attention as sources of weakness in the stock market. A strong August retail report did not translate into sector-wide resilience. This reticence in the stocks makes sense in the face of a new surge in oil prices amid once again escalating conflicts in the Middle East, this time with Saudi Arabia under attack by the Houthis in Yemen. The stock market is not yet out of the woods in this second of the market’s three most dangerous months.
S&P 500 (SPY)
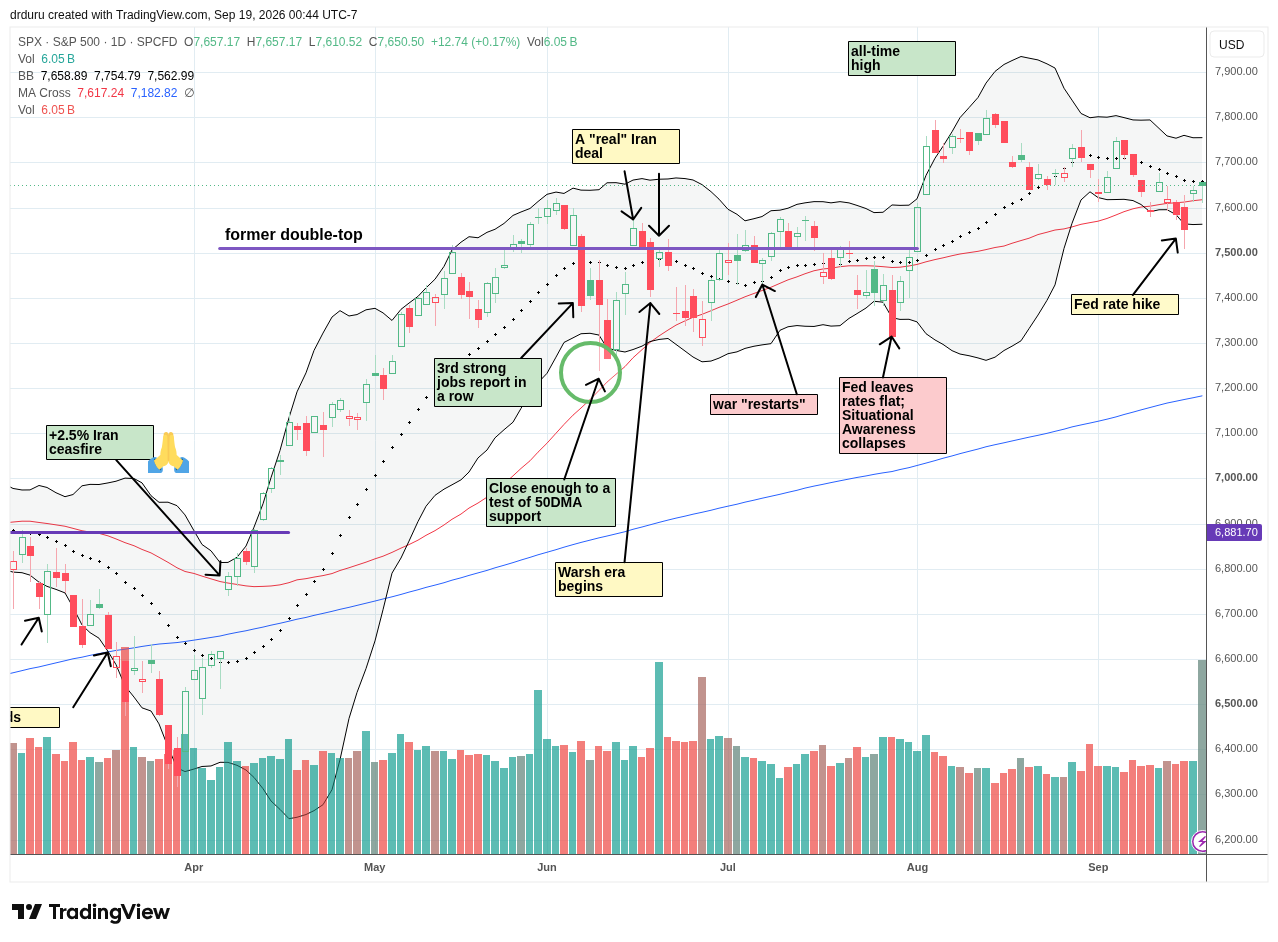
The S&P 500 (SPY) has gone nowhere for two and a half months, allowing the 50-day moving average (DMA) (red line) to converge with the 20DMA (dashed line). This convergence sets up a technical test of dominance: will the downtrending 20DMA dominate direction or will the uptrending 50DMA do so? The quick and definitive recovery from the post-Fed 50DMA breakdown suggests the pricing dynamics favor short-term upside over downside.
NASDAQ (COMPQ)
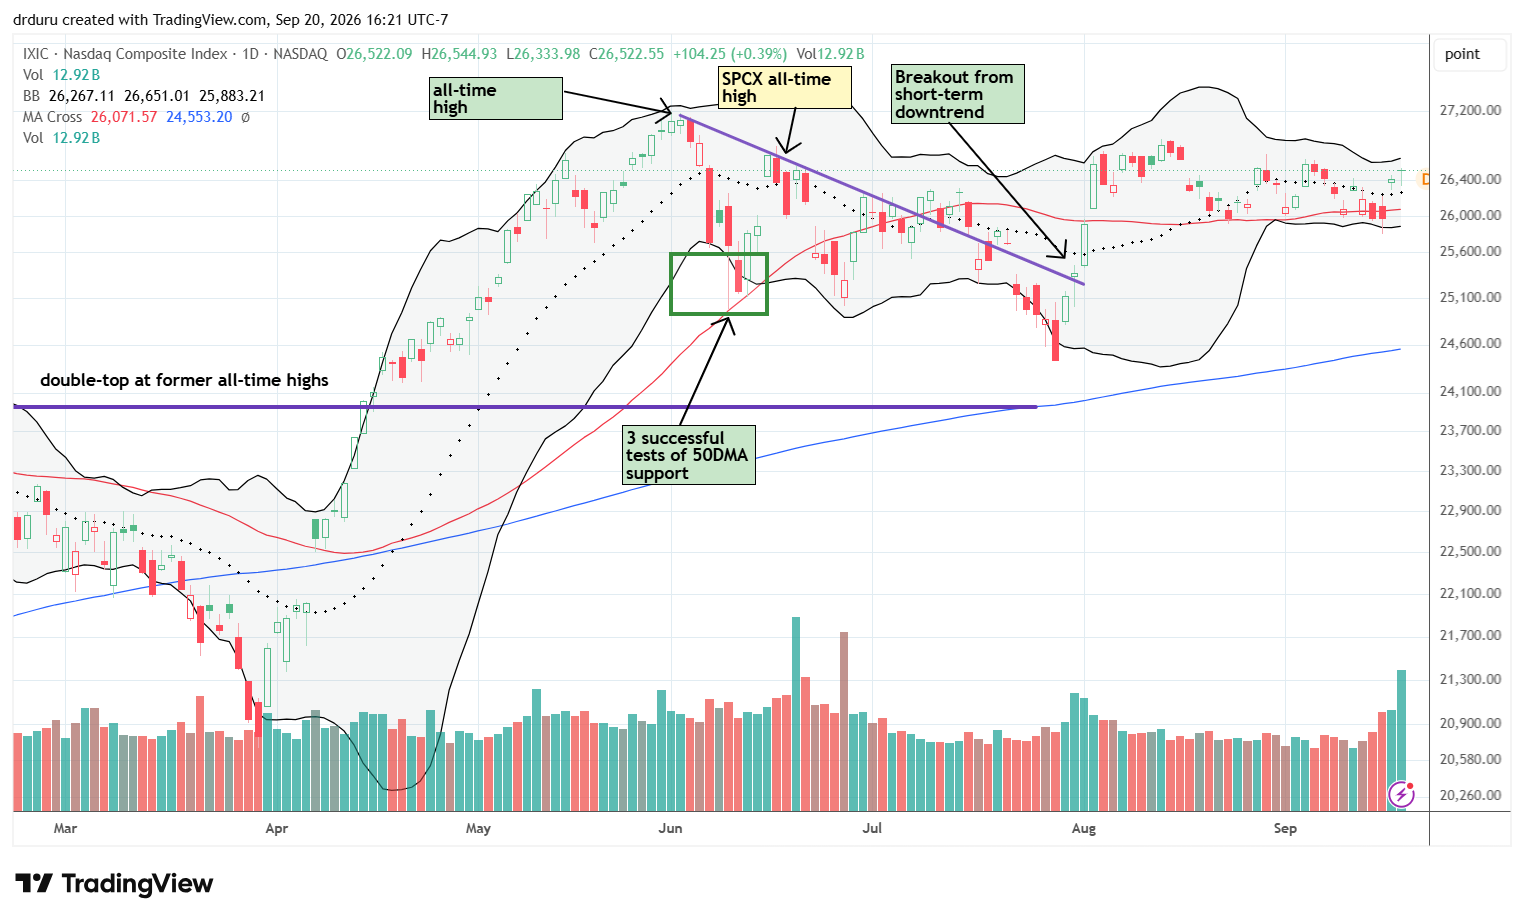
The NASDAQ (COMPQ) has gone nowhere for over 4 months, resulting in a flattened 50DMA. Thus, the tech-laden index is trendless. The repeated, successful defenses of 50DMA support generate a greater likelihood of a short-term upside breakout over a breakdown. Until an upside or downside resolution, the NASDAQ offers little of interest to trade (in aggregate). AI-related stocks contributed to the NASDAQ’s two day post-Fed recovery.
iShares Russell 2000 ETF (IWM)
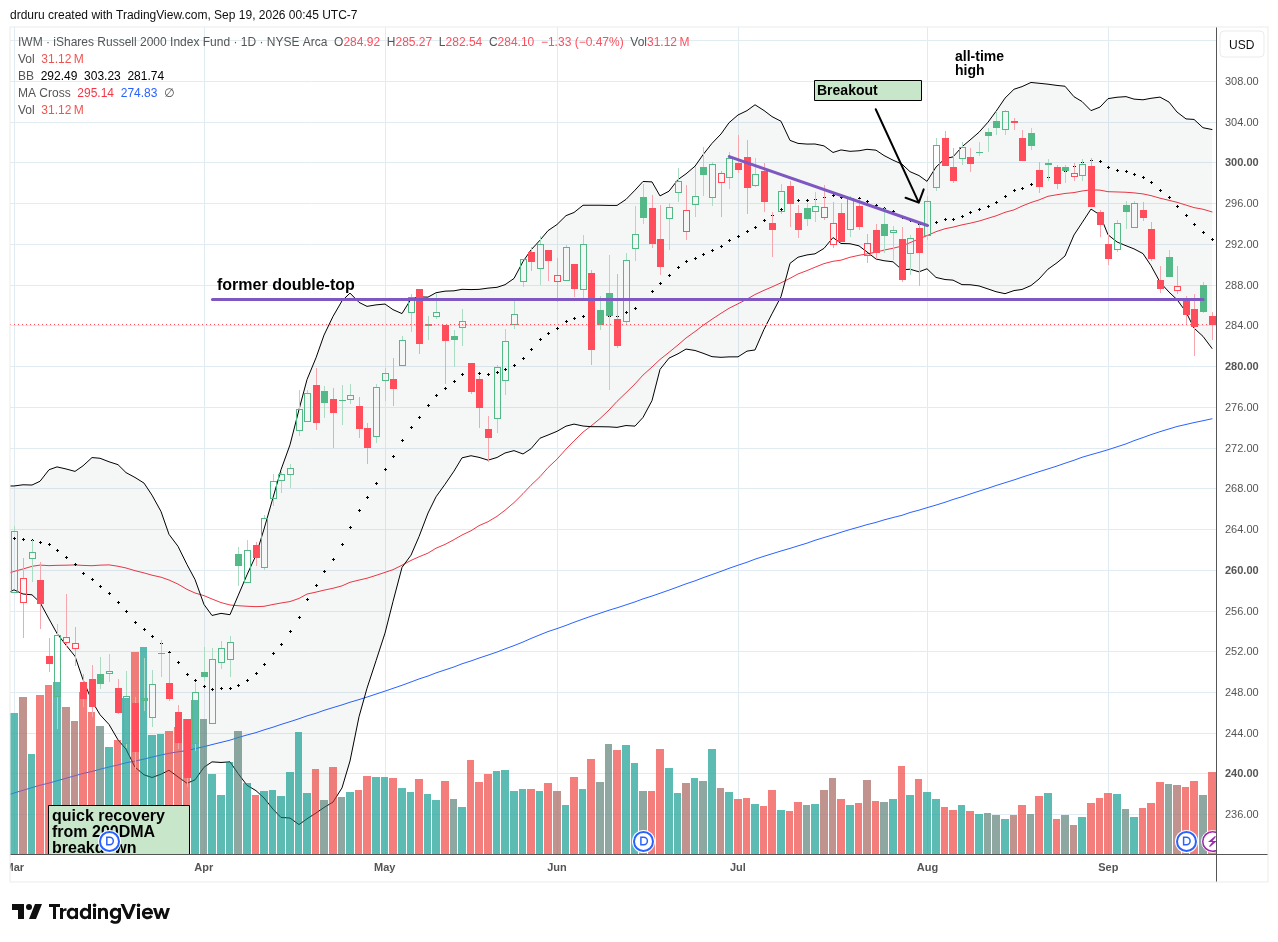
The iShares Russell 2000 ETF (IWM) continued its downtrend from August’s all-time high. The ETF of small caps got punished on Wednesday’s rate hike. With IWM trading well below its lower Bollinger Band (BB), I reflexively bought call options. Yet, I failed to take profits on Thursday’s gap open higher. By Friday, I was adding to my position at much lower prices as a speculative trade on a fresh rebound. However, I only see the potential for relief for IWM if oil prices abruptly come down and bond yields similarly come down in parallel. Otherwise, I expect IWM to continue its downtrend with a test of 200DMA (the blue line) support in sight.
The Short-Term Trading Call With the Breadth Punished
- AT50 (MMFI) = 34.0% of stocks are trading above their respective 50-day moving averages
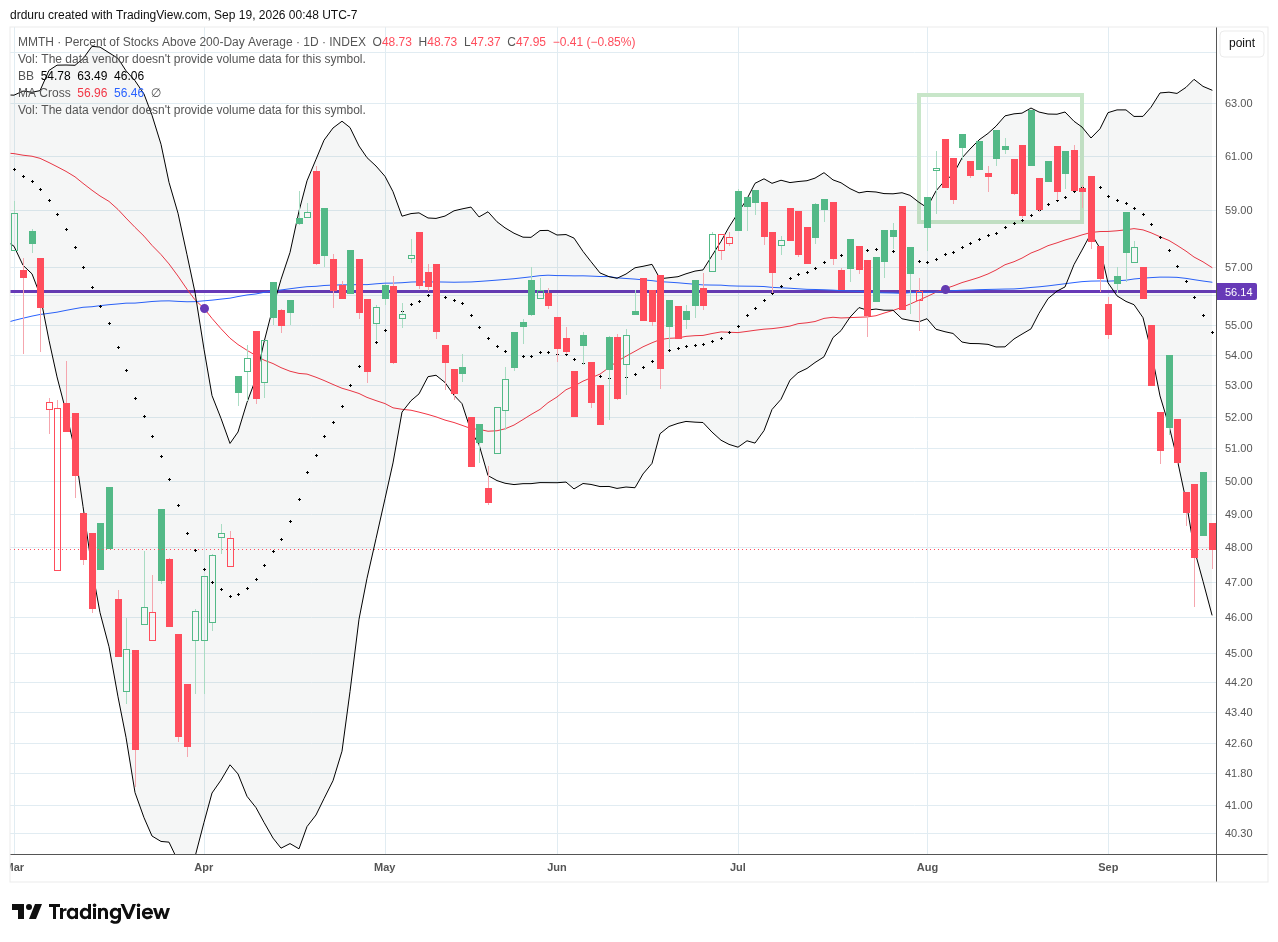
- AT200 (MMTH) = 48.0% of stocks are trading above their respective 200-day moving averages
- Short-term Trading Call: neutral
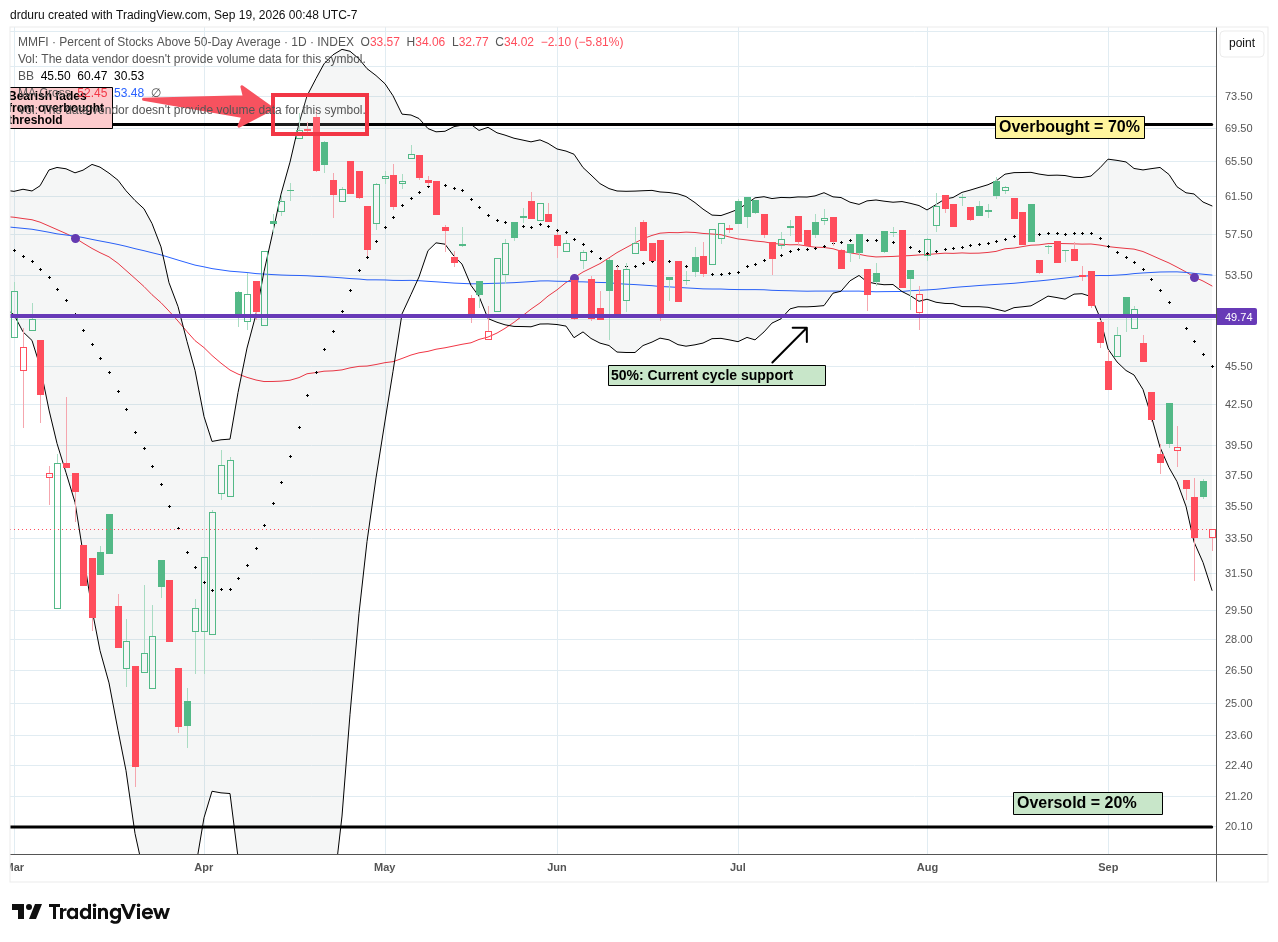
AT50 (MMFI), the percentage of stocks trading above their respective 50DMAs, closed the week at 34.0%, its lowest level since the beginning of April. Recall again that April’s gap higher followed news of the first ceasefire in the war against Iran. Thus market breadth is highlighting the end of that catalyst and the potential for a continued decline toward or to oversold levels. With six weeks still to go in the stock market’s three most dangerous months of the year, the technicals are primed for imminent oversold conditions, but I am not betting on such a fall because of the lingering strength in the S&P 500 and the NASDAQ.
AT200, the percentage of stocks trading above their respective 200DMAs, once again sounded the same alarm as AT50. The Fed’s rate hike punished this longer-term indicator of market breadth’s health. The gains from April’s gap higher are now completely gone. A return to the March lows is now in the cards unless the current steep downtrend comes to an end soon, quick, and in a hurry.
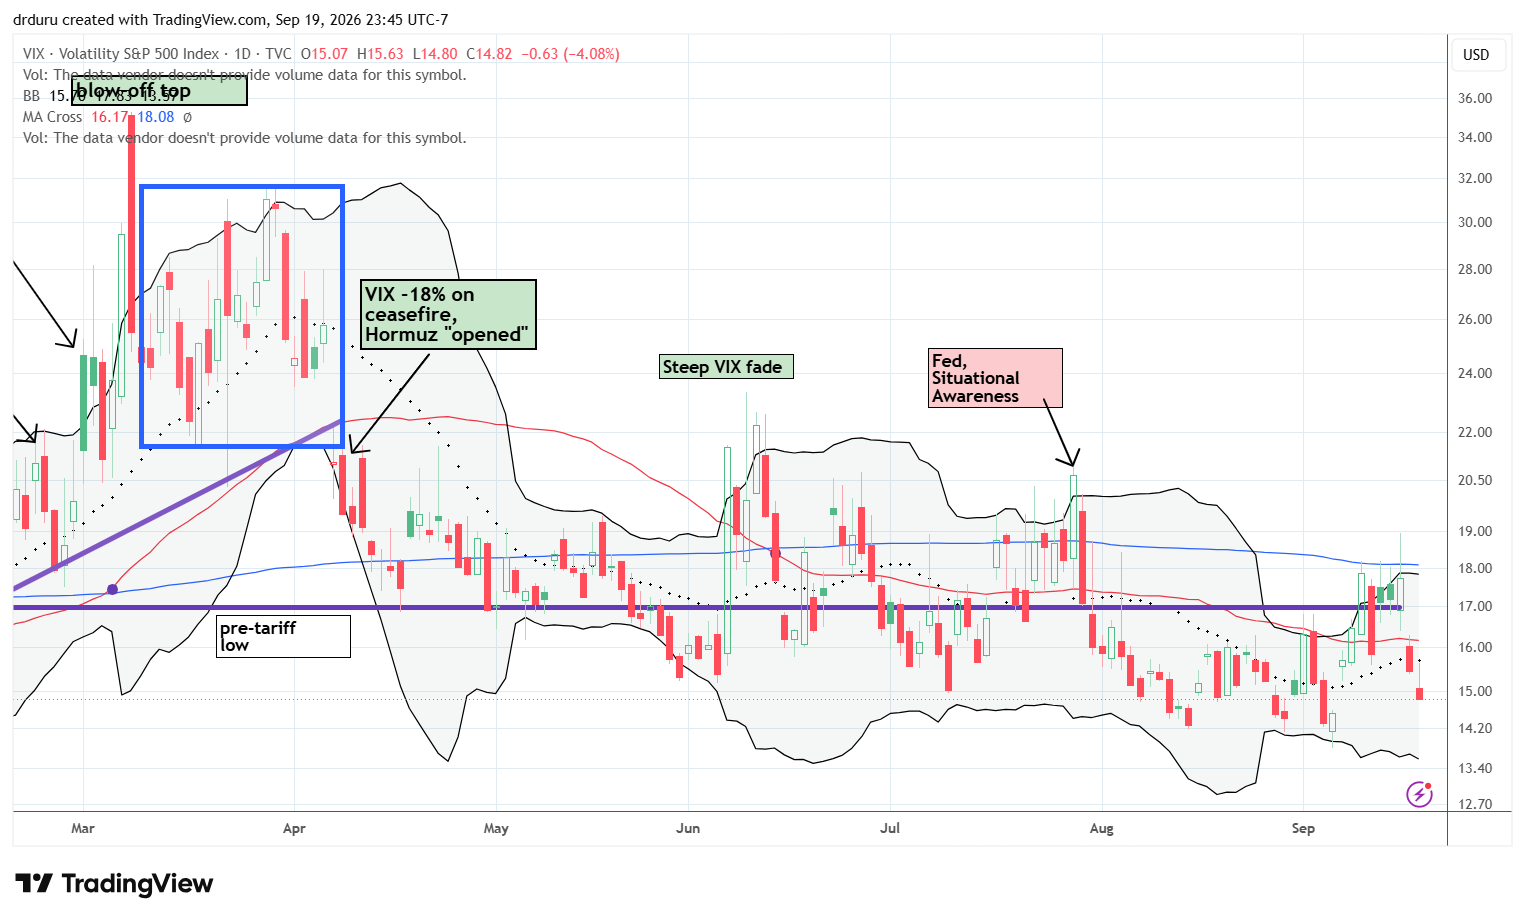
The volatility index (VIX) briefly jumped to levels last seen in late July after the Fed rate hike first punished market breadth. However, the volatility faders quickly took the VIX back to 14.8 by the end of the week. The VIX’s path of least resistance seems to be to the downside given the slow drift in the S&P 500. The volatility index is becoming less and less informative for my purposes.
The Equities
VistaShares Artificial Intelligence Supercycle ETF (AIS)
Description: VistaShares Artificial Intelligence Supercycle ETF is an actively managed ETF investing in companies across the global AI semiconductor, data-center infrastructure and AI-application value chain.
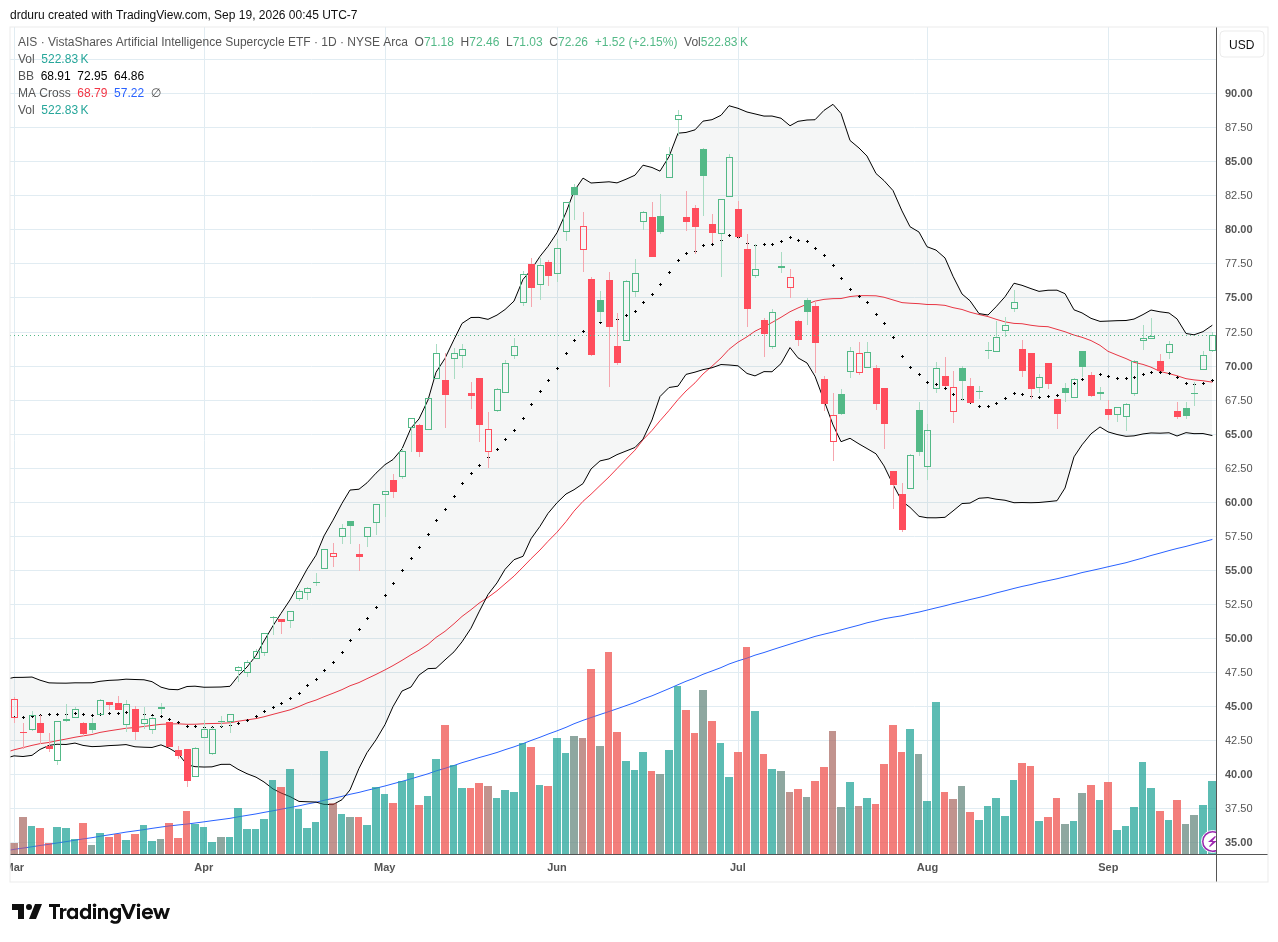
Technical Status: VistaShares Artificial Intelligence Supercycle ETF (AIS) rebounded 2.2% Friday, confirmed a 50DMA breakout, and approached its upper Bollinger Band as investors returned aggressively to AI infrastructure.
Trade Commentary: Going forward I will focus more on using AIS to represent the trading dynamics in AI-related stocks. When AIS gapped down 7.4% on Monday, AI-related stocks broadly declined, especially semiconductors. AI safety concerns punished these stocks but created the latest buying opportunity. Buyers took over from there and even completely ignored the Fed. On Fed day, AIS gained 2.4%. The subsequent two days of buying confirmed a 50DMA breakout and signaled a growing divergence with the rest of the market, especially rate-sensitive stocks.
Coherent Corp. (COHR)
Description: Coherent manufactures optical communications, photonics and semiconductor technologies used across data centers, communications networks and industrial markets.
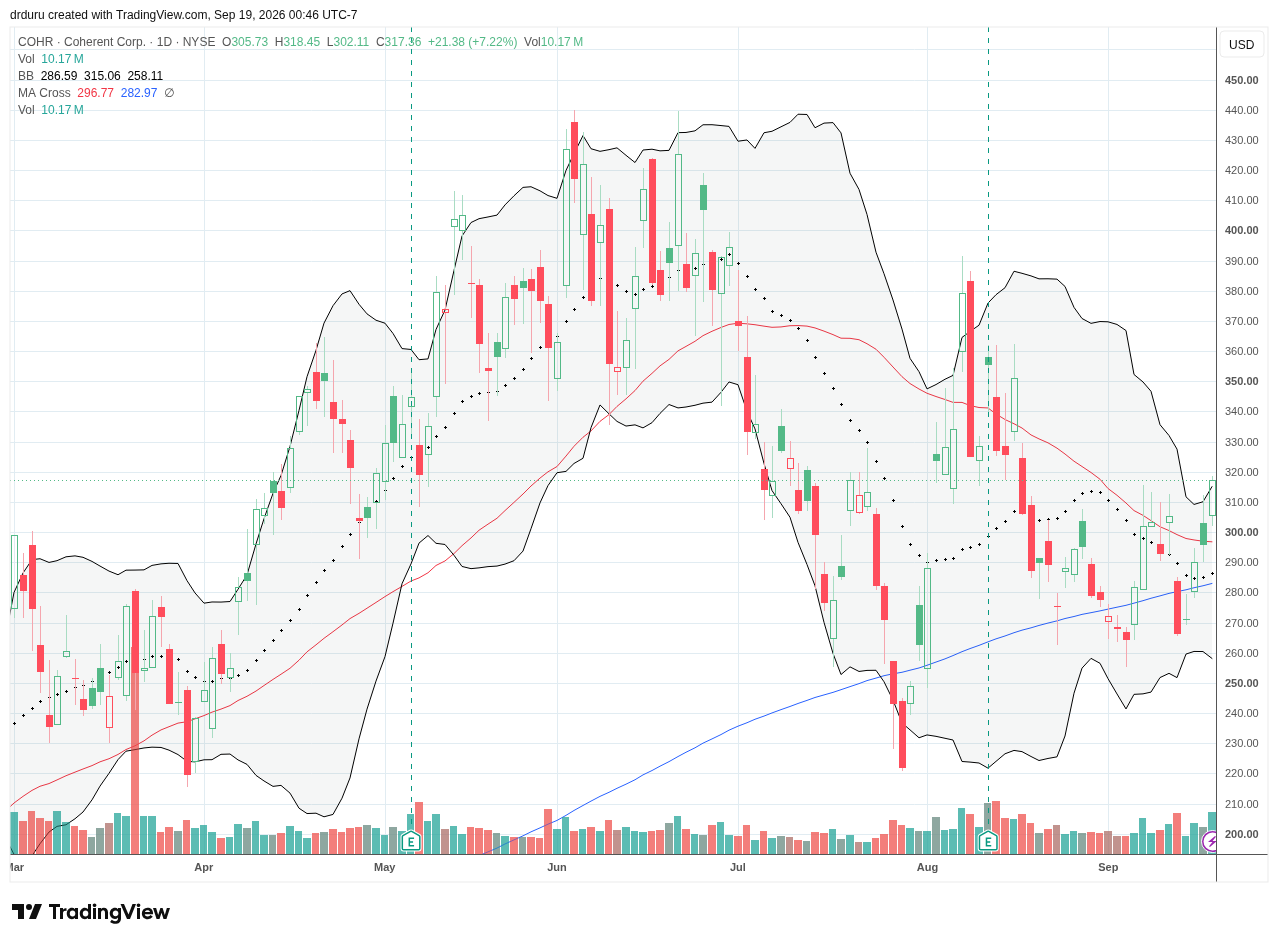
Technical Status: Coherent Corp. (COHR) surged 7.2% Friday, reclaimed its 20DMA and 50DMA and closed above its upper Bollinger Band as optical-connectivity stocks resumed AI leadership.
Trade Commentary: COHR was part of the cohort of AI-related stocks providing pricing strength. COHR completely ignored the punishment from the Fed’s rate hike and gained 6.9% on Wednesday. The countermove was further emphasized by Thursday’s 50DMA breakout and Friday’s follow-through on a 7.2% gain. COHR is on my buy list this week.
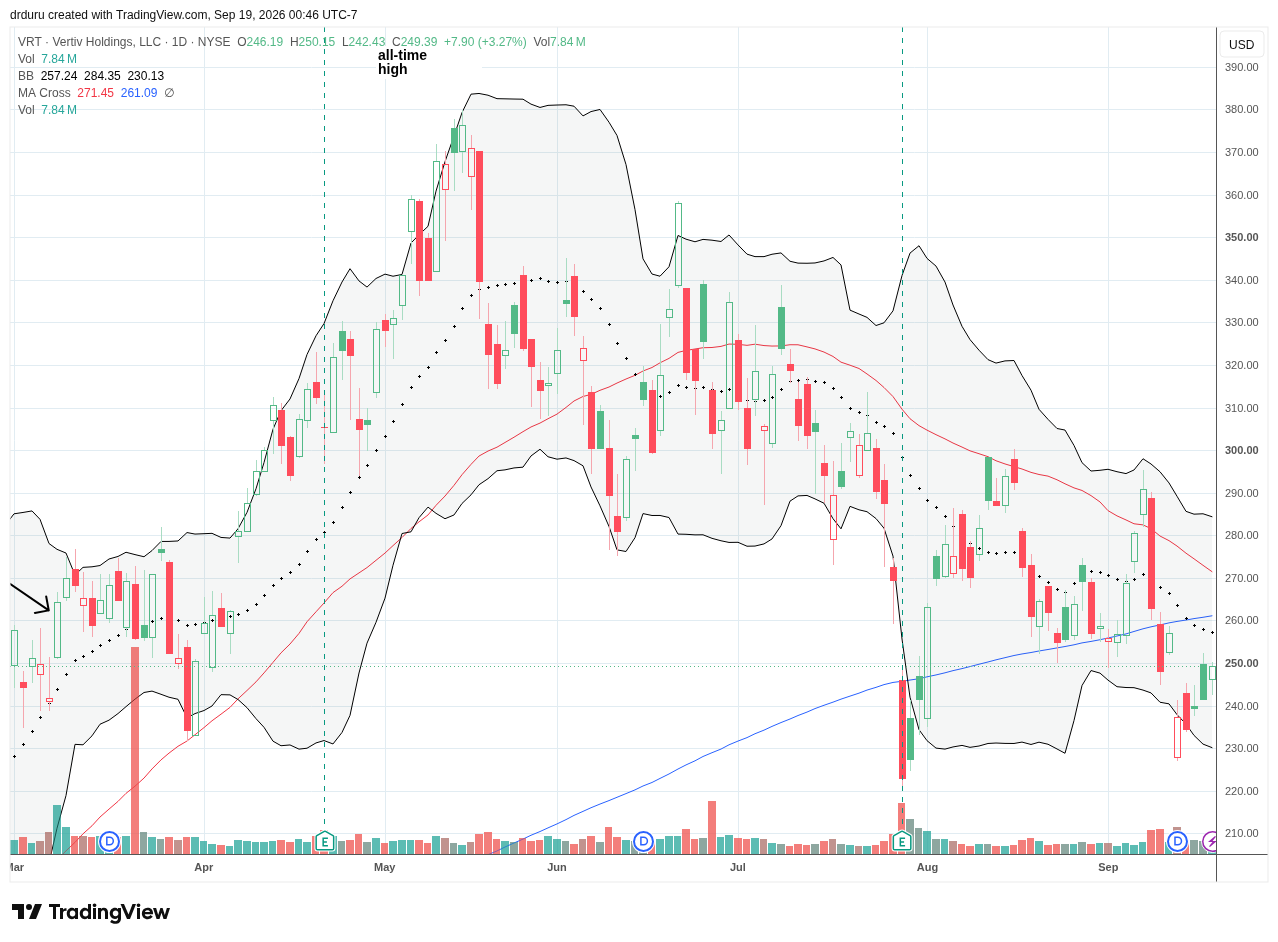
Vertiv Holdings Co. (VRT)
Description: Vertiv provides power, cooling and other critical digital infrastructure equipment and services for data centers and communications networks.
Technical Status: Vertiv Holdings Co. (VRT) recovered for three consecutive sessions after Monday’s 7.5% selloff, but remained below 200DMA resistance despite renewed demand for AI infrastructure.
Trade Commentary: VRT participated in the AI counter-Fed move, however the stock remains in a bearish position. The stock just barely reversed Monday’s gap down driven by the AI safety fears. VRT was one of the few short-term AI plays I trusted on Monday. I took profits on Friday. I remain wary about the bearish positioning.
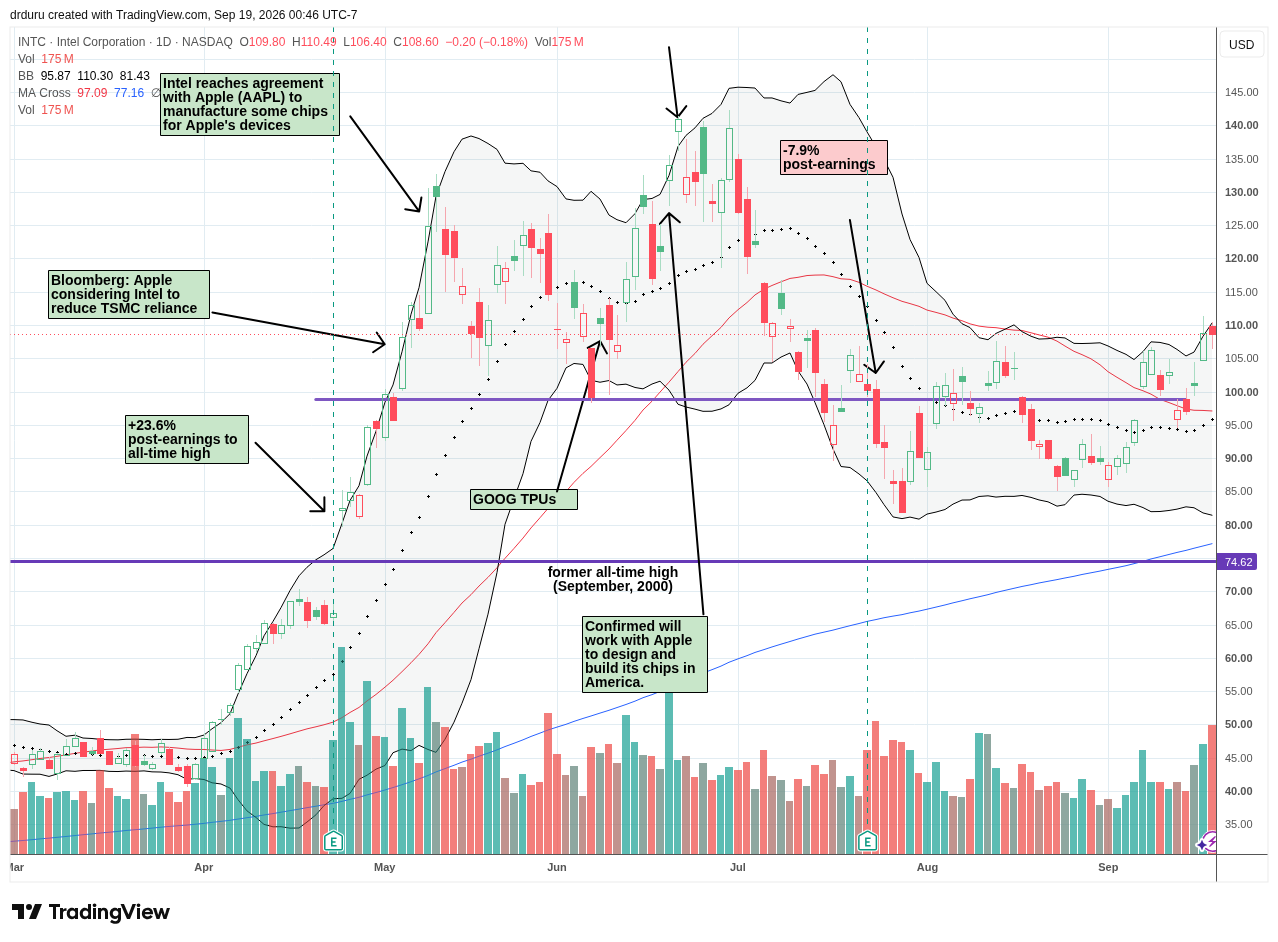
Intel Corp. (INTC)
Description: Intel designs and manufactures processors and other semiconductor products while operating a semiconductor foundry business.
Technical Status: Intel Corp. (INTC) reclaimed support at $100 and its 50DMA during a midweek rally driven by analyst optimism and reports involving its Ohio manufacturing capacity.
Trade Commentary: As promised some time ago, I have been much more vigilant on the short-term trading opportunities in INTC. INTC caught my attention with a 4.0% gain despite the Fed rate hike. The gap higher also confirmed 50DMA support, a near automatic buy for my INTC call-buying strategy. Another gap up on Thursday hit my profit target which meant that I left a lot of money on the table! Reports about a potential deal with SK Hynix helped propel INTC on Thursday.
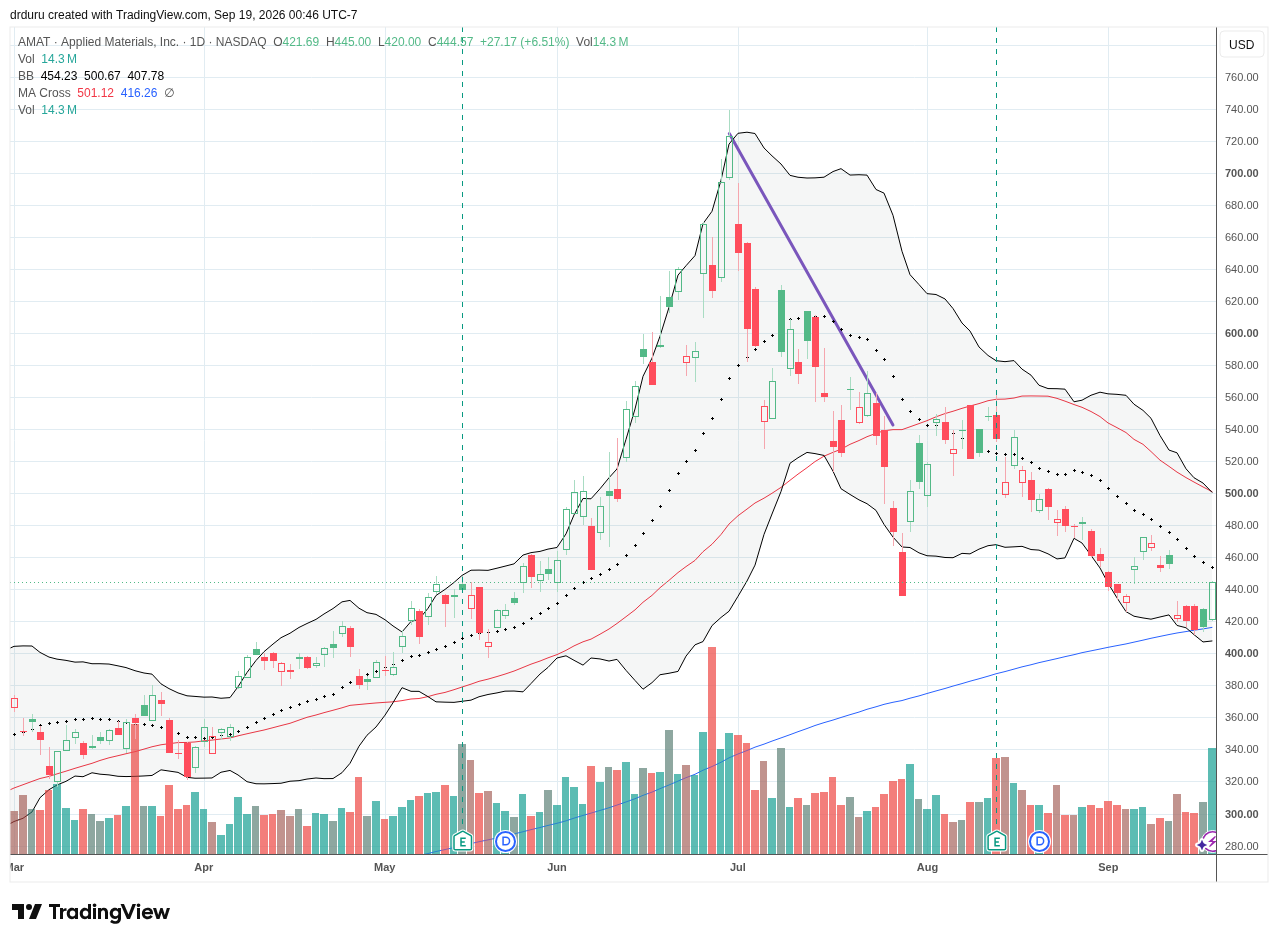
Applied Materials, Inc. (AMAT)
Description: Applied Materials supplies manufacturing equipment, services and technology used to produce semiconductors and advanced displays.
Technical Status: Applied Materials, Inc. (AMAT) jumped 6.5% Friday after testing its uptrending 200DMA, although the stock remained below its 20DMA and 50DMA resistance following its announced $5 billion India investment.
Trade Commentary: I was watching for AMAT to return to its bullish momentum. I thought the stock was ready when I bought shares on September after AMAT gapped higher for two straight days from the previous low for the month. Resistance from the downtrending 20DMA loomed large and primed the stock for a test of 200DMA support. Monday’s AI-safety fears sent AMAT down 7.1% and an official test of 200DMA support the next three days. I bought more shares on Tuesday in anticipation of a successful test. Friday’s 6.5% surge validated the decision but now 20DMA resistance looms again. On Thursday, AMAT announced plans to invest $5B in India over the next 10 years.
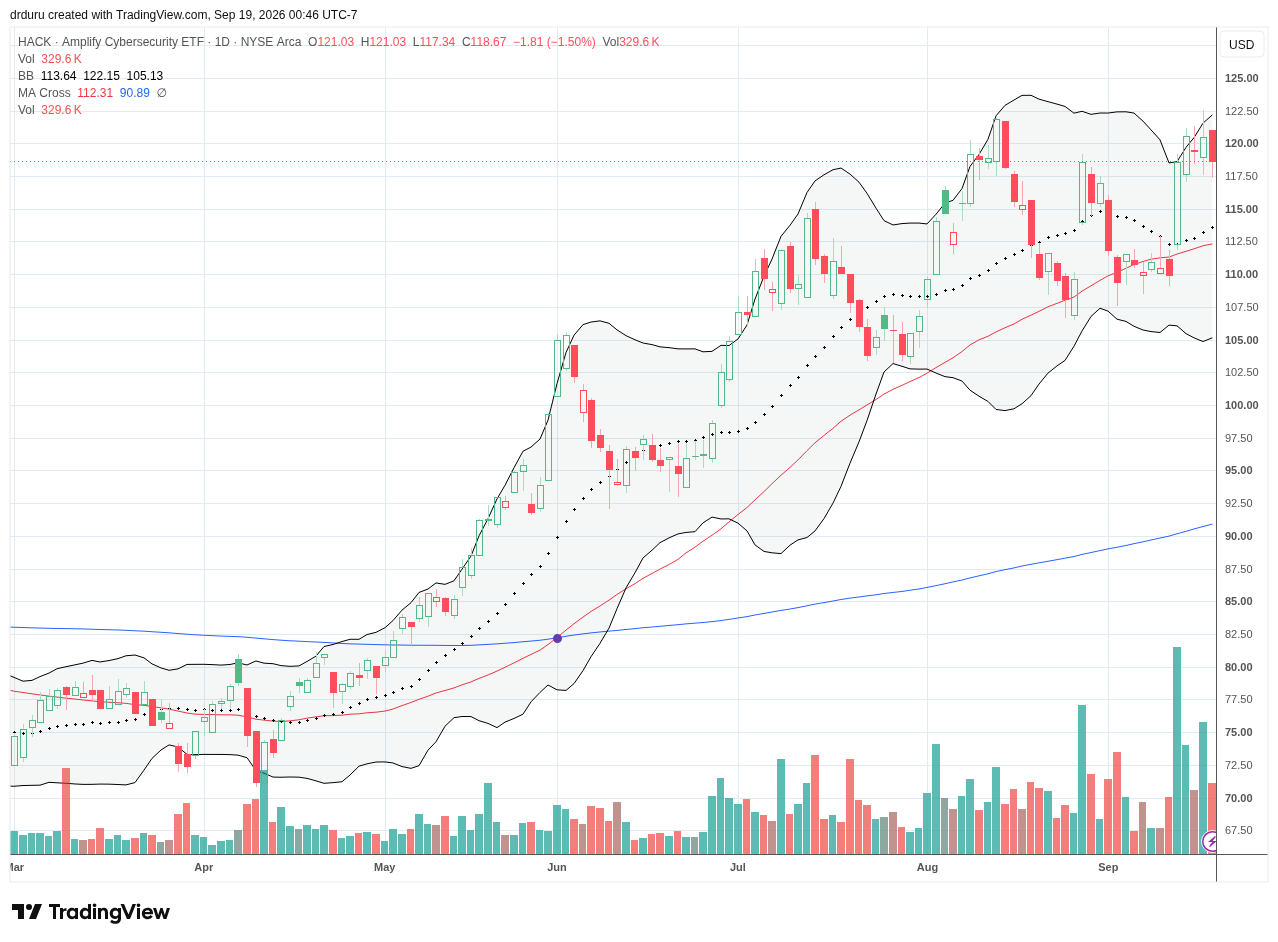
Amplify Cybersecurity ETF (HACK)
Description: Amplify Cybersecurity ETF invests in companies involved in cybersecurity hardware, software and related services.
Technical Status: Amplify Cybersecurity ETF (HACK) once again confirmed 50DMA support, yet the stock stalled at resistance from its all-time high.
Trade Commentary: Cybersecurity stocks benefited from Monday’s fears about AI safety. Collectively, these stocks helped to drive a 7.9% surge for HACK on Monday. The move took HACK to my short-term price target and validated my decision to hang on to my trade.
Financial Select Sector SPDR Fund (XLF)
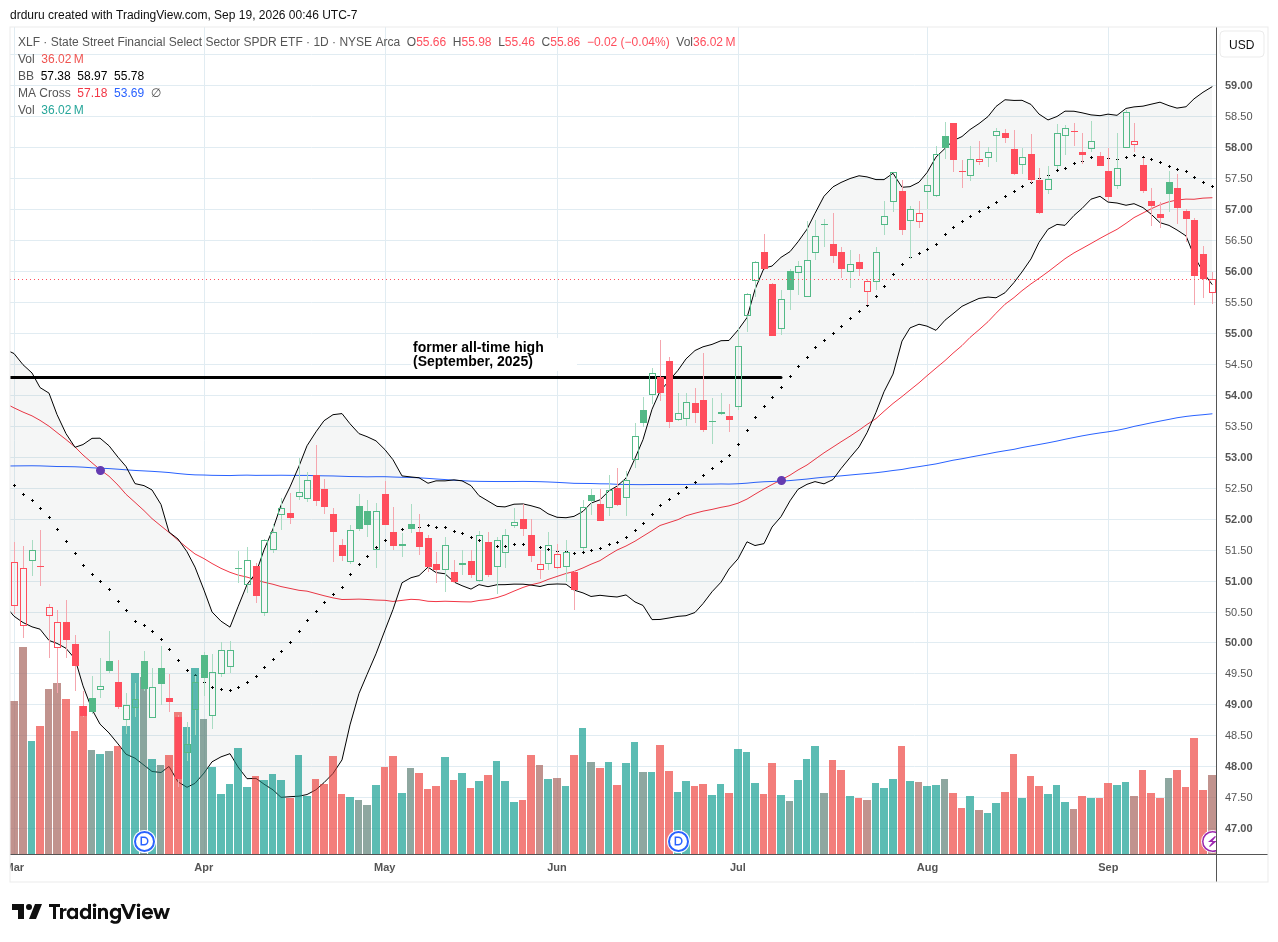
Description: Financial Select Sector SPDR Fund tracks large U.S. financial companies within the S&P 500, including banks, capital-markets firms, insurers and financial-services businesses.
Technical Status: Financial Select Sector SPDR Fund (XLF) confirmed a 50DMA breakdown and approached its lower Bollinger Band as financials failed to benefit from the Fed’s rate hike.
Trade Commentary: I expect financials to benefit from rate hikes given the spread banks can enjoy between loan and savings rates. However, XLF dropped 1.6% on Wednesday and the ETF flatlined from there. The 6-week low further confirmed a bearish 50DMA breakdown and left XLF in bearish position. Financials joined small caps in pressuring market breadth.
Goldman Sachs Group, Inc. (GS)
Description: Goldman Sachs is a global financial institution providing investment banking, markets, asset management and wealth-management services.
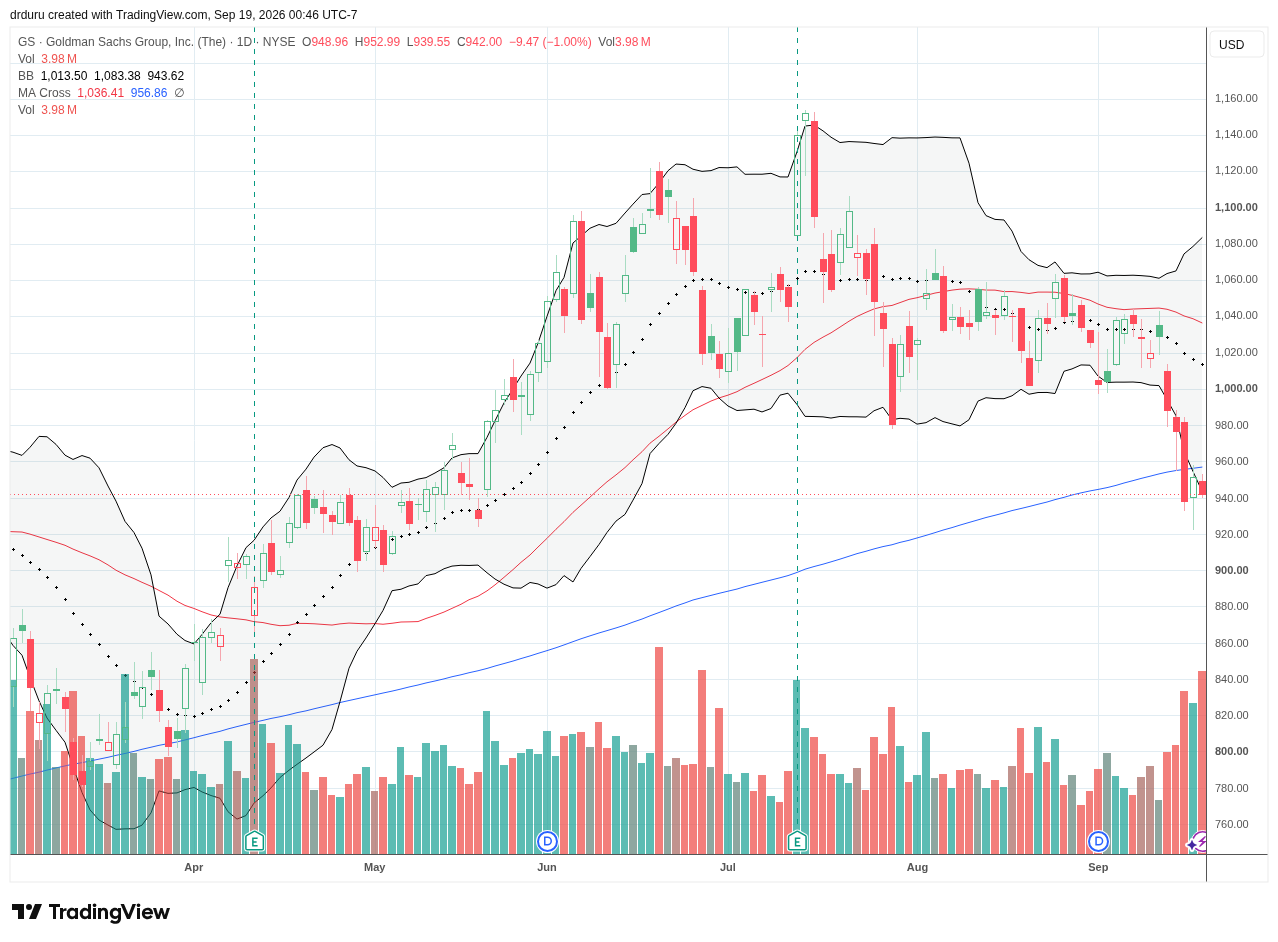
Technical Status: Goldman Sachs Group, Inc. (GS) sliced through 200DMA support and extended well below its lower Bollinger Band on elevated volume, illustrating the financial sector’s weak response to higher rates.
Trade Commentary: Of the group of sagging financials, GS suffered an outsized loss in the wake of the Fed’s rate hike punishment. The stock dropped 4.0% and sliced through 200DMA support. However, a warning about softness in fixed-income revenue and higher costs at the Barclays Global Financial Services Conference on Wednesday provided an even bigger reason for sellers to get active. A small rebound on Thursday staved off a confirmation of the bearish breakdown, but the stock still looks toppy.
Blue Owl Capital Inc. (OWL)
Description: Blue Owl Capital is an alternative asset manager investing across credit, real assets and GP strategic capital strategies.
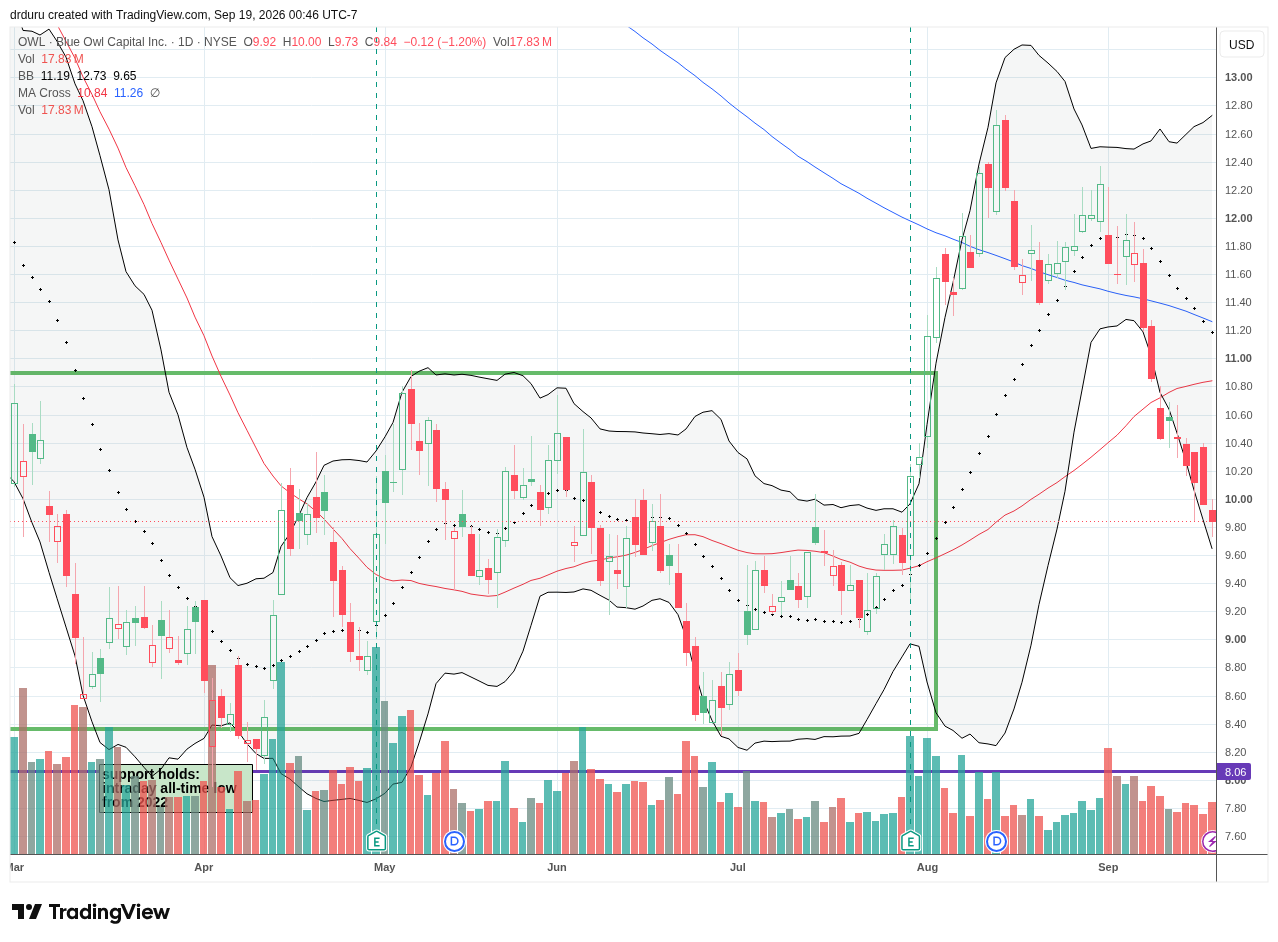
Technical Status: Blue Owl Capital Inc. (OWL) extended a sharp breakdown to $9.84, falling below its major DMAs in freshly bearish trading action.
Trade Commentary: OWL also presented at the Barclays Global Financial Services Conference (on Monday) and also fell for the week. Monday’s slippage stopped me out of the stock. Back in May I expressed a desire to hold on through stock weakness, but I could not stomach letting the rest of my profits evaporate after a bearish 50DMA breakdown that also confirmed an earlier bearish 200DMA breakdown.
SPDR Gold Shares (GLD)
Description: SPDR Gold Shares is an exchange-traded trust designed to reflect the price performance of physical gold bullion, less expenses.
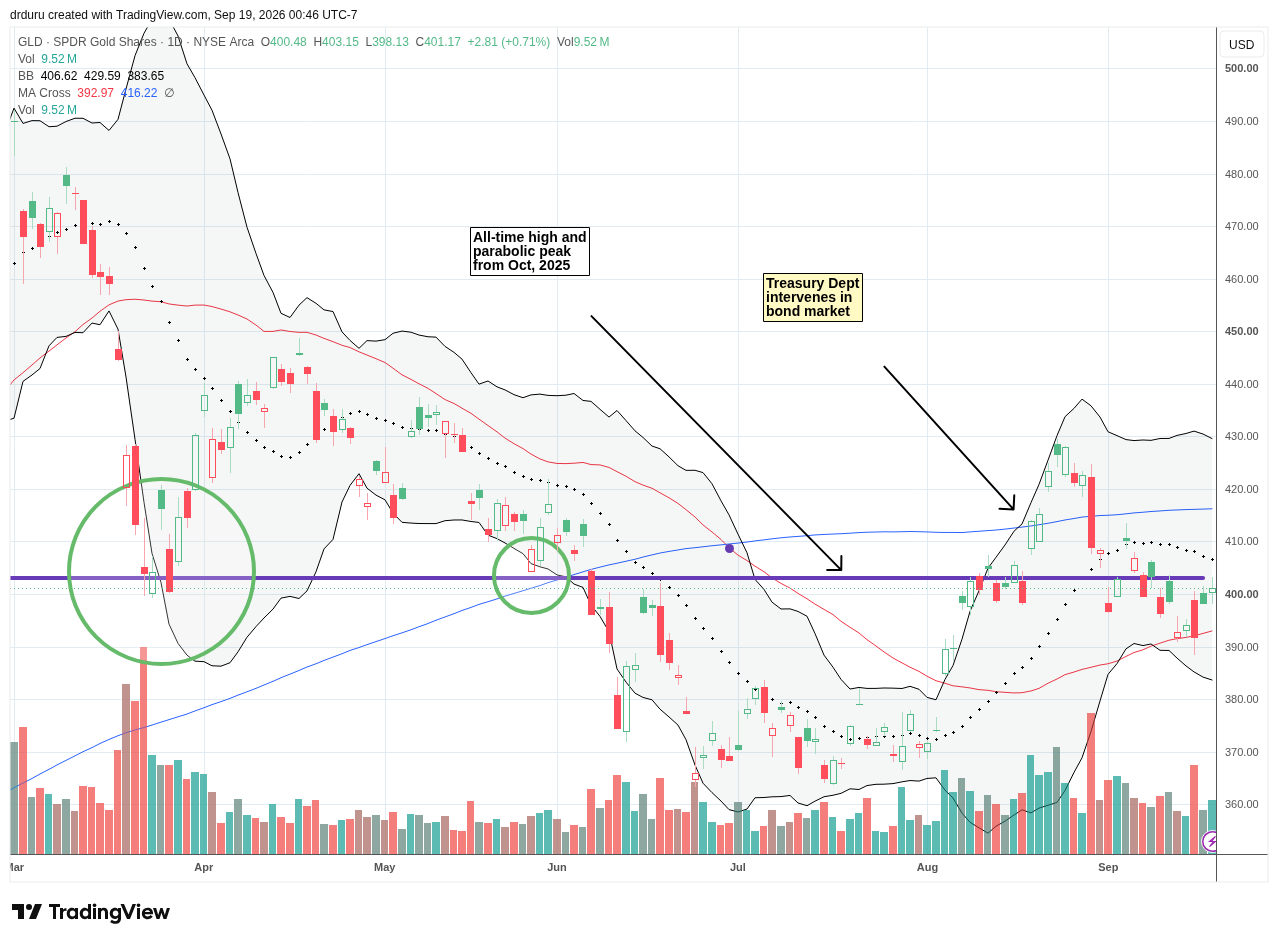
Technical Status: SPDR Gold Shares (GLD) recovered post-Fed with a successful test of 50DMA support but failed to break through the pivot formed by last October’s all-time high.
Trade Commentary: Wednesday’s Fed rate hike punishment delivered doubly surprising trading action on gold. First, I did not understand why GLD gapped higher. Next, I was surprised GLD held 50DMA support for the rest of the week. GLD ended the week in limbo right under the line that was an all-time high in October, 2025 and is now a pivot.
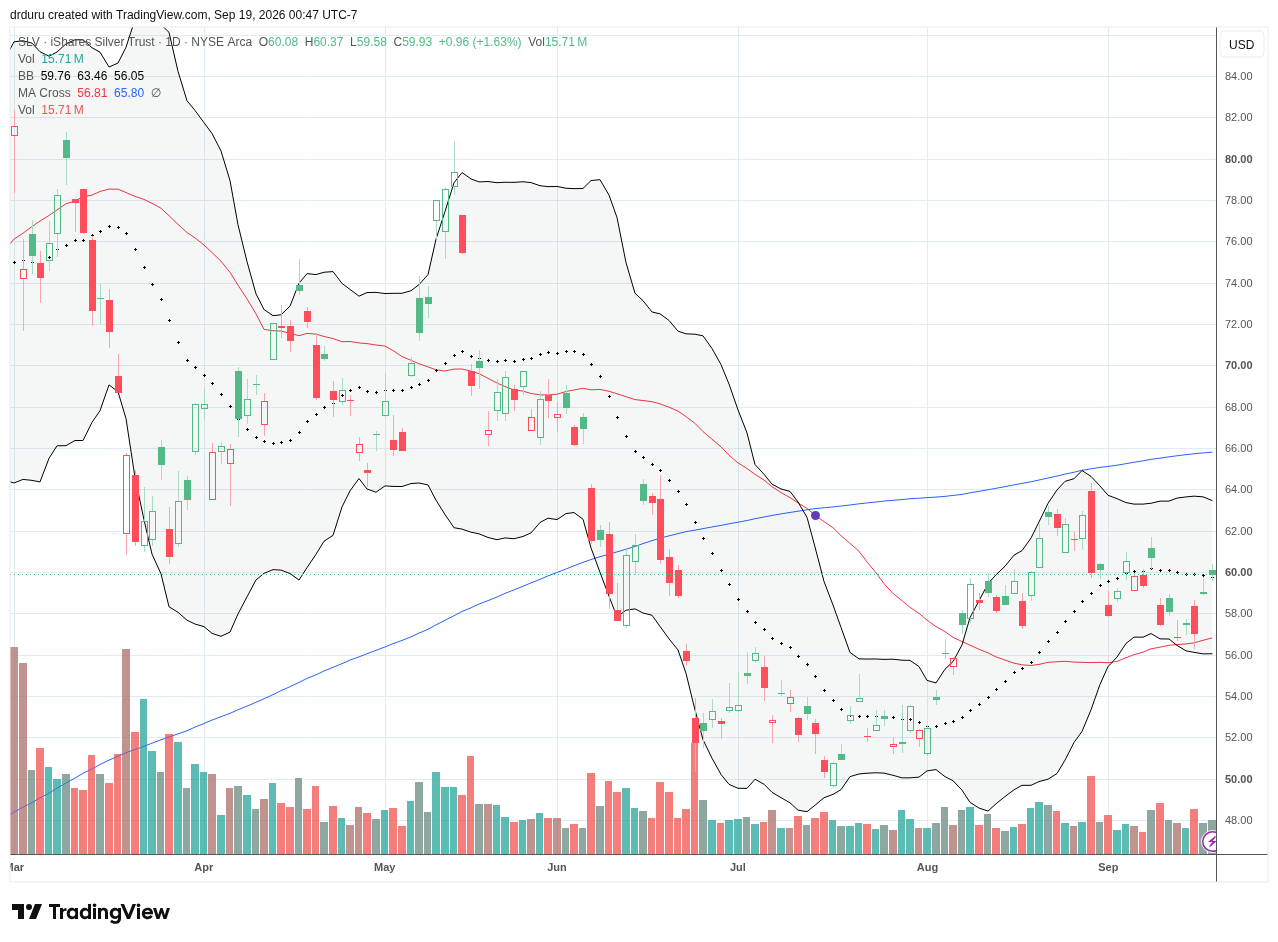
iShares Silver Trust (SLV)
Description: iShares Silver Trust is an exchange-traded trust designed to reflect the price performance of silver bullion, less expenses.
Technical Status: iShares Silver Trust (SLV) recovered post-Fed with a successful test of 50DMA support but closed the week right at 20DMA resistance.
Trade Commentary: The technical trading in SLV last week was nearly identical to GLD. If SLV moves higher from its close at 20DMA resistance, I become a buyer (adding to my gold-related positions).
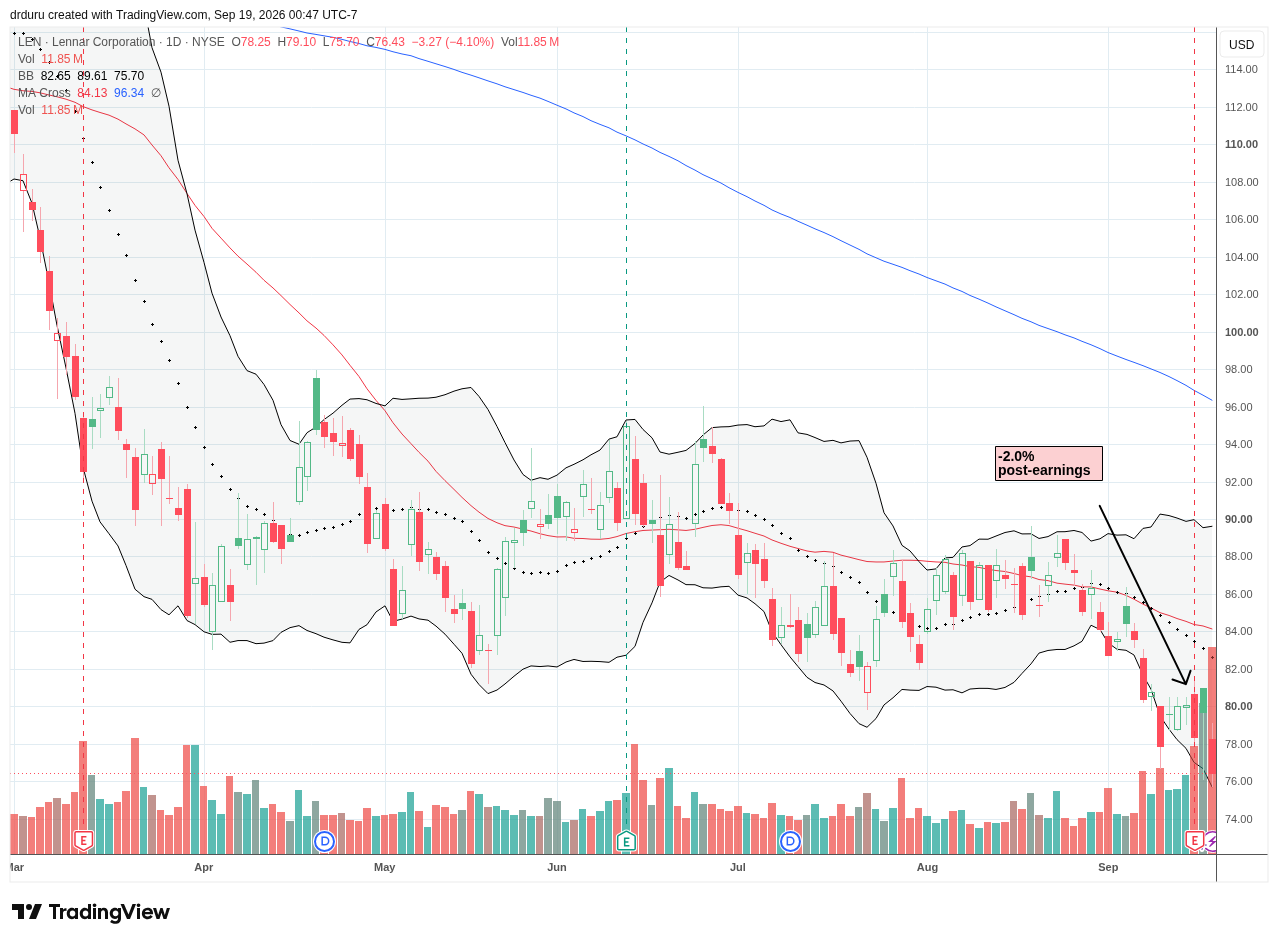
Lennar Corp. (LEN)
Description: Lennar is a U.S. homebuilder that develops and sells residential homes and also provides mortgage, title and closing services.
Technical Status: Lennar Corp. (LEN) fell 4.1% Friday and closed near a 4-year low, extending a post-earnings breakdown as weak housing results collided with rising mortgage rates.
Trade Commentary: Lennar reported third-quarter results Wednesday with new orders down 9% year over year, deliveries down 3% and home-sale gross margin at 15.8%. Revenue was $8.0 billion and diluted EPS was $1.19. I was surprised LEN only declined 2.1% with the poor results and Fed rate hike. I was not surprised the selling pressure continued on Friday with a 4.1% loss. The near 4-year low symbolizes the on-going issues with the housing market.
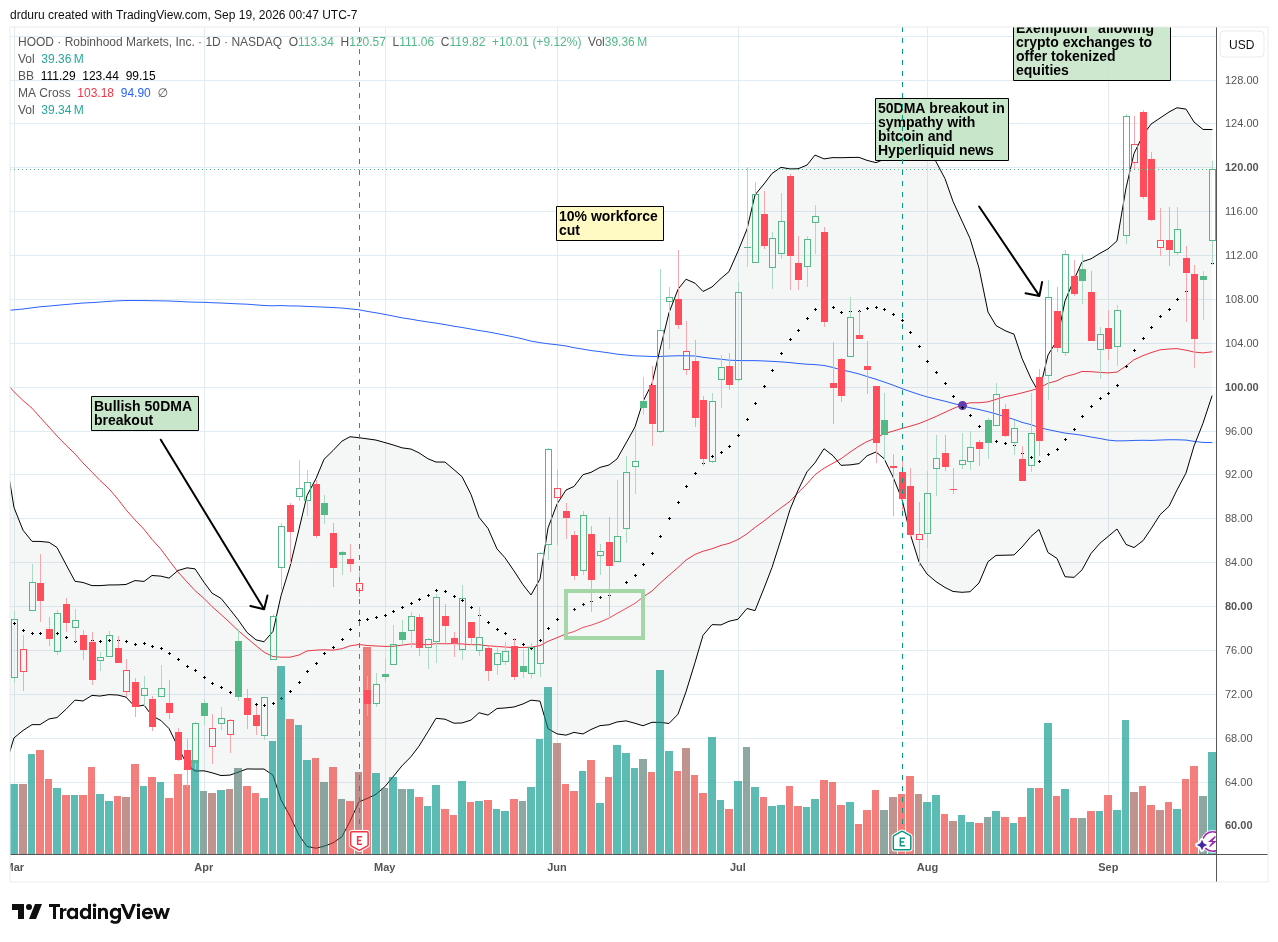
Robinhood Markets, Inc. (HOOD)
Description: Robinhood operates a financial-services platform offering brokerage, cryptocurrency trading, advisory, banking and other investing products.
Technical Status: Robinhood Markets, Inc. (HOOD) surged 9.1% Friday and confirmed 50DMA support as Bitcoin’s move above $80,000 revived demand for crypto-linked equities.
Trade Commentary: When HOOD lost 5.5% in the wake of the Fed’s rate hike punishment, I nearly pulled the trigger to buy back in. The stock dipped below 50DMA support and recovered. I decided to wait for a confirmation, but Thursday’s bounce was so high, a gain of 5.2%, I hesitated, unwilling to chase the stock. Friday’s 9.1% surge in sympathy with Bitcoin’s 5.9% surge felt like the financial market mocking my timidity over a trade I was monitoring like a hawk!
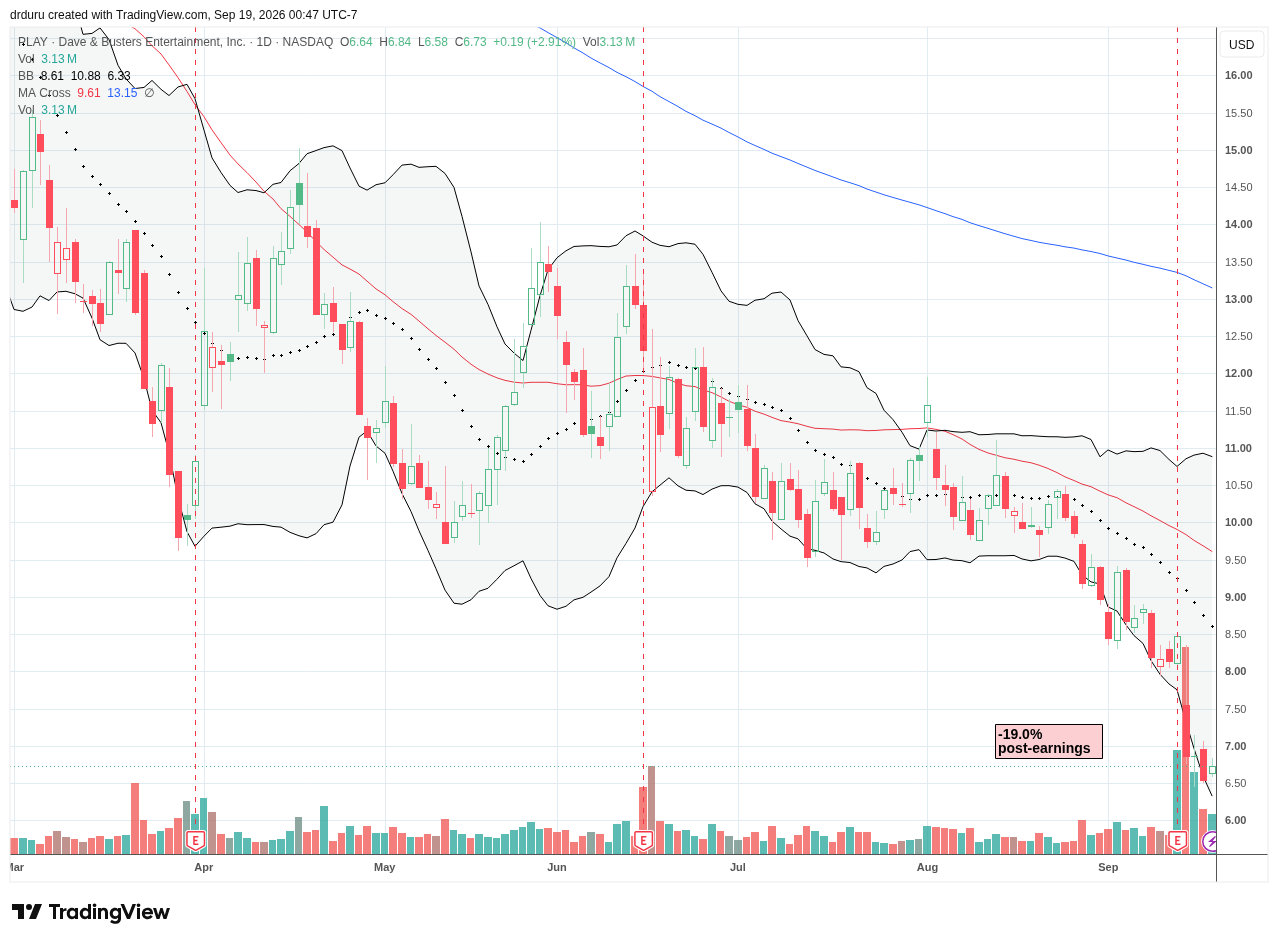
Dave & Buster’s Entertainment, Inc. (PLAY)
Description: Dave & Buster’s operates entertainment and dining venues combining arcade games, food, beverages and sports viewing.
Technical Status: Dave & Buster’s Entertainment, Inc. (PLAY) stabilized only modestly after its 19% post-earnings collapse and traded back to pandemic price levels.
Trade Commentary: Last week was the week I finally and belatedly accepted an end to the trade on insider purchases of PLAY. PLAY plunged 19.0% post-earnings after another disappointing performance. The company reported a quarterly loss Monday as revenue fell 2.4% to $544.1 million and same-store sales declined 2.9%. Entertainment revenue dropped 9%, outweighing a 2.4% increase in food and beverage sales. I will continue holding trades for now, but of course the prognosis is poor with consumer-facing stocks weakening in the face higher oil prices and tighter financial conditions.
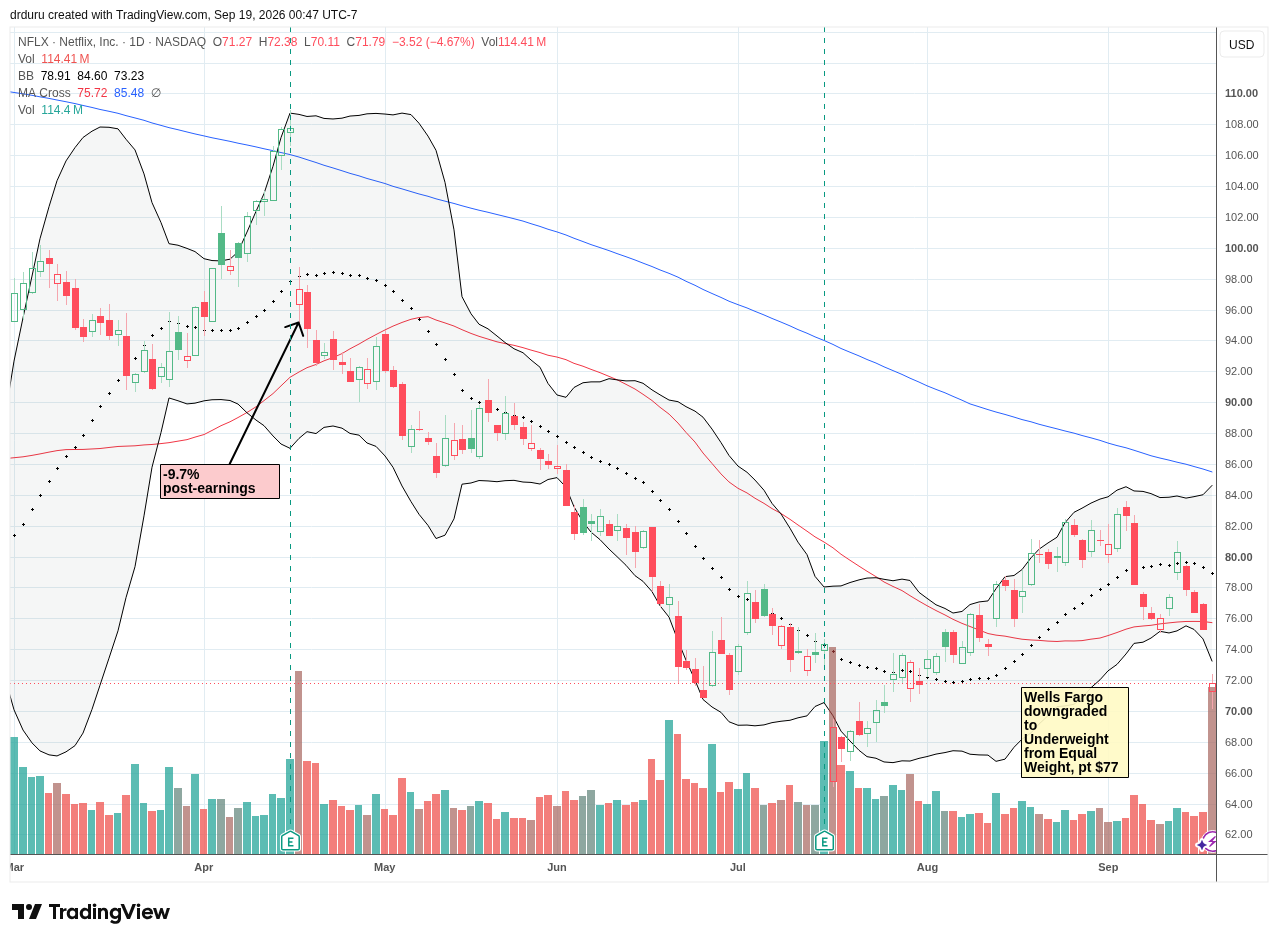
Netflix, Inc. (NFLX)
Description: Netflix operates a global subscription streaming service offering television series, films, live programming and other entertainment content.
Technical Status: Netflix, Inc. (NFLX) dropped 4.7% Friday following Wells Fargo’s downgrade, breaking well below its lower Bollinger Band and all major DMAs to finish the week down roughly 7%.
Trade Commentary: Speaking of a stock getting harder to hold, NFLX confirmed a 50DMA breakdown after Wells Fargo downgraded Netflix to Underweight on Friday, citing weakening engagement, a softer original-content slate and potential margin and churn pressure. While I consider NFLX’s persistent weakness this year as an amazing long-term buying opportunity, I will have to give up on the position if the stock breaks down further below the July low.
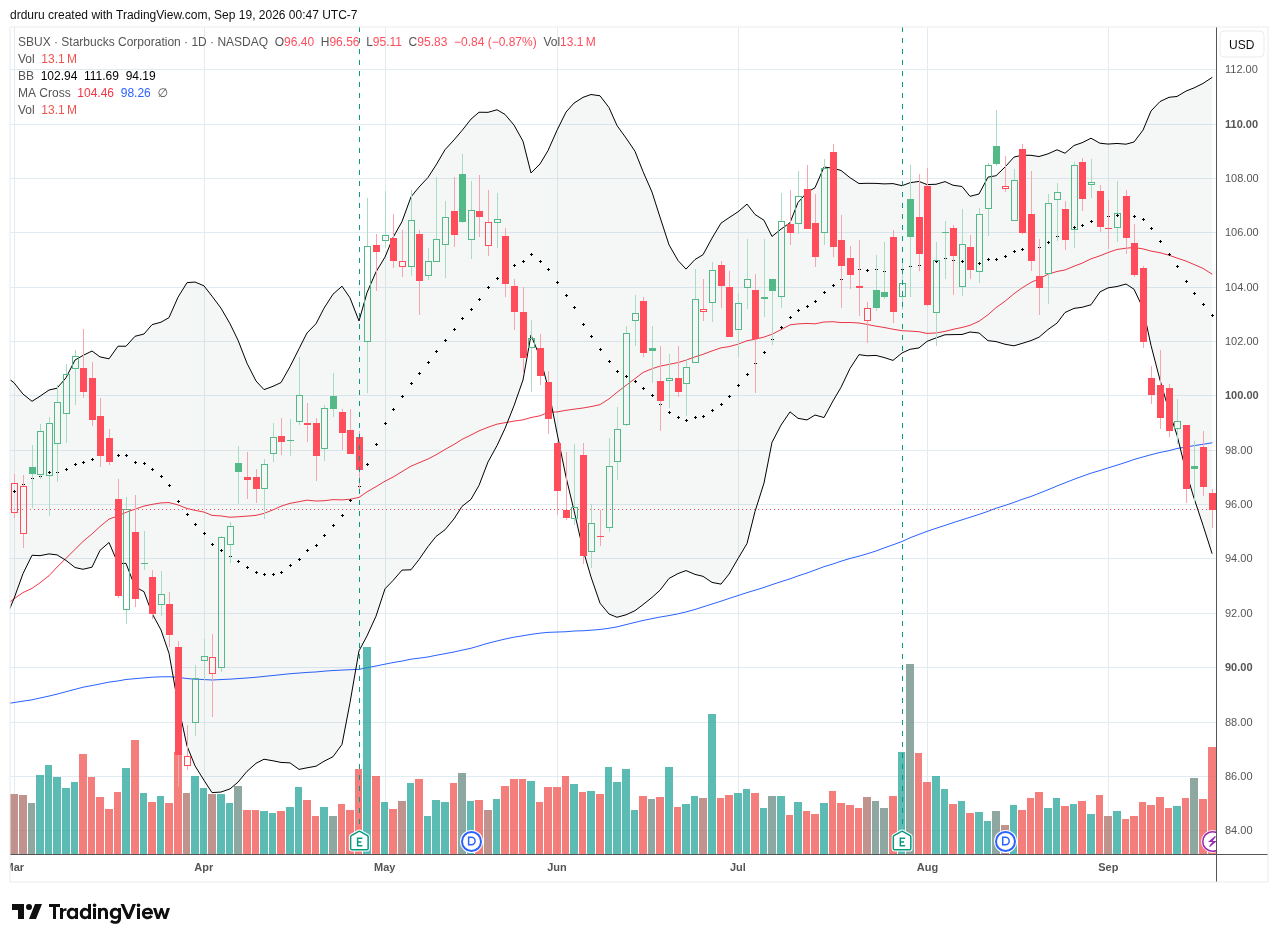
Starbucks Corp. (SBUX)
Description: Starbucks operates and licenses coffeehouses worldwide and sells coffee, beverages, food and related consumer products.
Technical Status: Starbucks Corp. (SBUX) lost approximately 3% for the week, breaking below its 200DMA support and approaching its lower Bollinger Band as consumer stocks remained under pressure.
Trade Commentary: SBUX hit a 17-month high last month. Yet, the growing weakness in consumer-facing stocks finally got to the stock in the first few days of September. While SBUX held up on Wednesday, the sellers followed through on Tuesday’s 200DMA breakdown. The stock is in bearish territory until it can reclaim its 200DMA as support. I prematurely covered a short position and took profits ahead of what I thought would be a successful defense of 200DMA support. I am reluctant to short it again here because the stock could suddenly surge higher on a positive catalyst like a drop in oil prices.
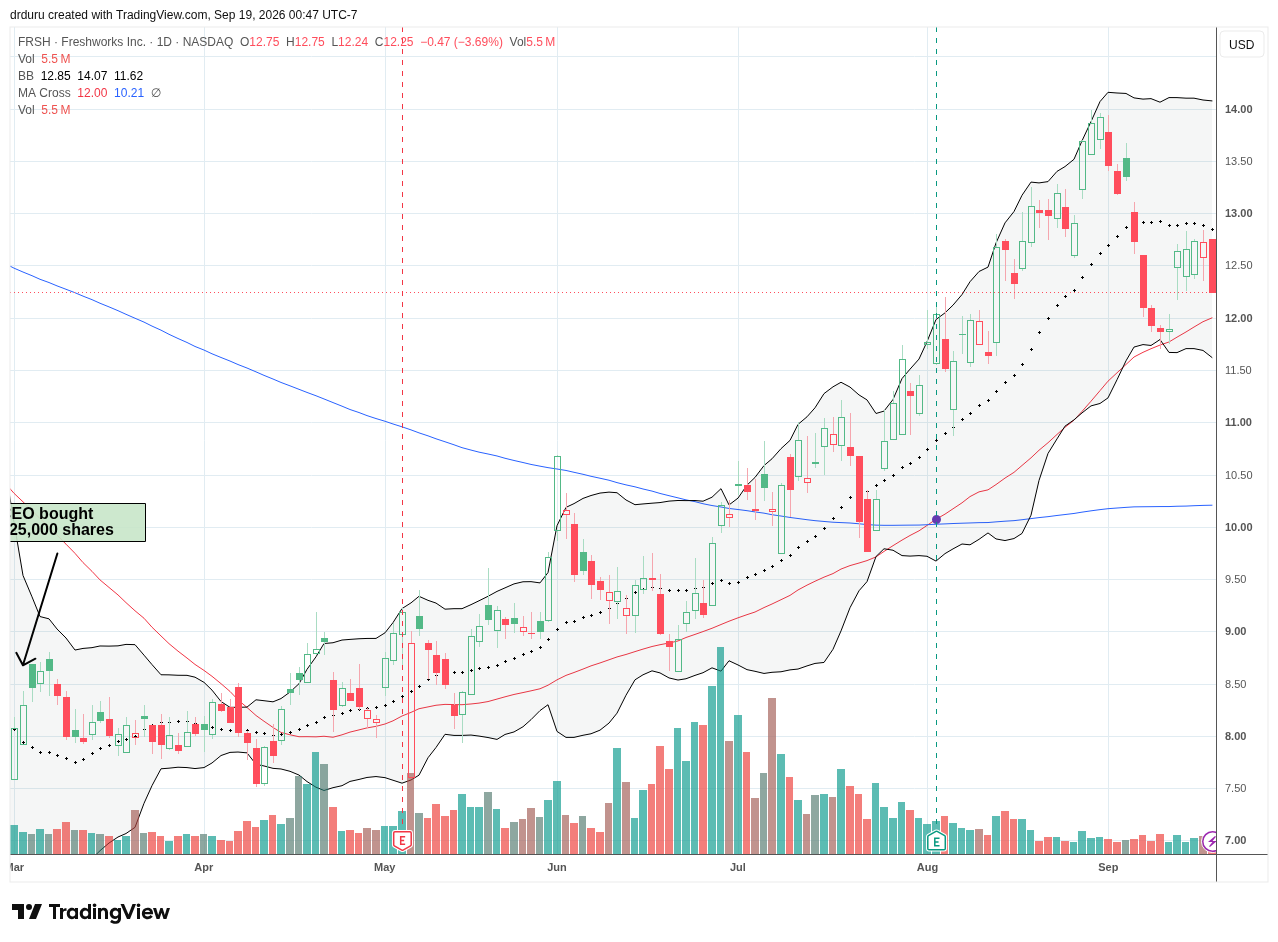
Freshworks Inc. (FRSH)
Description: Freshworks develops cloud-based customer-support, IT-service-management and customer-engagement software for businesses.
Technical Status: Freshworks Inc. (FRSH) fell 3.7% Friday, erasing much of its rebound and stalling at 20DMA resistance, although its 50DMA and 200DMA continued to provide support.
Trade Commentary: Freshworks has AI-driven software and alternatively trades like a software stock and then an AI stock. On Monday it traded like a software stock as money ran from AI stocks and rotated partially to software. Like the rest of the software sector, FRSH stalled from there. Friday’s 3.7% pullback made the 20DMA look like tight resistance. Thus, I am bracing for a new test of 50DMA support. While I hope FRSH will survive as well as it did earlier in the month, I am prepared for a breakdown that would end the momentum that I hoped to keep riding for many more months and more. At which point, I would stop out of my position in order to preserve profits.
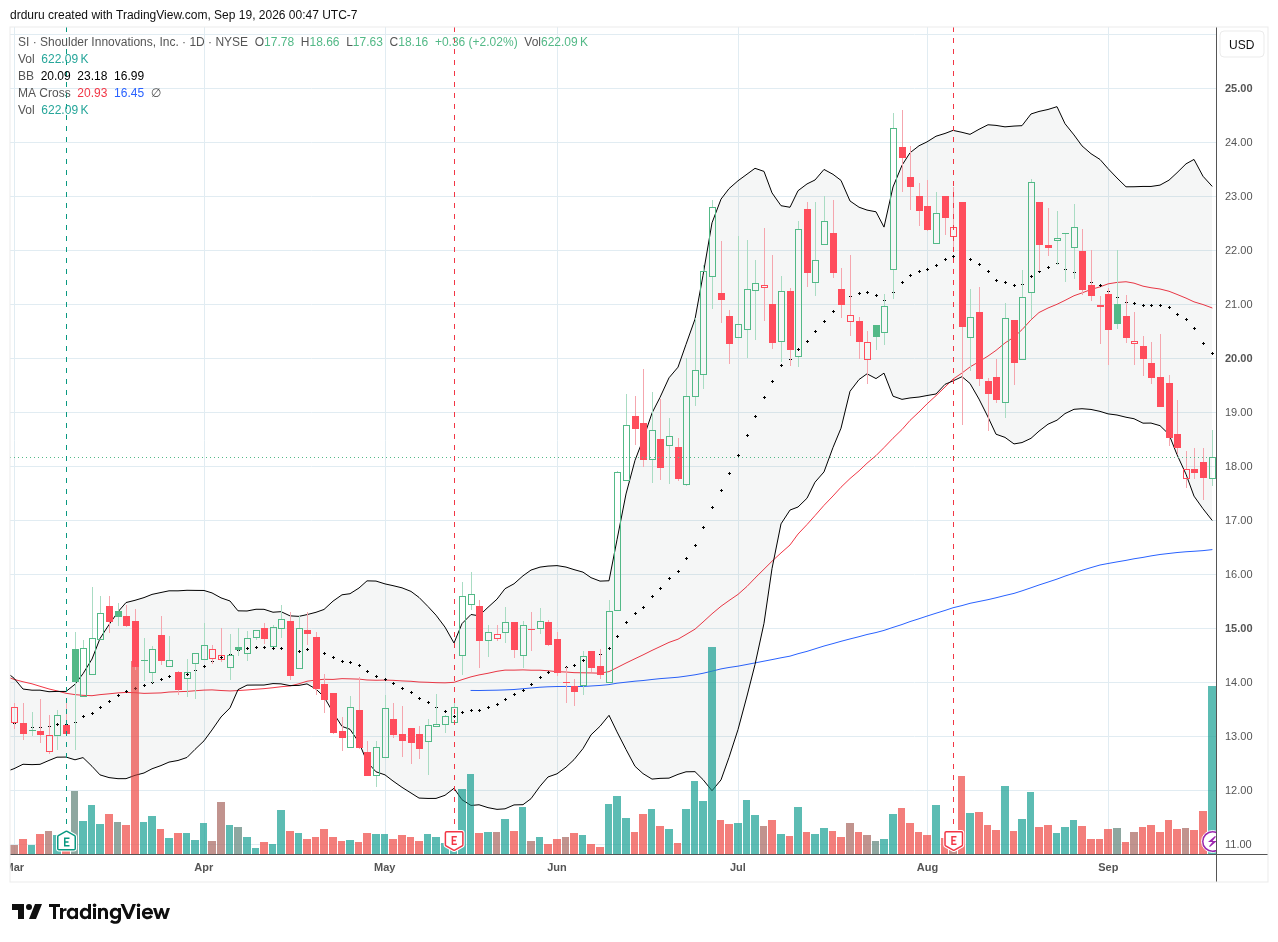
Shoulder Innovations, Inc. (SI)
Description: Shoulder Innovations is a medical-technology company developing and commercializing implant systems and related technologies for shoulder replacement surgery.
Technical Status: Shoulder Innovations, Inc. (SI) bounced 2% Friday, but remained below its 20DMA and 50DMA after its conference appearance produced no new operating catalyst.
Trade Commentary: Shoulder Innovations participated on Tuesday in the Morgan Stanley Healthcare Conference. The stock dropped 2.2% that day and churned the rest of the week. I had big expectations for SI that looked good until August earnings brought momentum to a halt. I held shares through the large swings, but I now sit unrewarded with the stock headed for a test of 200DMA support.
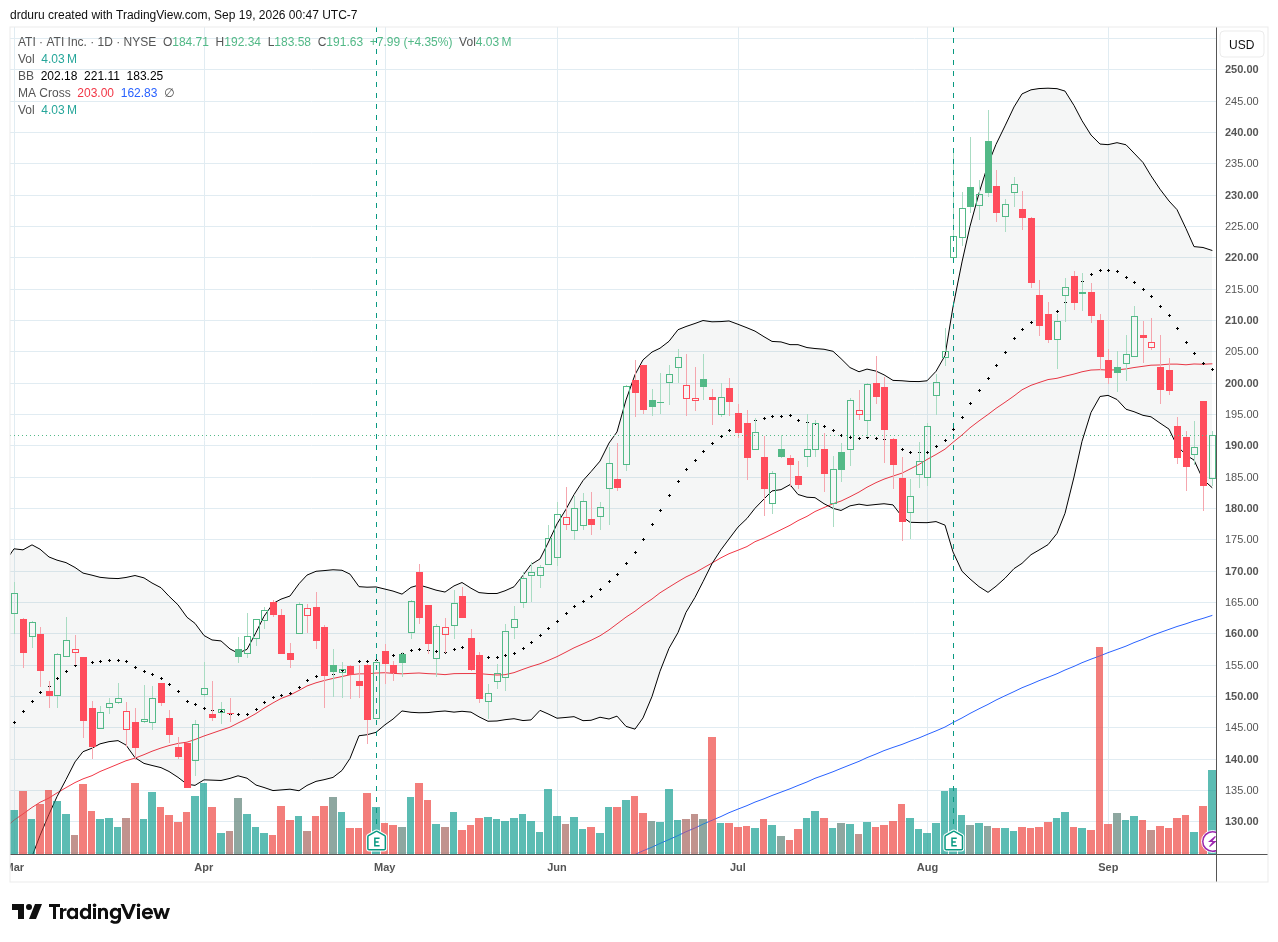
ATI Inc. (ATI)
Description: ATI produces specialty materials and advanced alloys used in aerospace, defense and other demanding industrial applications.
Technical Status: ATI Inc. (ATI) confirmed a 50DMA breakdown and is positioned for an imminent test of 200DMA support.
Trade Commentary: My July purchase of ATI looked timely. An 8.9% post-earnings jump in August seemed to validate my position. Unfortunately, the stock soon topped out and has fallen from the post-earnings all-time highs ever since. The extended stay below the 50DMA makes me worry that the stock is in the middle of an extended breakdown and topping period. I will continue holding the stock unless it suffers a 200DMA breakdown.
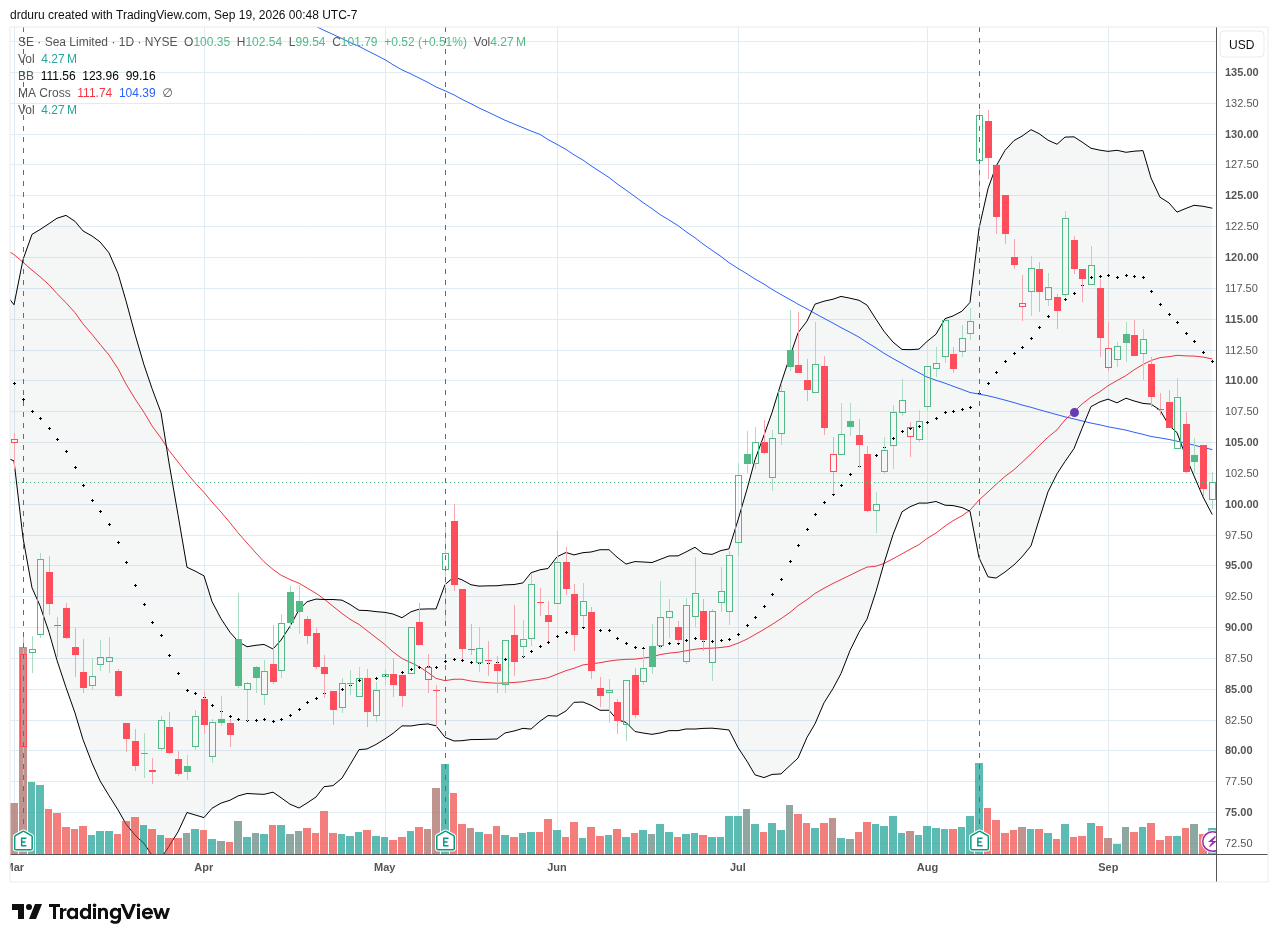
Sea Limited (SE)
Description: Sea Limited is a global technology company operating the Garena digital-entertainment, Shopee e-commerce and Monee digital-financial-services businesses.
Technical Status: Sea Limited (SE) managed a 0.5% Friday rebound but earlier confirmed a 200DMA breakdown.
Trade Commentary: I bought SE at 20DMA support just as the stock finished reversing its 14.6% post-earnings gain from August. I bailed last week after the first breach of 200DMA support. The stock will only return to my shopping list with a 50DMA breakout.
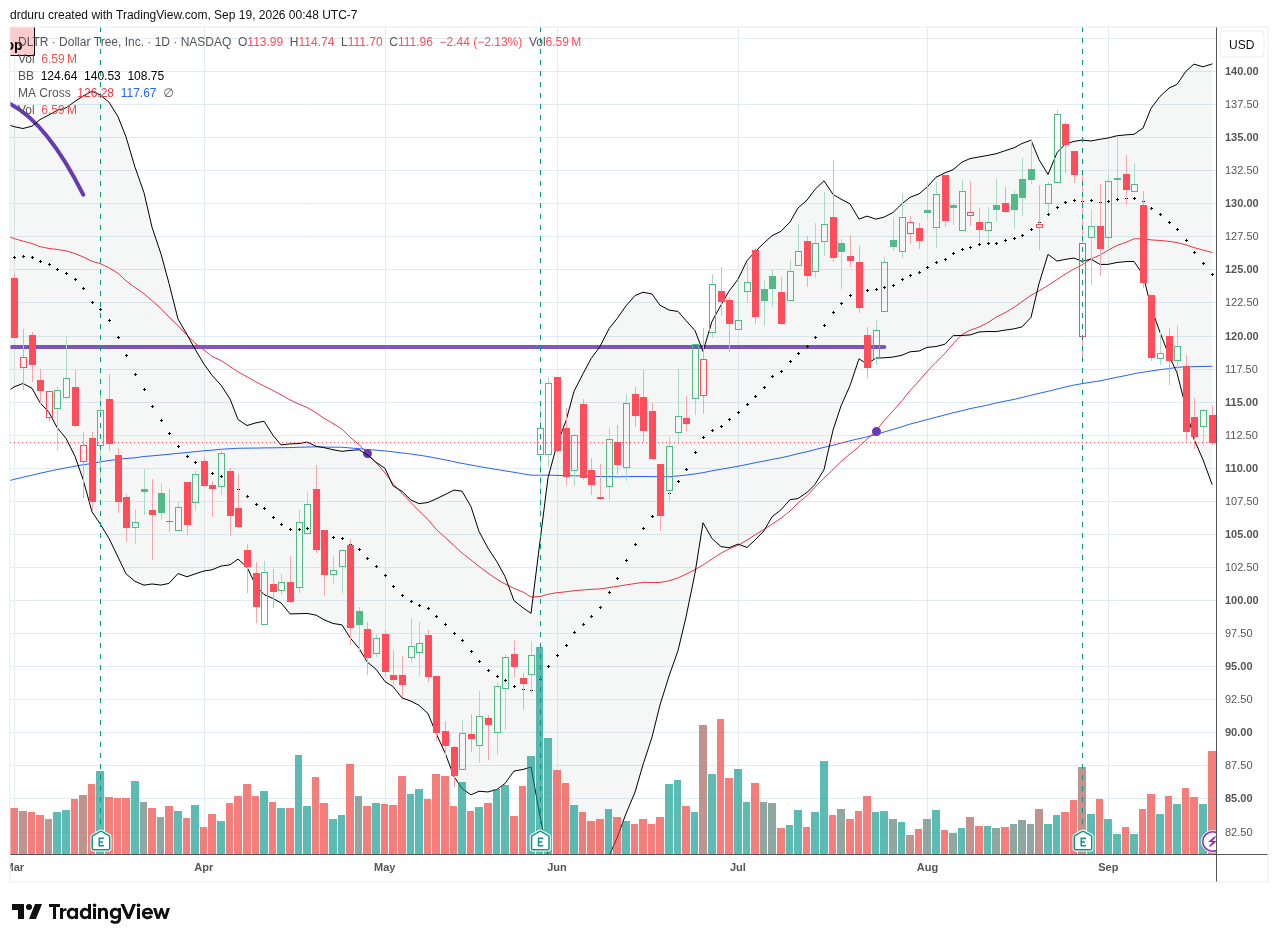
Dollar Tree, Inc. (DLTR)
Description: Dollar Tree operates discount retail stores selling consumable goods, household products and discretionary merchandise at value-oriented price points.
Technical Status: Dollar Tree, Inc. (DLTR) fell 2.1% Friday after confirming a 200DMA breakdown, reflecting mounting pressure on consumer-oriented equities.
Trade Commentary: DLTR fell 5.4% the day before the Fed rate hike. The next day the stock confirmed a 200DMA breakdown and is thus in bearish territory again. DLTR is positioned to reverse its May post-earnings gains and thus looks like a short.
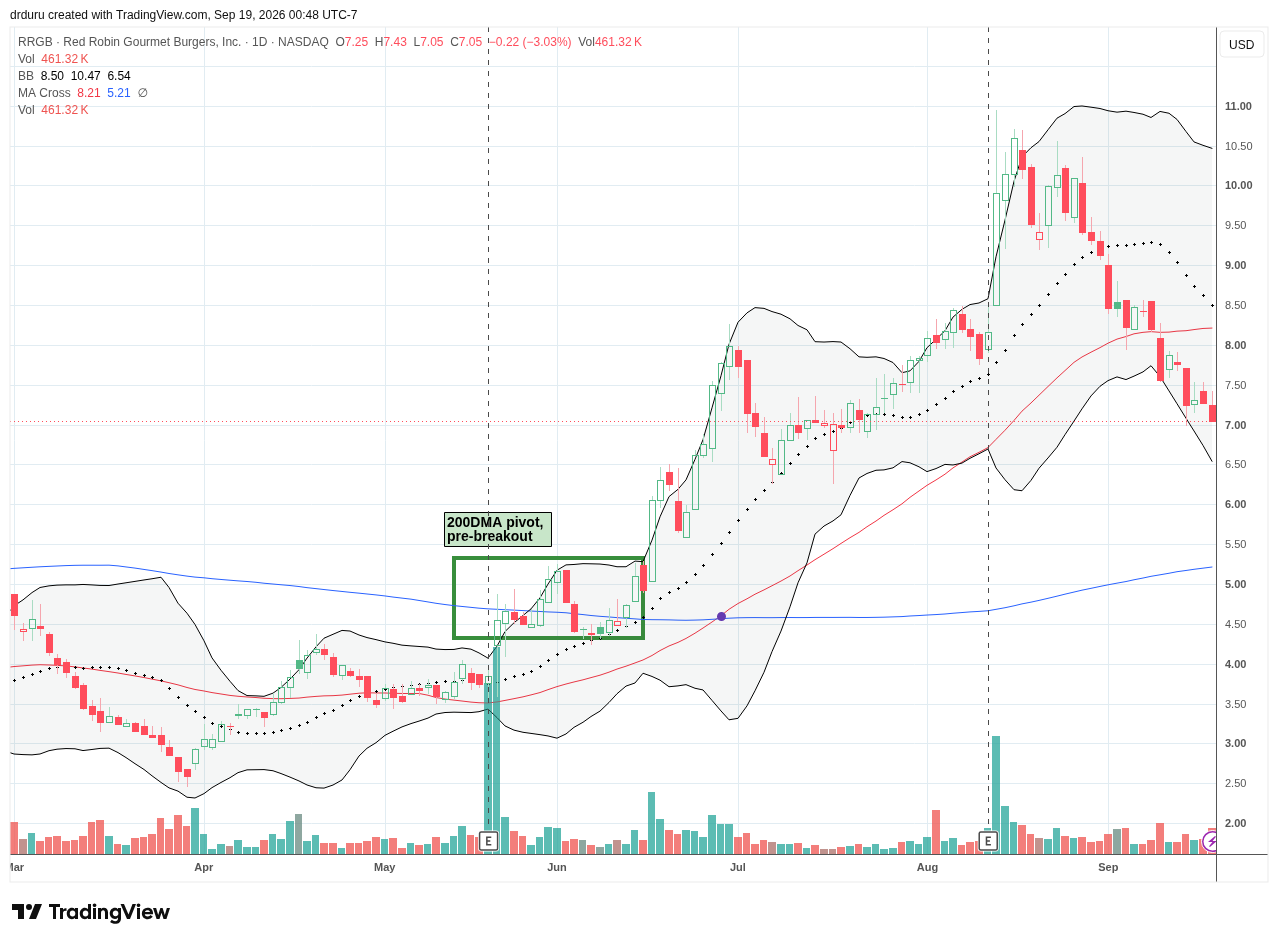
Red Robin Gourmet Burgers, Inc. (RRGB)
Description: Red Robin operates and franchises casual-dining restaurants specializing in burgers and related food and beverage offerings.
Technical Status: Red Robin Gourmet Burgers, Inc. (RRGB) declined 3% Friday to $7.05, extending a complete post-earnings reversal and a retreat below 20DMA and 50DMA supports as macro pressures weighed on smaller restaurant stocks.
Trade Commentary: Last month I lamented getting stopped out of RRGB. Last week the stock returned to price levels where I took profits. RRGB reversed an impressive 21.3% gain, sliced below 50DMA support, and its current downtrend points to an eventual test of 200DMA support as pressure continues building for consumer-facing stocks.
Footnotes
Subscribe for free to get email notifications of future posts!
“Above the 50” (AT50) uses the percentage of stocks trading above their respective 50-day moving averages (DMAs) to measure breadth in the stock market. Breadth defines the distribution of participation in a rally or sell-off. As a result, AT50 identifies extremes in market sentiment that are likely to reverse. Above the 50 is my alternative name for “MMFI” which is a symbol TradingView.com and other chart vendors use for this breadth indicator. Learn more about AT50 on my Market Breadth Resource Page. AT200, or MMTH, measures the percentage of stocks trading above their respective 200DMAs.
Active AT50 (MMFI) periods: Day #291 over 20%, Day #118 over 30% (overperiod), Day #7 under 40% (underperiod), Day #8 under 50%, Day #24 under 60%, Day #264 under 70%
Source for charts unless otherwise noted: TradingView.com
Full disclosure: long USO put spread and put, long SPY, long IWM call options, long AMAT, long GLD and PHYS and RAAX, long PLAY, long NFLX, long FRSH, long ATI
FOLLOW Dr. Duru’s commentary on financial markets via StockTwits, BlueSky, and even Instagram!
*Charting notes: Stock prices are not adjusted for dividends. Candlestick charts use hollow bodies: open candles indicate a close higher than the open, filled candles indicate an open higher than the close.
* Blog notes: I use ChatGPT to help with editing and news discovery.