
The Market Breadth Summary
- Market breadth rebounded even as the S&P 500 and Nasdaq confirmed breakdowns below their 50-day moving averages.
- The topping AI trade weakened across semiconductors, AI infrastructure, and mega-cap technology stocks while financials and healthcare attracted buying interest.
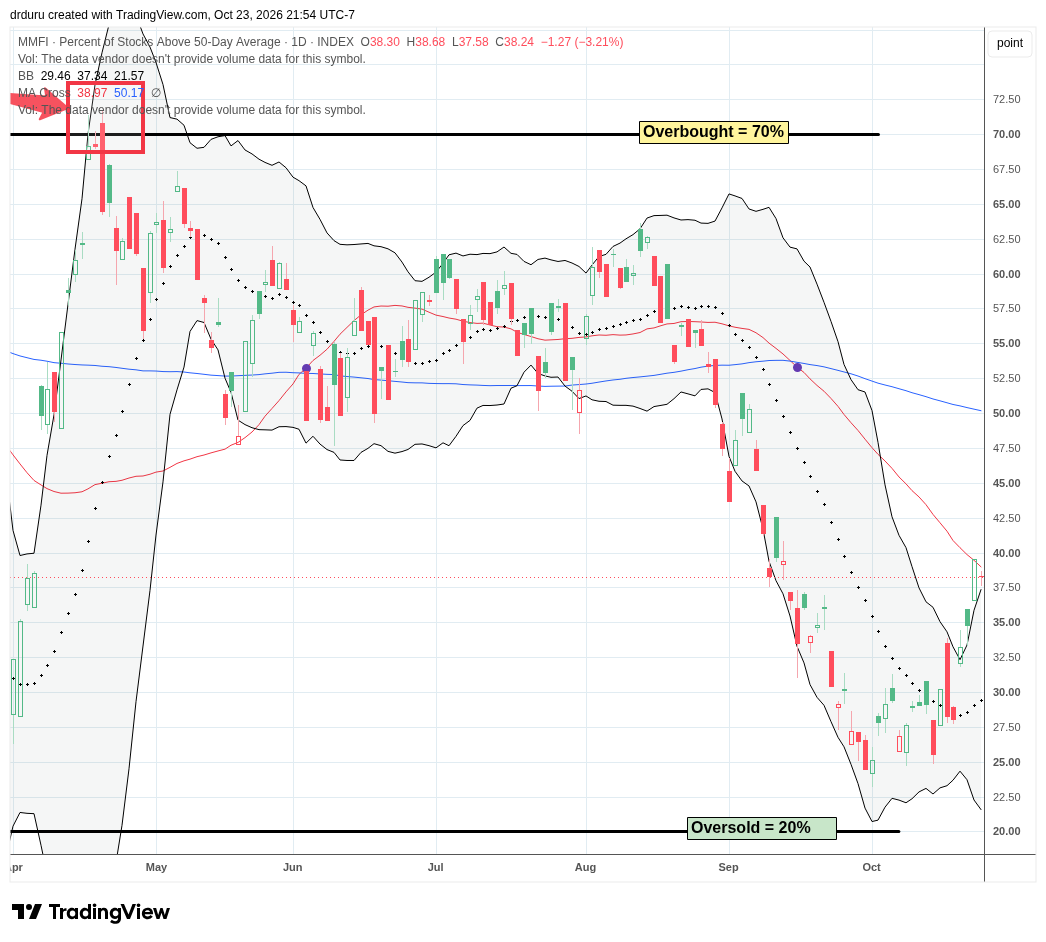
- AT50 surged 10 percentage points to 38.2%, while AT200 stood at 43.9%, but both market breadth indicators encountered important resistance.
- Software and selected consumer stocks demonstrated renewed strength despite continued weakness in small caps and major technology indices.
- The VIX remained elevated near 20, and the short-term trading call stayed neutral ahead of the Federal Reserve’s monetary policy decision.
The Stock Market Summary
The stock market finds itself in a place I did not fully anticipate, even as recently as my last market check-in. Market breadth is rebounding as I suspected it might, and the recovery increasingly looks like a bottoming process. Yet the recovery is leaving behind the once-dominant artificial intelligence (AI) trade. While the major indices struggle with breakdowns below key moving averages, buying interest is spreading across financials, healthcare, software, and select consumer stocks. This divergence suggests that money is rotating within the stock market rather than simply fleeing to safety.
Every now and then, I take a step back and cannot help but see an AI trade that has been topping out for months. From semiconductors and optical networking to equipment makers and mega-cap technology companies, October has been particularly brutal. For some stocks, the topping process dates back to May, and for others, June or July. Disappointing market reactions to earnings from companies like Meta (META) and Lam Research (LRCX) have only reinforced the deterioration. There has been plenty of discussion about whether AI is in a bubble and when that bubble might burst. However, the definition of an AI bubble is a little squishy, and a bubble does not have to burst for a trade to end. The topping process does not have to turn into a calamity. For now, I increasingly see the AI trade as a trade and not an investment. I need to see renewed and sustained buying interest before treating these stocks as longer-term investments again.
Meanwhile, there are plenty of opportunities elsewhere. Financial stocks have performed relatively well. Moreover, apparently, the market is not particularly worried about consumer spending. Last week’s fall in Treasury yields may also be supporting the renewed interest in consumer-facing stocks. However, the bond market introduces another complication. If yields are falling in anticipation of slowing growth, perhaps from capacity constraints or a pullback in AI infrastructure investment, the economic outlook could become less encouraging. After all, the AI buildout has provided a significant boost to GDP growth. Rising oil prices add another conflicting signal about the economic outlook.
All this makes for a confusing market. From one day to the next, I find myself wondering what narrative is driving individual stocks. Yes, money is rotating. Yet that rotation narrative can distract from the larger development: after the dust settles, the AI trade is still topping out. At best, many of those stocks are going nowhere.
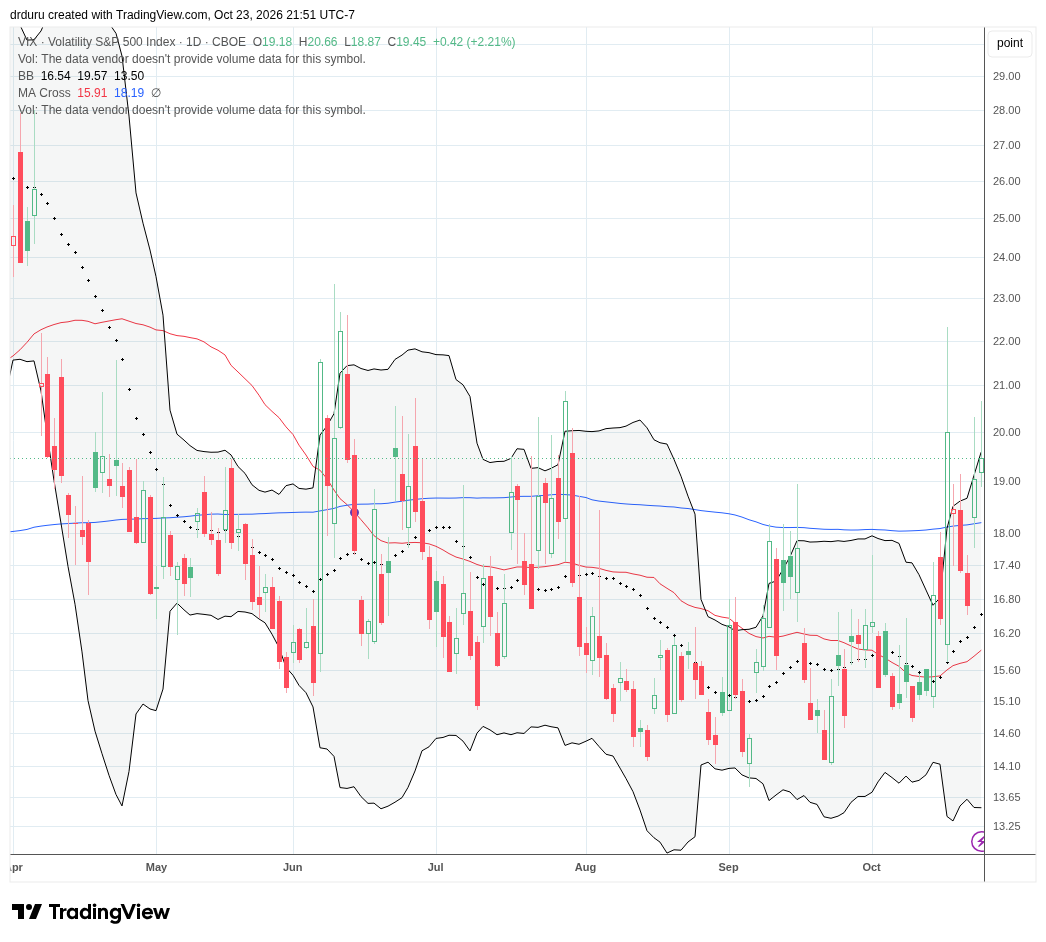
The volatility index (VIX) adds an important caution to this emerging picture. While market breadth improves, the VIX remains elevated and looks like a spring loading for another spike. Moreover, both my short-term and long-term market breadth indicators, AT50 and AT200 respectively, face important resistance levels even as their rebounds support bullish undertones for a market weighed down by a topping AI trade. If money stops rotating out of AI and into other sectors, the entire market could sell off together. The critical question is whether this emerging strength outside AI can sustain the broader market while its former leaders continue to deteriorate. Next up as a potentially significant catalyst is the coming week’s Federal Reserve decision on monetary policy.
S&P 500 (SPY)
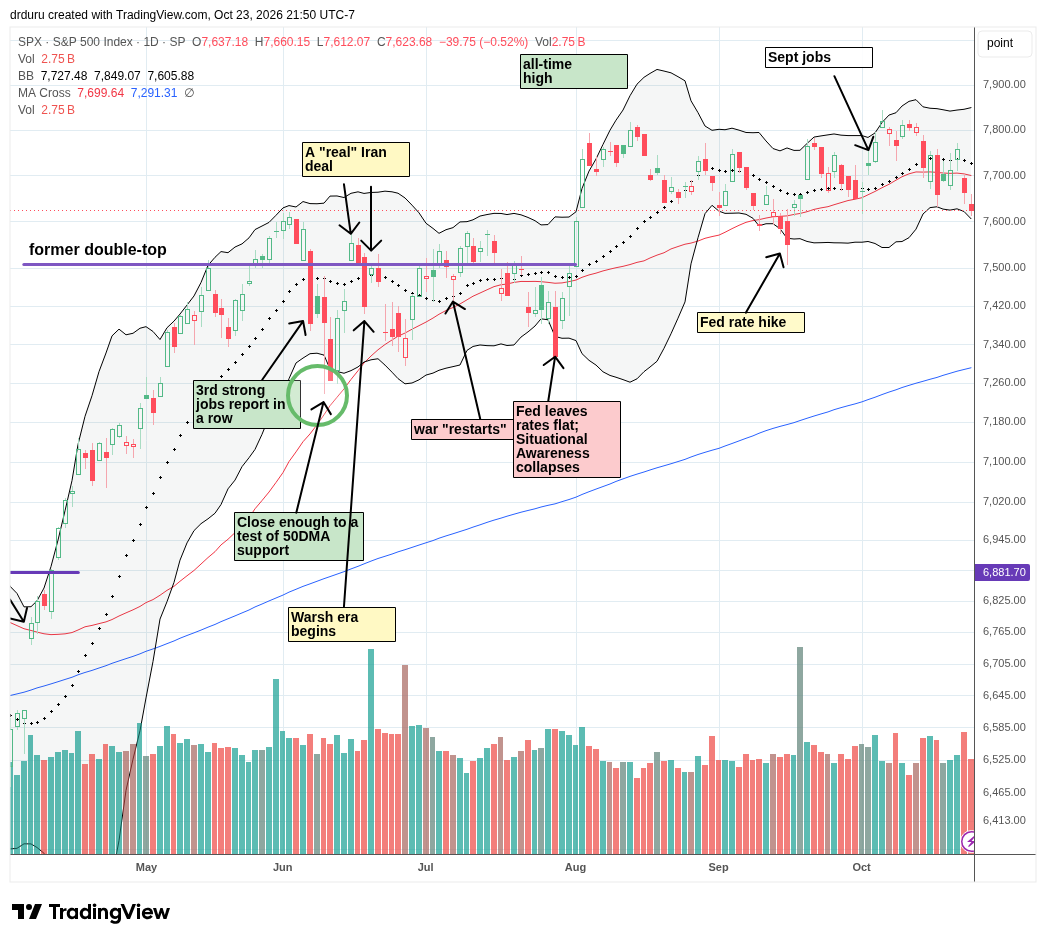
The S&P 500 (SPY) fell 0.5% on Friday and confirmed its second 50DMA (red line) breakdown in two weeks. The index has essentially gone nowhere since a sprint higher in early August. The stop and start nature of trading in the index reflects the growing hesitancy I see in the AI trade. This hesitancy has produced multiple rounds of rotation where money moves from AI to non-AI and non-tech, rinse and repeat. After the dust settles, the AI trade loses a little more steam while the stocks that are now supporting market breadth are leaving the AI trade behind.
NASDAQ (COMPQ)
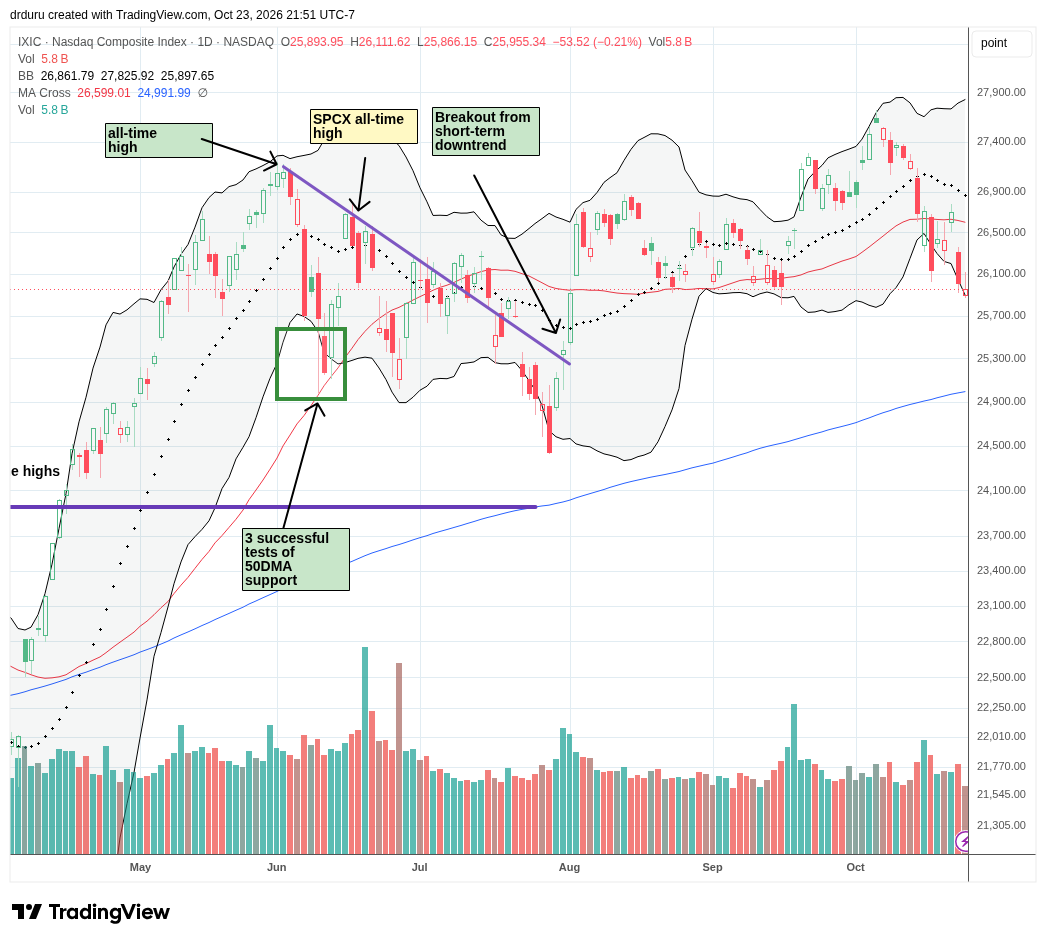
The NASDAQ set an all-time high in early October and has not been the same since. In less than two weeks, the tech-laden index cracked 50DMA support, and in another week the NASDAQ confirmed a 50DMA breakdown. Now at the lows that held as support in August and September, the NASDAQ is at risk of sliding into a test of 200DMA support (blue line).
iShares Russell 2000 ETF (IWM)
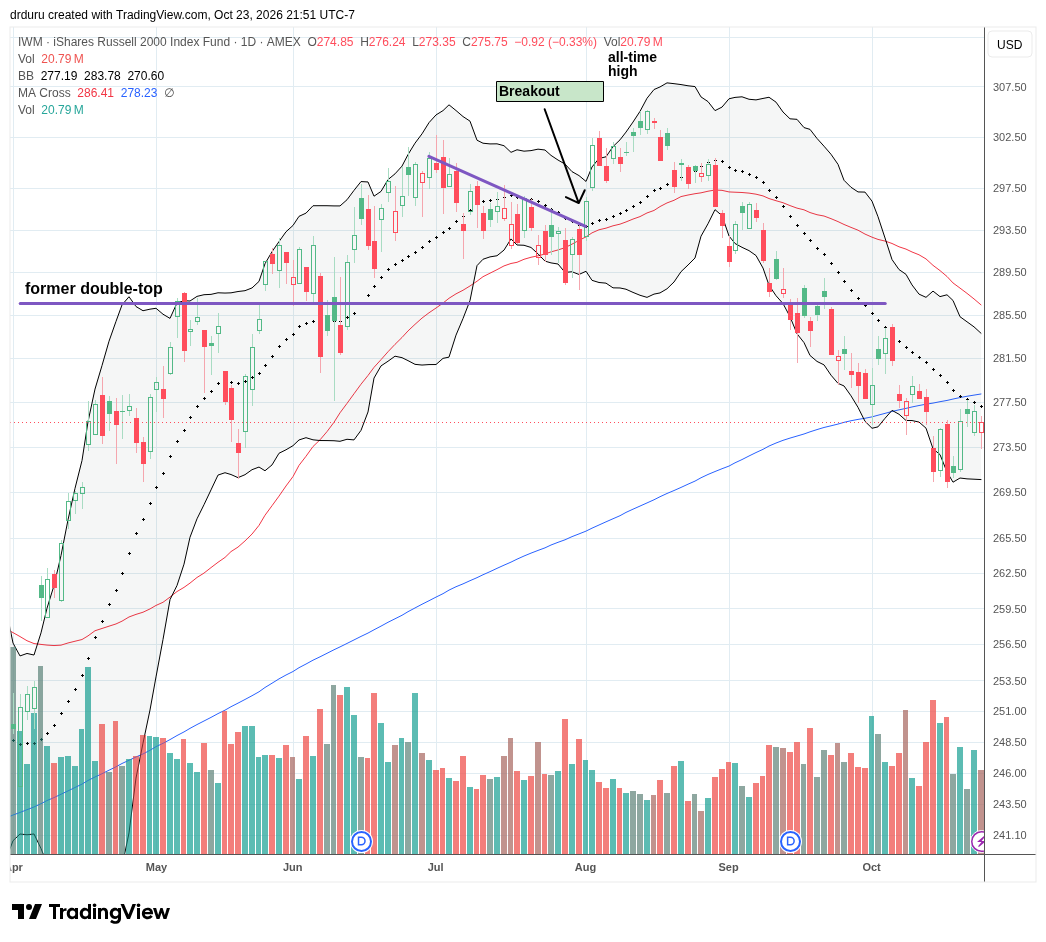
The iShares Russell 2000 ETF (IWM) remains in full bearish position. Last week, converged resistance from the 20DMA (dashed line) and 200DMA held firm. I am very surprised at the strength in market breadth given small caps stalled out in parallel. No trades for me on IWM until it overcomes 200DMA resistance.
The Short-Term Trading Call With AI Left Behind
- AT50 (MMFI) = 38.2% of stocks are trading above their respective 50-day moving averages
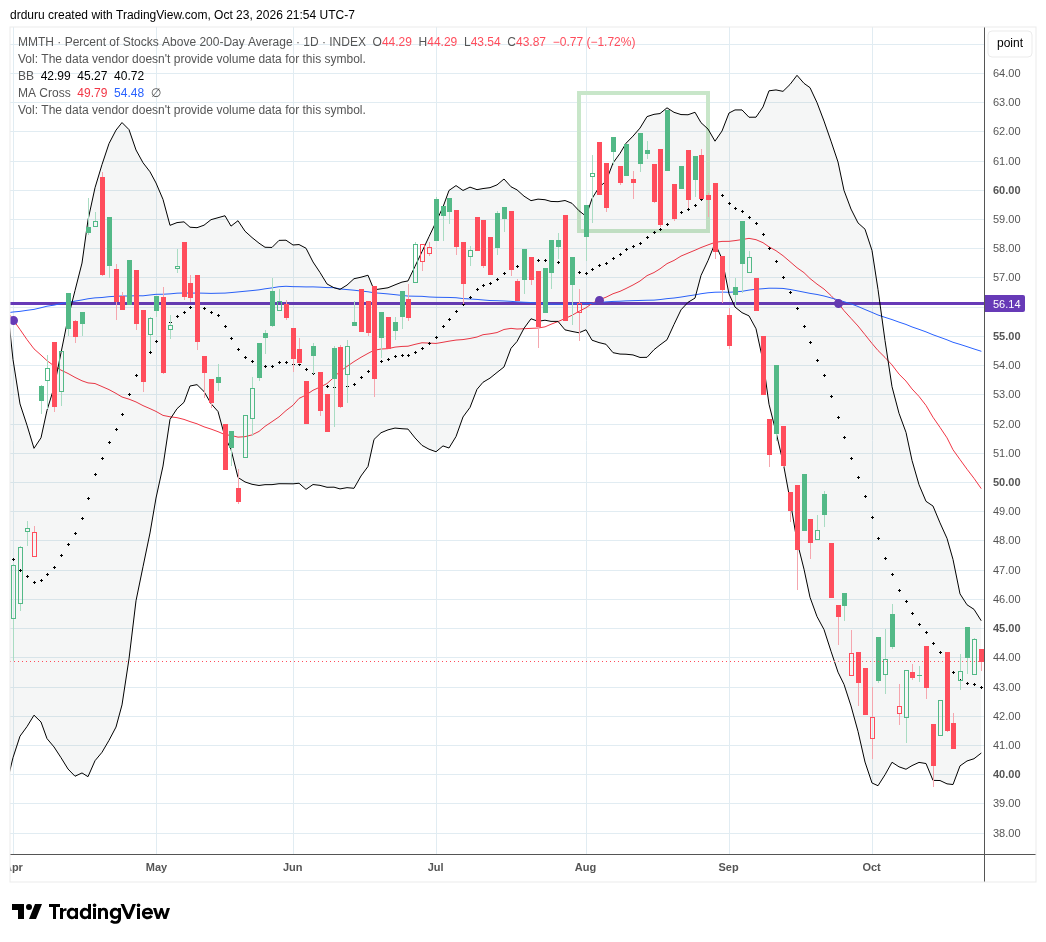
- AT200 (MMTH) = 43.9% of stocks are trading above their respective 200-day moving averages
- Short-term Trading Call: neutral
AT50 (MMFI), the percentage of stocks trading above their respective 50DMAs, closed the week at 38.2%. My favorite technical indicator surged 10 percentage points for the week but stalled right at its secondary downtrend (the red line). This impressive move is all the more significant given the breakdown in the S&P 500 and the NASDAQ alongside tepid trading in IWM. The underlying strength in the stock market driving market breadth is coming from a motley collection of other sectors like financials and healthcare. In October, these sectors left behind the AI trade and underlined the topping action in that sector.
AT200, the percentage of stocks trading above their respective 200DMAs, made a new low for the year in the previous week. Last week this longer-term indicator of the health of market breadth only rallied to the top of an extending range. With both AT50 and AT200 stalling at important resistance levels, I am not ready to flip the short-term trading call to bullish ahead of a recovery in the breakdowns in the major indices that I follow.
The volatility index (VIX) was itself volatile last week. Its resilience begs caution going into the coming week’s Federal Reserve decision on monetary policy. However, unless the Fed actually hikes its interest rate, I expect an implosion in the VIX after the Fed decision, potentially accompanied by a relief rally for the topping AI trade.
The Equities
Invesco QQQ Trust (QQQ)
Description: Invesco QQQ Trust is an exchange-traded fund that tracks the Nasdaq-100 Index, representing 100 of the largest nonfinancial companies listed on the Nasdaq Stock Market.
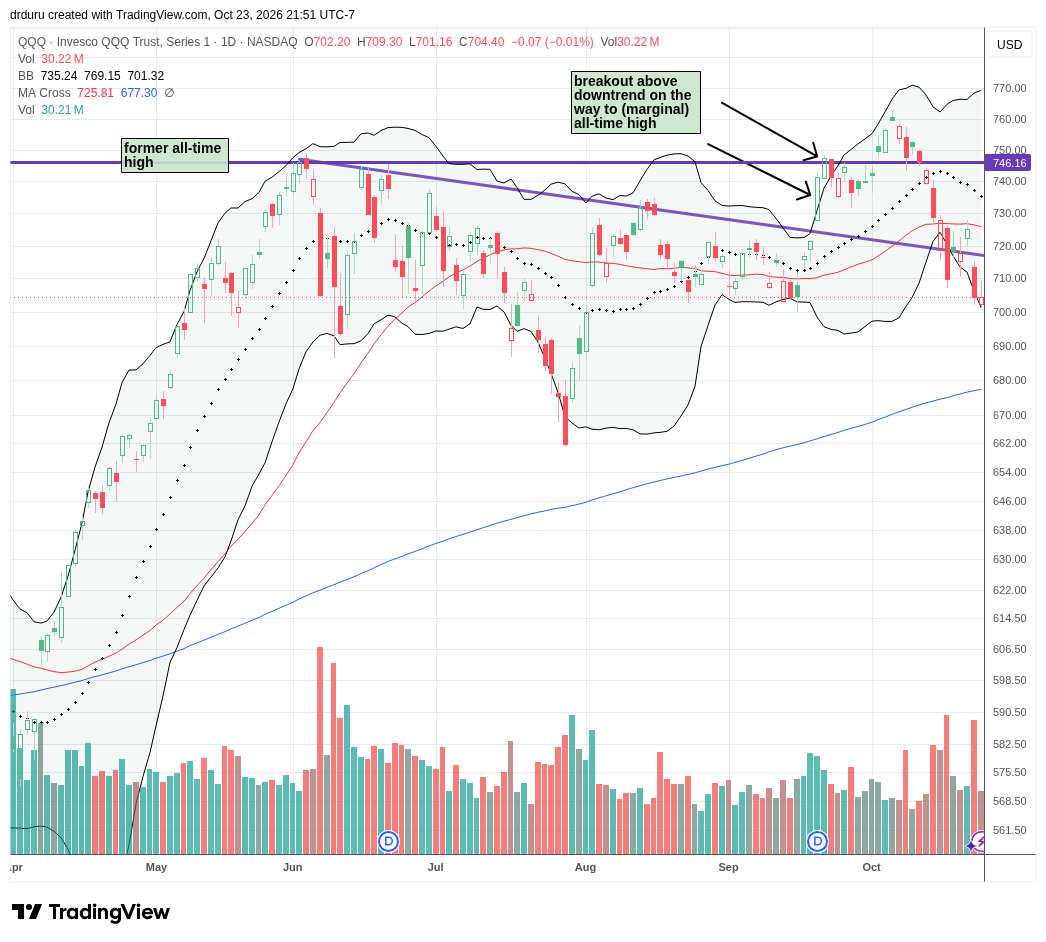
Technical Status: The Invesco QQQ Trust (QQQ) looks like the NASDAQ, but I am using its chart to highlight how precarious the tech trade has become with a return to a prior downtrend.
Trade Commentary: QQQ is a useful benchmark for evaluating the deterioration in mega-cap technology and artificial intelligence leadership. The Nasdaq Composite declined 2.6% on October 22 as disappointing reactions to AI-related earnings and semiconductor selling pressured growth stocks. I was “fooled” the day before into speculating on a 50DMA breakout. If I were bearish, I would have instead speculated on put options. Instead, I created an image in my mind of missing out on a strong rebound when I should have waited for the actual breakout.
VanEck Semiconductor ETF (SMH)
Description: VanEck Semiconductor ETF is an exchange-traded fund that tracks an index of companies involved in semiconductor production and related equipment and services.
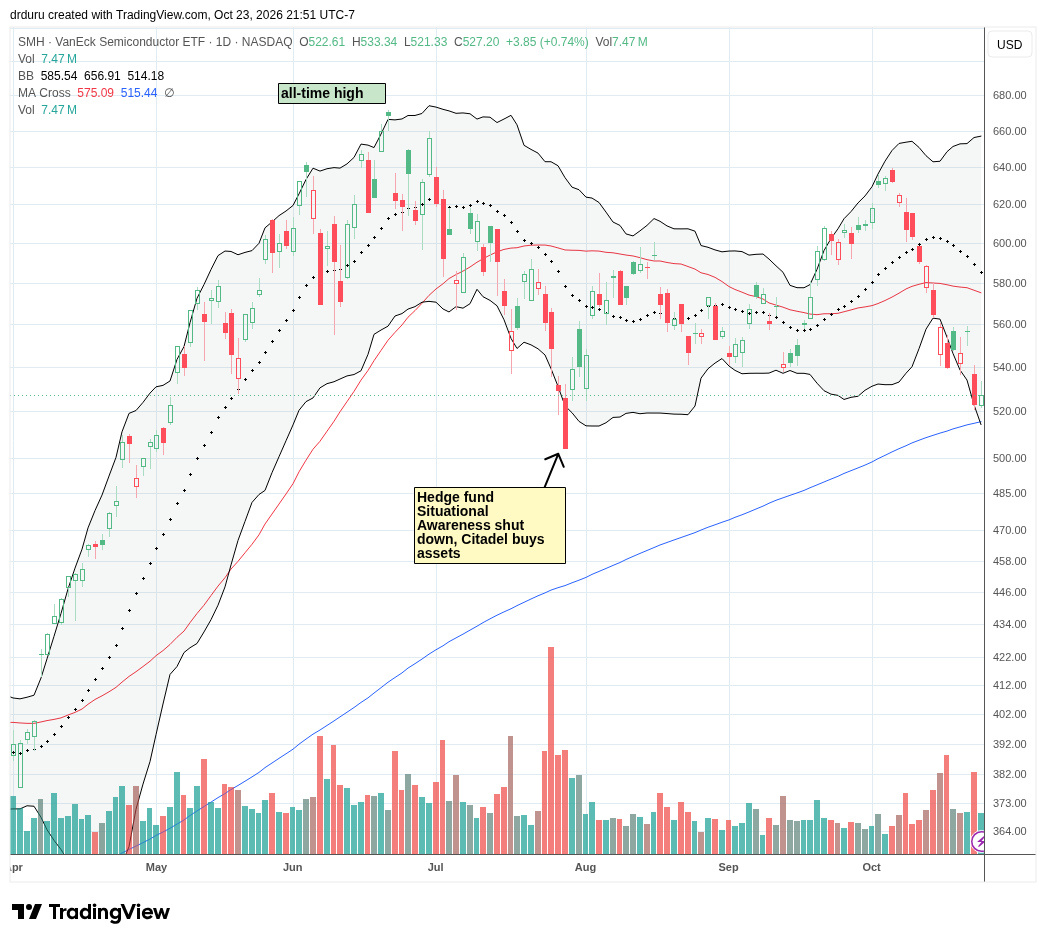
Technical Status: VanEck Semiconductor ETF (SMH) looks ready to test 200DMA support this week given the near non-stop selling in October.
Trade Commentary: Semiconductor leadership continued to deteriorate despite an early-week rebound in chip stocks. The Philadelphia Semiconductor Index advanced on October 19 but plunged 6.7% on October 22, leaving it more than 26% below its June 22 closing high. SMH provides a concentrated measure of this weakness, with Nvidia (NVDA) accounting for approximately 20% of the fund’s October 21 holdings. The market is increasingly distinguishing between continued AI infrastructure investment and the prices investors are willing to pay for companies exposed to that spending. Semiconductor weakness is central to the topping AI trade. SMH hit an all-time high in June. Still, I am ready to chase a rebound off 200DMA support.
Meta Platforms (META)
Description: Meta Platforms operates social media, messaging, advertising, and digital technology businesses through Facebook, Instagram, WhatsApp, and other products.
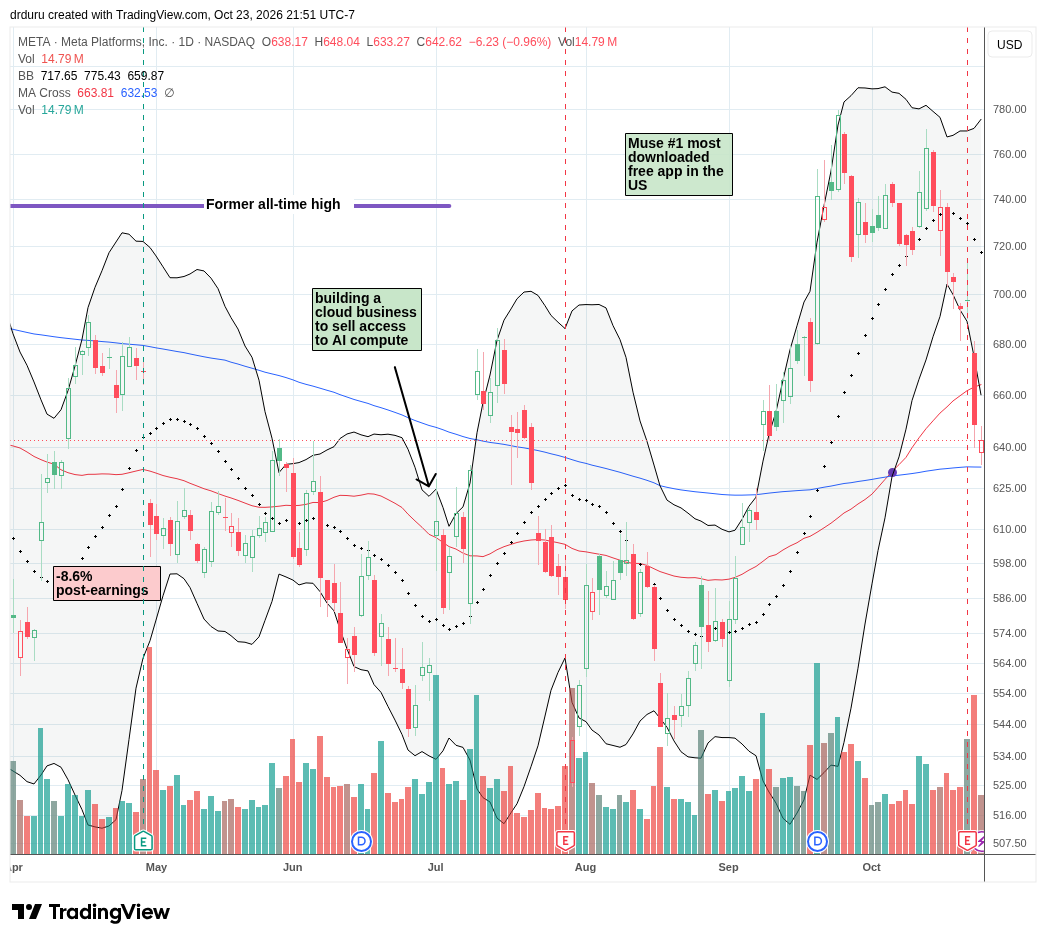
Technical Status: Meta Platforms (META) finished reversing its surge on Muse download news. A 7.0% post-earnings loss brought META close to a test of 200DMA support.
Trade Commentary: I called the reversal for META, but I could not bring myself to make the trade. I assumed the fade would unfold over months, not weeks. The post-earnings loss and near test of 200DMA support quickly dampened the Muse-infused mood. On September 21, META soared 11.3% as enthusiasm for Muse accelerated. At the time, I expressed considerable skepticism because I thought the excitement had moved well ahead of reality. Muse became the number one most-downloaded free app in the United States, but META also spent heavily on marketing to get the application in front of users. If you use Facebook or Instagram, you know enticements to engage with Muse are everywhere. With competition coming, I fully expect a fickle consumer to leave Muse behind for the next shiny toy.
META’s plunge last week, including a 50DMA breakdown, symbolizes how market breadth left behind a topping AI trade. Still, the stock is now poised for a relief rally. If so, I will be better prepared to fade the stock from confirmed resistance either at the 50DMA or the now downtrending 20DMA.
Lam Research (LRCX)
Description: Lam Research supplies semiconductor manufacturing equipment and services used in wafer fabrication, including etch, deposition, and cleaning processes.
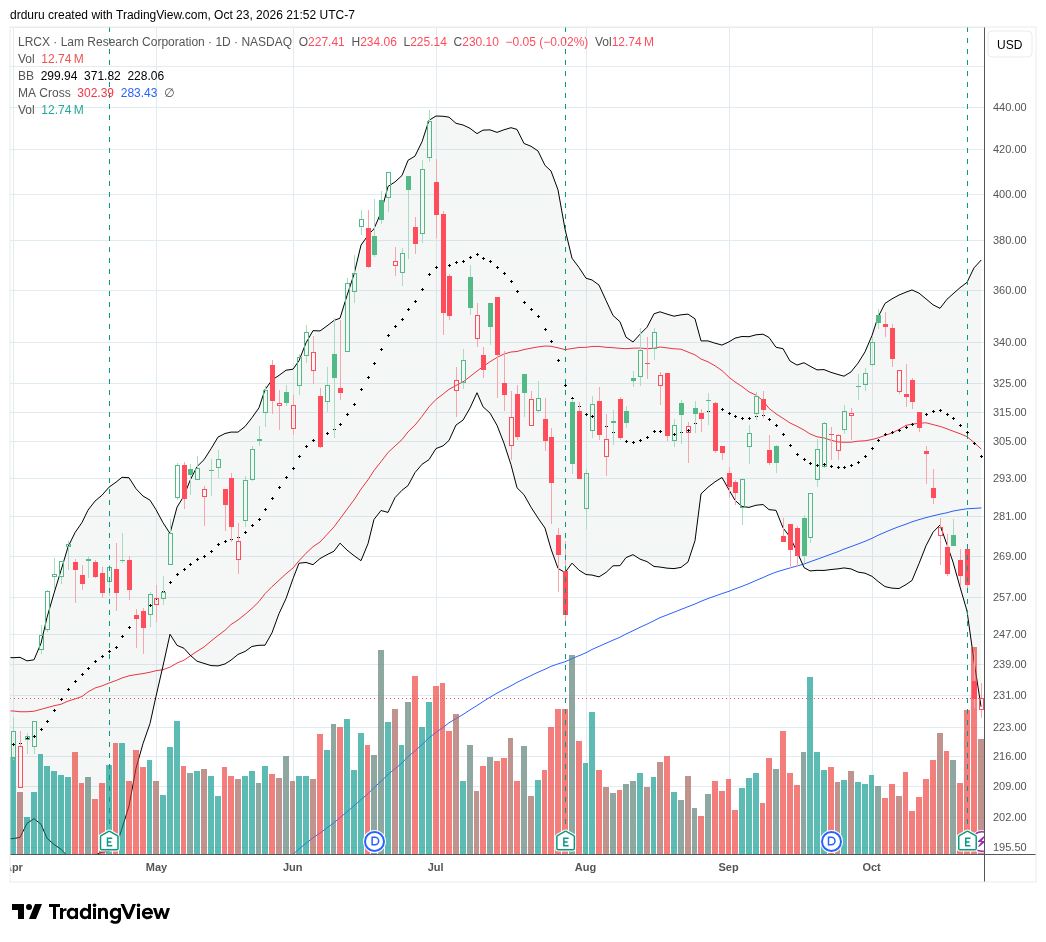
Technical Status: Lam Research (LRCX) lost 11.8% post-earnings and traded to a 6+ month low.
Trade Commentary: LRCX delivered another indicator of the topping AI trade. Including the post-earnings plunge, LRCX has lost 30.0% in October and is even down 47.1% from its all-time high. In its earnings report, the company reported supply constraints and lower than expected guidance for the current quarter. However, analysts are sticking by the stock, so I anticipate a relief rally once the overall sector lifts from current trough levels. A close above the post-earnings intraday high of $242.10 would motivate me to speculate on a continued rebound to reverse the post-earnings gap down.
NVIDIA (NVDA)
Description: NVIDIA designs graphics processors, accelerated computing systems, networking products, and software used in artificial intelligence, data centers, gaming, and other computing applications.
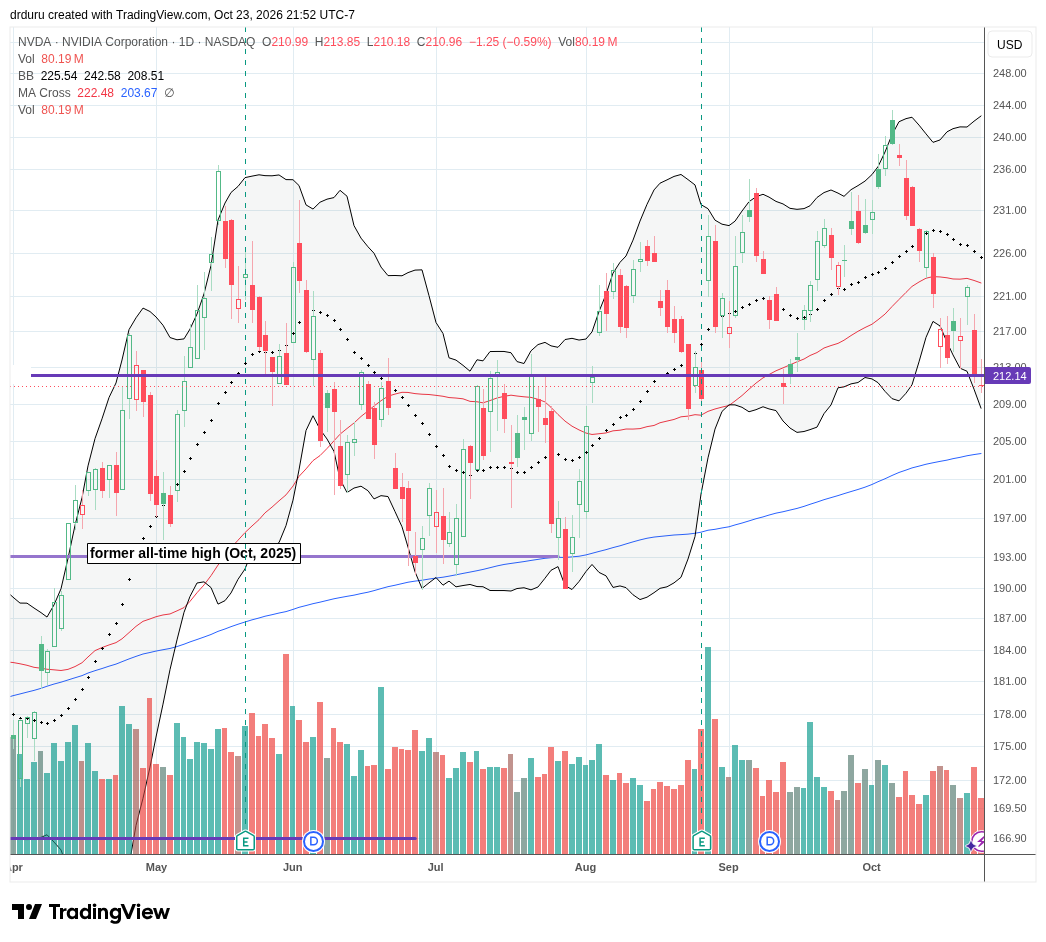
Technical Status: NVIDIA (NVDA) confirmed 50DMA resistance and slipped below former support from its intraday all-time high a year ago.
Trade Commentary: I cannot make the case that the AI trade is topping without looking at NVDA. NVDA is almost the last major hope for the AI trade. When I step back and look at the stock over the past year or so, the pattern is not particularly encouraging. NVDA churns, pops higher, falls back, and then churns again. The stock has struggled to sustain a consistent uptrend while trading in two long trading ranges over the last 18 months or so. I initially thought the latest breakout would help support another move higher in the NASDAQ. Instead, NVDA reversed sharply. Now, NVDA needs to hold support at its 200DMA support.
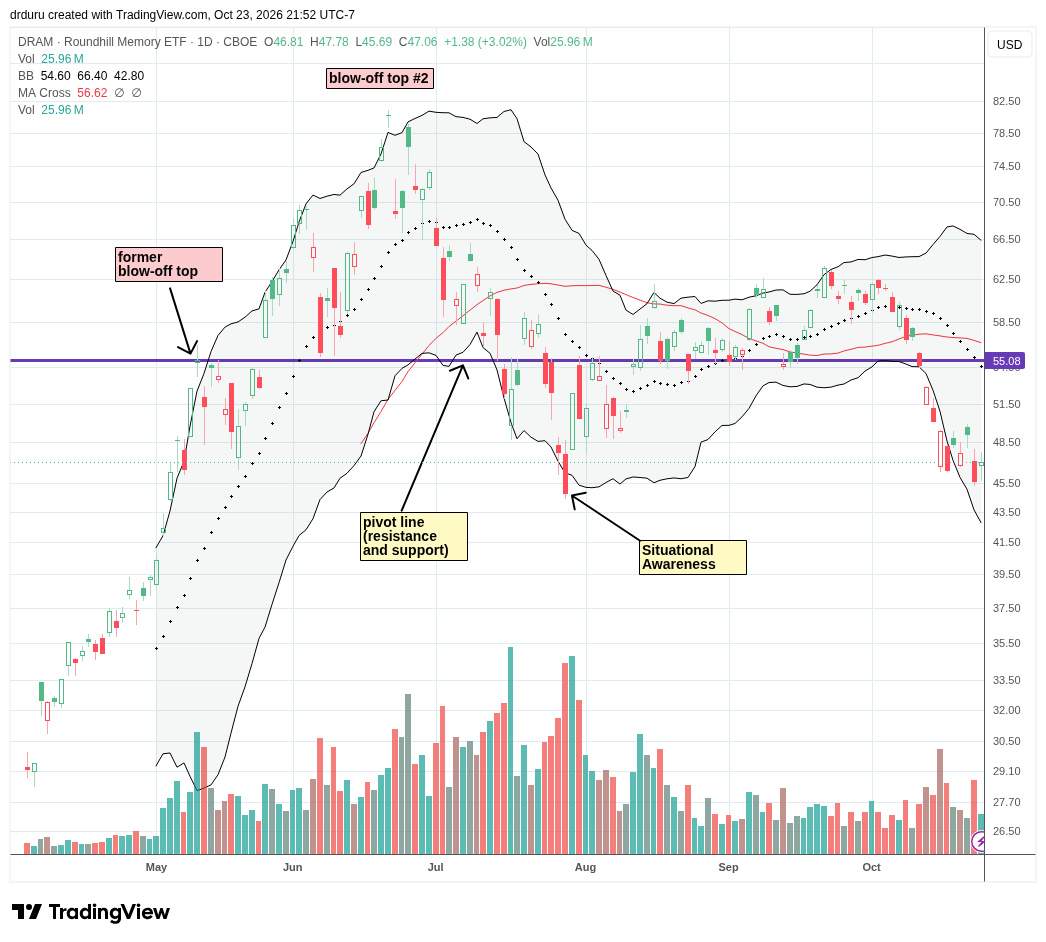
Roundhill Memory ETF (DRAM)
Description: Roundhill Memory ETF is an actively managed exchange-traded fund providing exposure to companies involved in memory semiconductors and storage technologies.
Technical Status: The Roundhill Memory ETF (DRAM) is in a situation critical trading just above its Situational Awareness low in July.
Trade Commentary: DRAM offers a more concentrated perspective on the memory portion of the AI infrastructure investment cycle. Memory stocks participated in the early-week semiconductor recovery before the group’s Thursday reversal, when Micron (MU) shares declined 6.3%. The contrast between memory demand and weakening investor appetite for semiconductor equities is important. DRAM helps determine whether selling pressure is restricted to AI accelerator companies or extending across the infrastructure supply chain. For now, October’s sell-off means market breadth has left behind a topping AI trade.
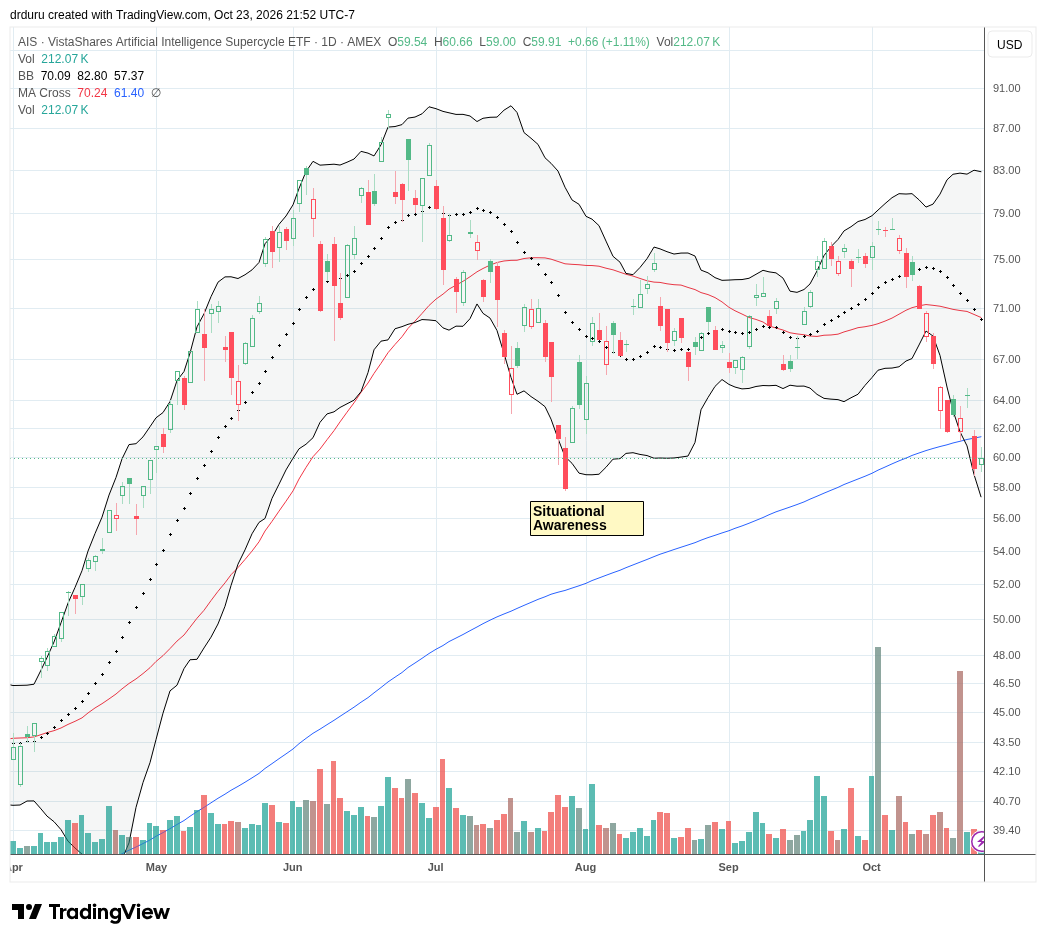
VistaShares Artificial Intelligence Supercycle ETF (AIS)
Description: VistaShares Artificial Intelligence Supercycle ETF is an actively managed exchange-traded fund investing in companies across the global artificial intelligence infrastructure and applications supply chain.
Technical Status: The VistaShares Artificial Intelligence Supercycle ETF (AIS) confirmed 200DMA support with a 2.6% bounce only to turn around and suffer a steep 200DMA breakdown.
Trade Commentary: I have adopted AIS as my primary ETF for monitoring the AI trade. I finally bought shares after AIS seemed to confirm 200DMA support. Instead, AIS cratered 8% and moved well below 200DMA support. This breakdown is bearish, but I am hanging in there until/unless the Situational Awareness low gives way.
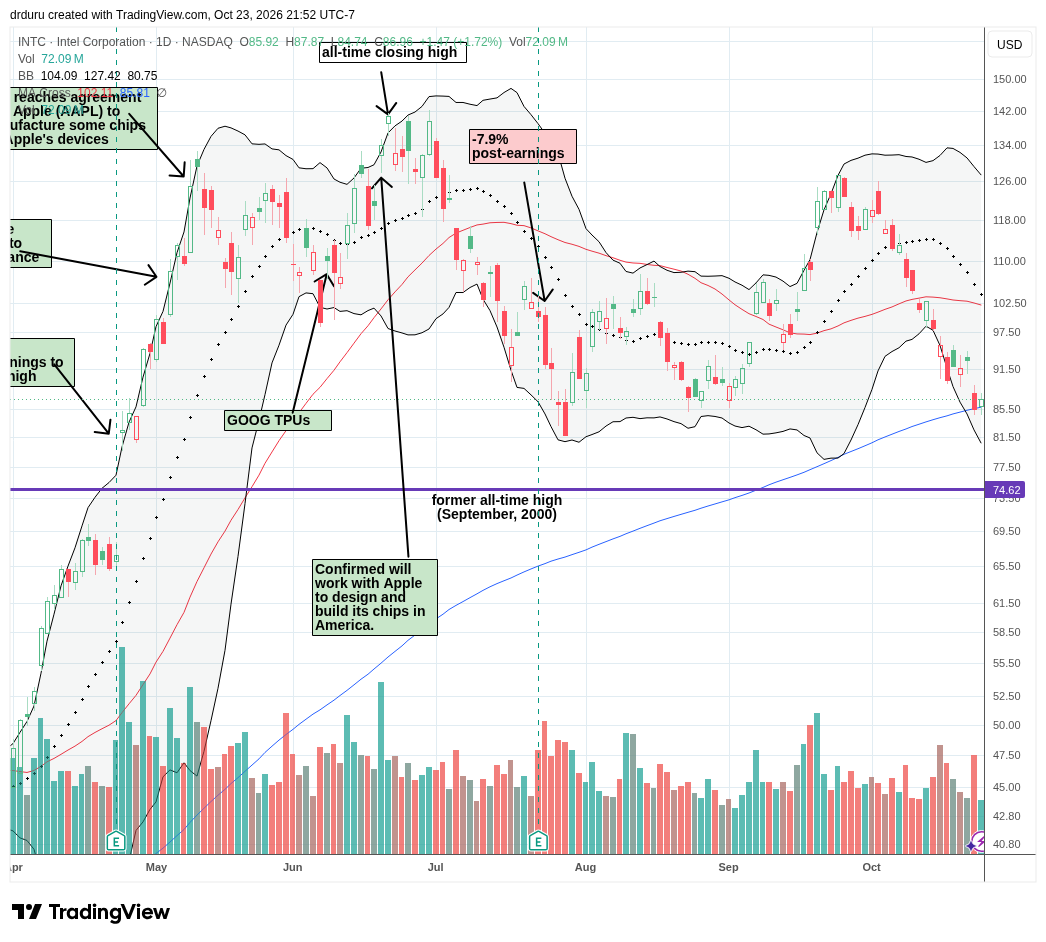
Intel Corporation (INTC)
Description: Intel designs and manufactures semiconductor products, including processors and related computing technologies, and provides contract chip manufacturing services.
Technical Status: Intel Corporation (INTC) ended the week precariously balancing on 200DMA support aligned with the August lows.
Trade Commentary: Intel shares gained 2.4% to start the week after J.P. Morgan upgraded the stock to neutral, contributing to the early-week semiconductor recovery. That improvement proved temporary as INTC subsequently participated in Thursday’s sector-wide selloff, declining 8.0%. The reversal underscores how quickly company-specific optimism can be overwhelmed when investors retreat from semiconductor exposure. Intel reports earnings on October 29, so I will keep a short leash on any trade playing a rebound off 200DMA support.
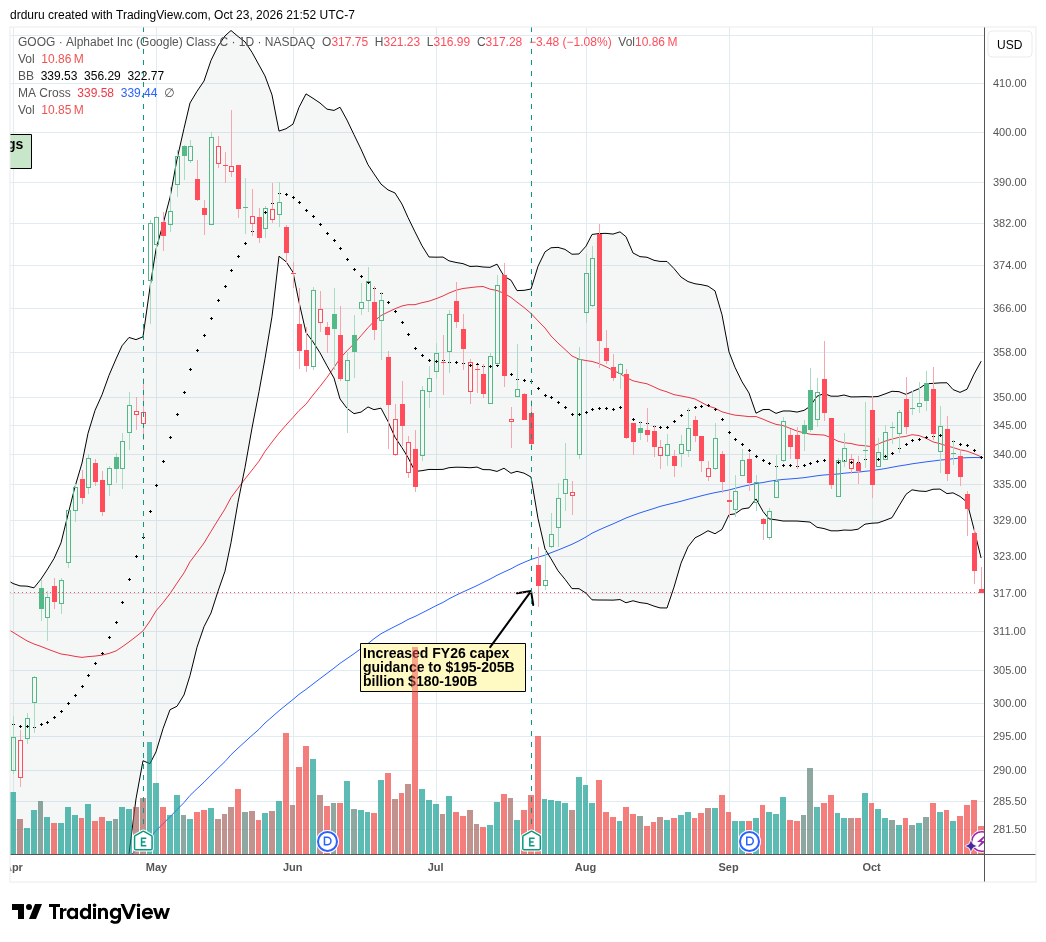
Alphabet (GOOG)
Description: Alphabet is the parent company of Google and operates internet advertising, search, cloud computing, video, software, and other technology businesses.
Technical Status: Alphabet (GOOG) fell 5.9% for the week, confirmed a 200DMA breakdown, and closed at a 6+ month low.
Trade Commentary: I am really worried about my position in GOOG. Last week, the stock broke down below its 200DMA and went straight down on its way to closing at a 6+ low. At the same time the stock roundtripped past the lows from its July 6.9% post-earnings loss. The stock felt the pressure cascading throughout AI trades. Accordingly, GOOG looks like it topped out in May, and I now consider it a trade instead of an investment. However, I hope to make GOOG the last sale in my AI trades.
Palantir Technologies (PLTR)
Description: Palantir Technologies develops data integration, analytics, and artificial intelligence software platforms for government and commercial customers.
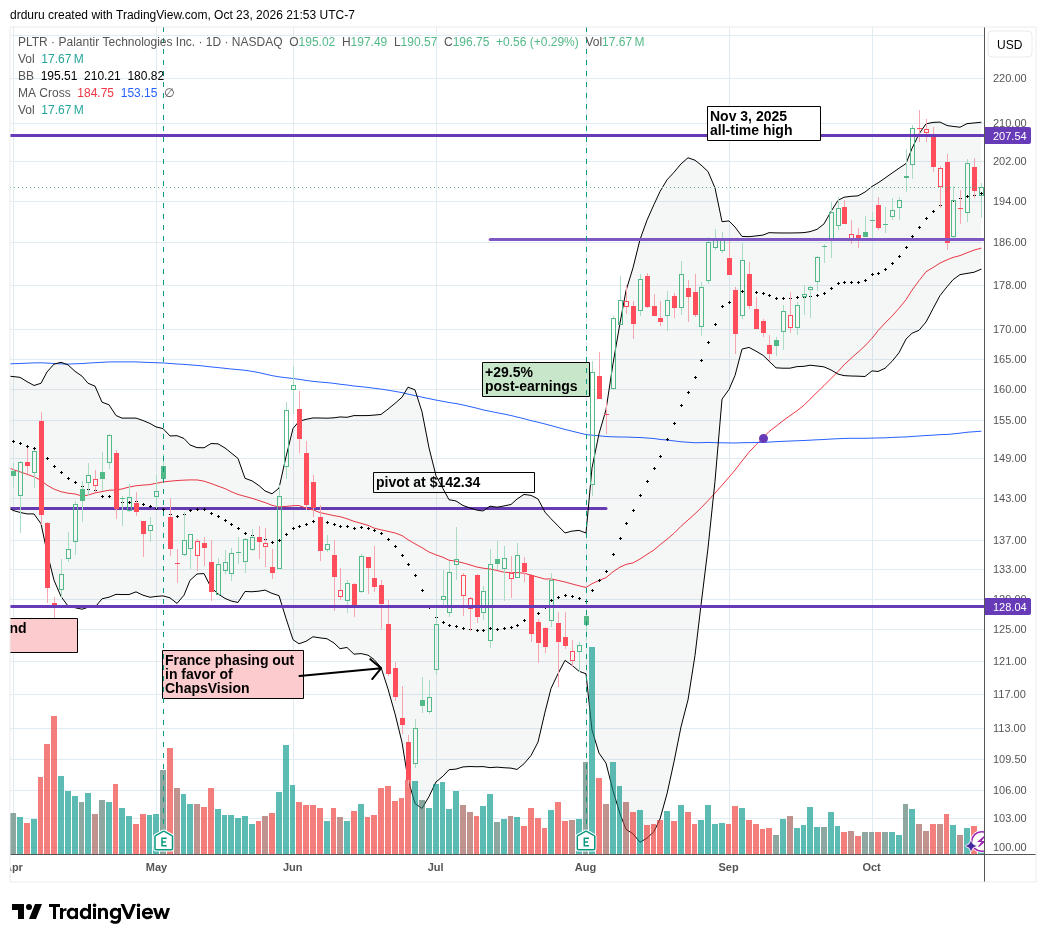
Technical Status: Palantir Technologies (PLTR) started the week bouncing perfectly off support from the August high, but the stock failed to mount a second challenge to its all-time high.
Trade Commentary: PLTR sits somewhere between a software trade and an AI trade. PLTR produced a beautiful bounce from a support line established by a previous all-time high from November, 2025. Yet, once again, I missed a well-structured setup to buy. Support should be even stronger with a converging 50DMA. I hope to be on alert for a buy at that time. PLTR’s elevated valuation will always make it hard for me to hold the stock, but I like the periodic trading opportunities created by the technicals.
In the meantime, Palantir announced an expansion of sovereign AI deployments on October 21, identifying customers and partners including L3Harris, NVIDIA, Ondas, and Tampa General Hospital. The stock gained 4.7% in the wake of the news, demonstrating that certain AI software companies could still attract buyers during a bearish period for the broader technology sector.
Tesla (TSLA)
Description: Tesla manufactures electric vehicles, energy storage systems, and related technology while developing autonomous driving and robotics capabilities.
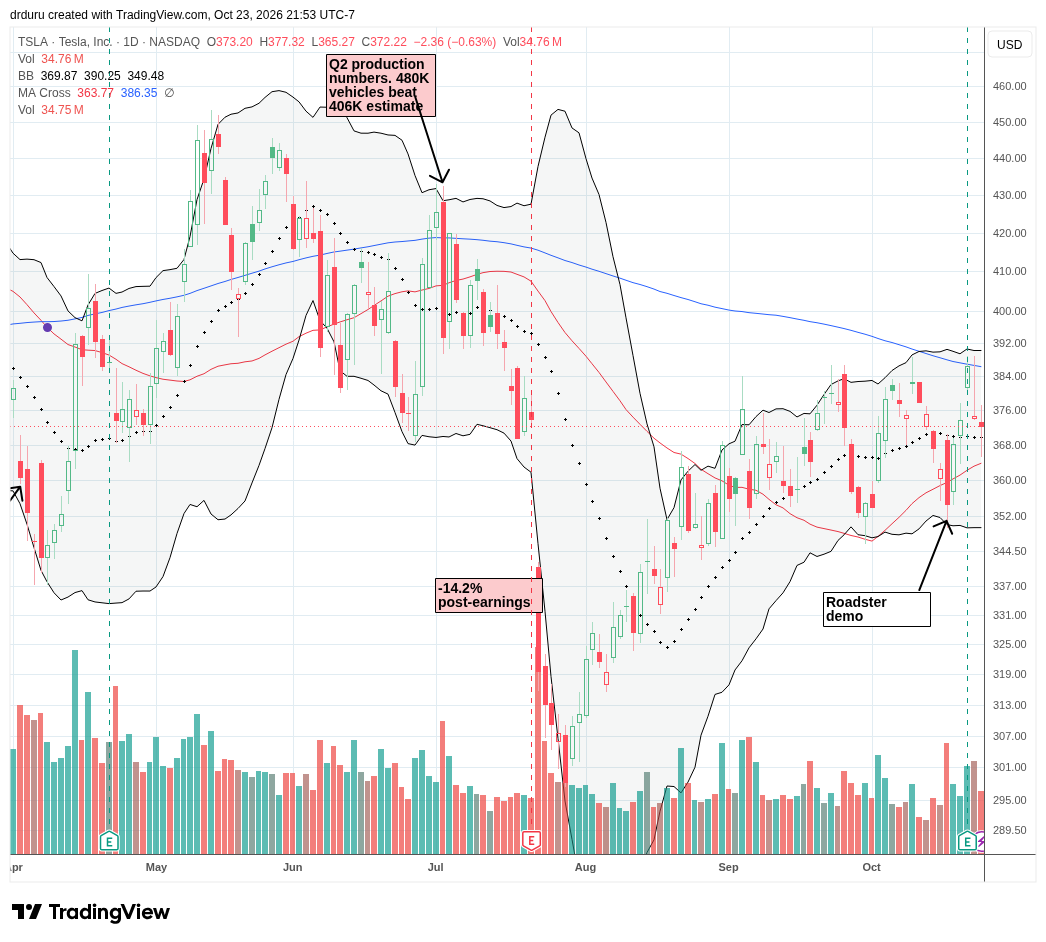
Technical Status: Tesla (TSLA) bounced from 50DMA support to 200DMA resistance, but a 3.1% post-earnings loss confirmed resistance. Buyers redefended 50DMA support on Friday’s intraday low.
Trade Commentary: With every passing week, TSLA becomes a less interesting stock to trade. I believe a SpaceX acquisition is a serious possibility, but that remains speculation, not an announced transaction. Without evidence of a deal or a compelling reason for a takeover premium, I expect TSLA to remain a range-bound trading stock.
TSLA’s post-earnings drop confirmed 200DMA resistance, and the stock remains trapped in a tight range between its 200DMA and 50DMA.
Tesla reported positive free cash flow and reducing its 2026 capital spending plans. Out of all the financial and business achievements the company reported, it seemed investors got spooked by the pullback in capital spending as representing a forecast on lower future demand to justify the spending. The timing of such an interpretation aligned with the pullback in tech led by AI-related stocks.
Financial Select Sector SPDR Fund (XLF)
Description: Financial Select Sector SPDR Fund is an exchange-traded fund representing financial companies in the S&P 500 Index, including banks, insurance companies, and capital markets businesses.
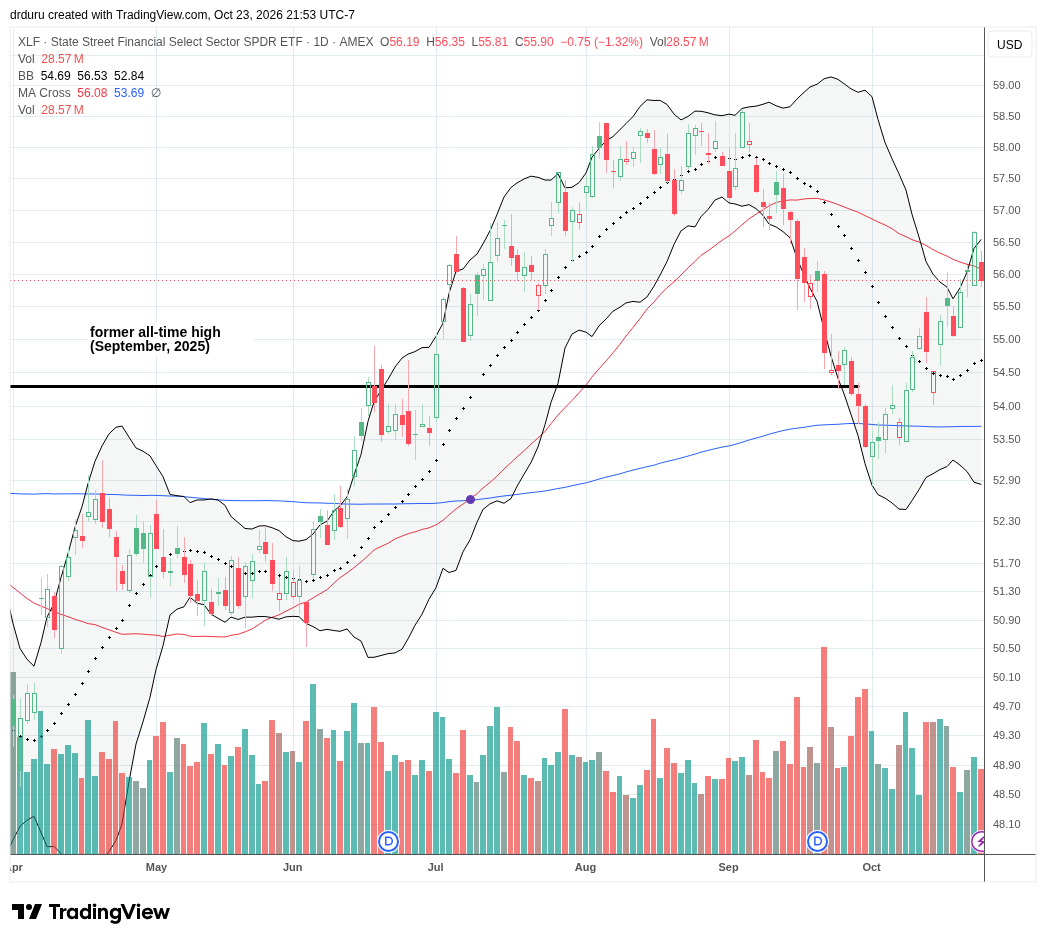
Technical Status: The Financial Select Sector SPDR Fund (XLF) ended the week losing its 50DMA breakout even as the October uptrend remained intact.
Trade Commentary: While tech has sold off in October, financials have rallied. XLF is even enjoying an uptrend for the month. I plan to get back into call options if the buying momentum continues from here and recovers the 50DMA breakout. Financials have left behind the topping AI trade even as XLF still has some room before returning to its all-time high.
Health Care Select Sector SPDR Fund (XLV)
Description: Health Care Select Sector SPDR Fund is an exchange-traded fund representing healthcare companies in the S&P 500 Index, including pharmaceuticals, biotechnology, medical devices, and healthcare services.
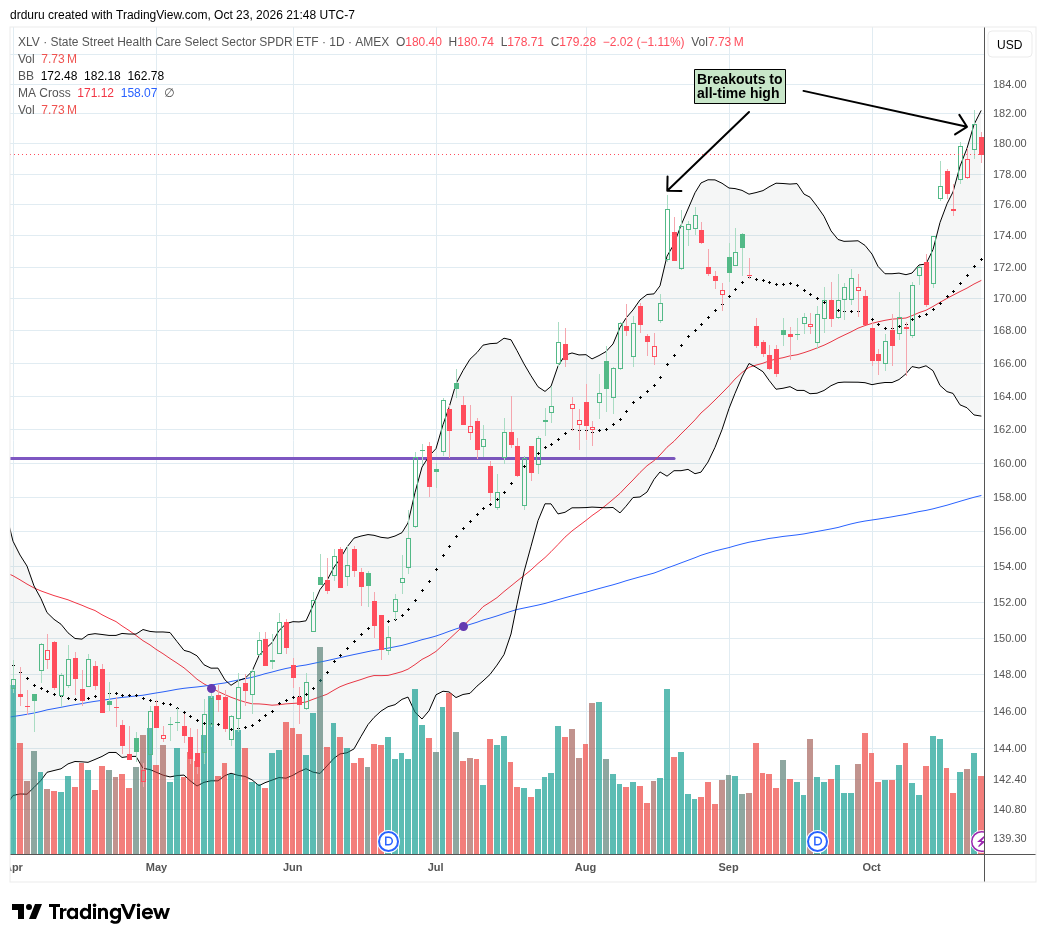
Technical Status: The Health Care Select Sector SPDR Fund (XLV) continued momentum from the previous week’s gap higher to break out to new all-time highs.
Trade Commentary: Healthcare is another place where money has been moving and leaving behind the topping AI trade. I am long XLV, and I am staying long. The investment thesis is simple: aging demographics support increasing needs for healthcare. XLV is also a buy on the dips from this latest breakout.
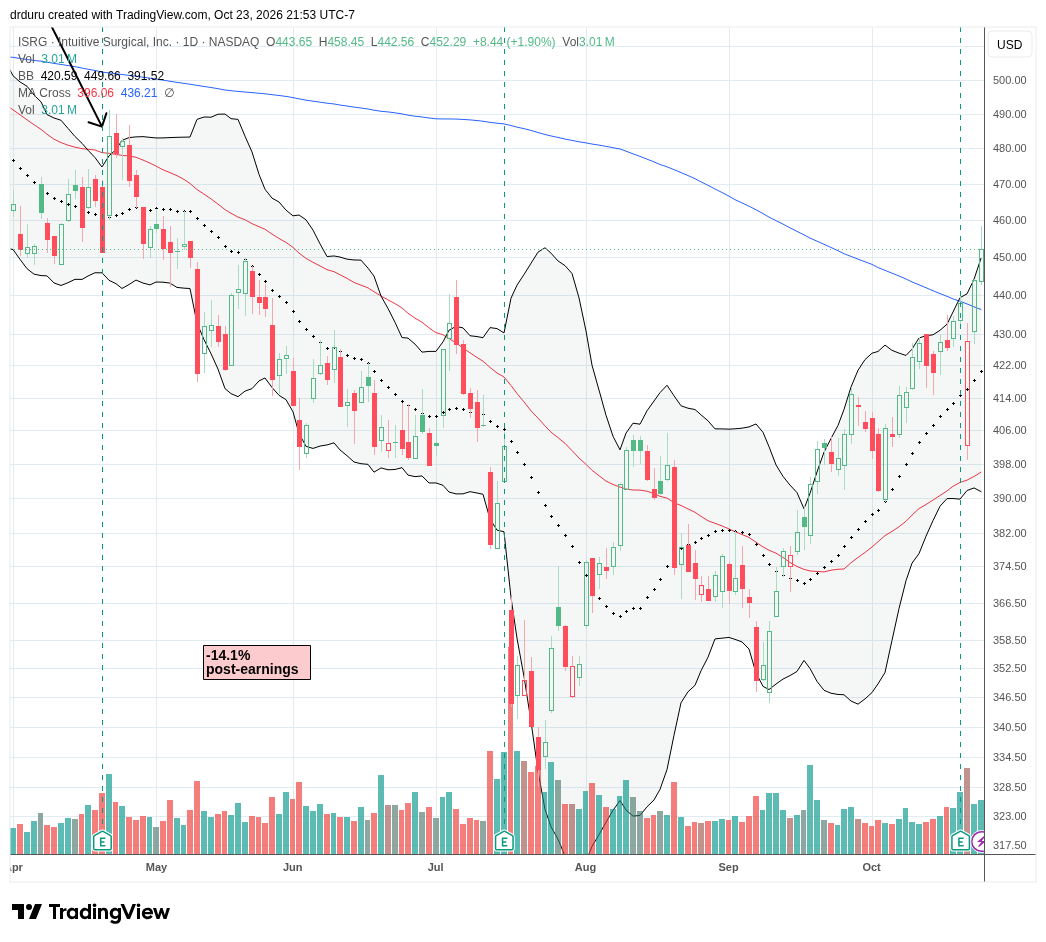
Intuitive Surgical (ISRG)
Description: Intuitive Surgical develops and manufactures robotic-assisted surgical systems, instruments, and related technology for minimally invasive medical procedures.
Technical Status: After recovering from an 8.1% post-earnings gap down, Intuitive Surgical (ISRG) continued to rally into a bullish 200DMA breakout.
Trade Commentary: I thought I was done with ISRG after admitting defeat three months ago. Last week’s confirmed 200DMA breakout brought me right back into the stock. This time, I bought my largest position yet. Despite the double top stretching across 2025 and 2026, the current bullish breakout looks like a good risk/reward trade with a 10-15% gain from here as a first profit target.
Intuitive Surgical reported third-quarter results on October 20, with revenue increasing 22% year over year to $3.05 billion. Worldwide procedures across its da Vinci and Ion platforms grew approximately 15%, while the company placed 546 da Vinci surgical systems compared with 427 a year earlier. Non-GAAP net income increased to approximately $1.05 billion, although GAAP earnings included a substantial litigation settlement charge. The stock dropped in reaction to the company falling short of analyst expectations. I could not identify news to explain the abrupt change in sentiment that supports the current rally.
Spotify Technology (SPOT)
Description: Spotify Technology operates a digital audio streaming platform providing music, podcasts, audiobooks, and related subscription and advertising services.
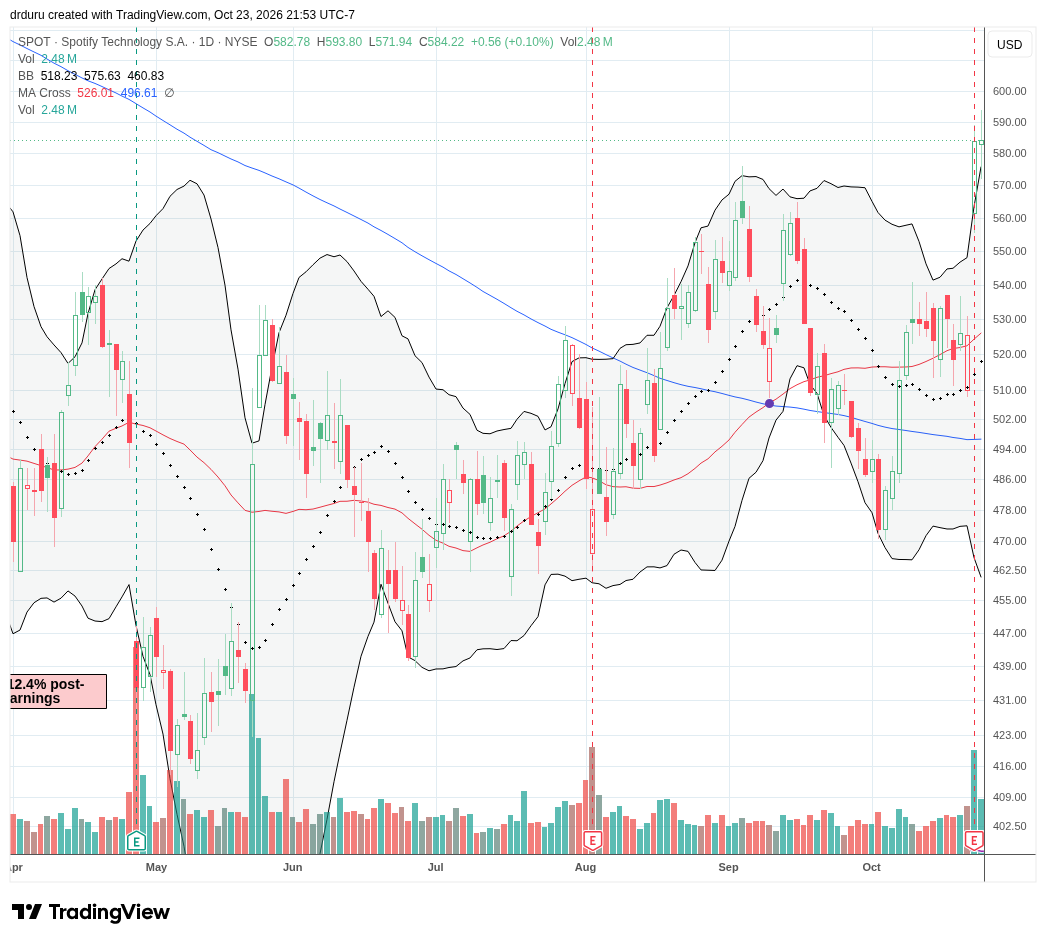
Technical Status: Spotify Technology (SPOT) surged 11.1% post-earnings close to its highest point of the year.
Trade Commentary: SPOT is a consumer-facing stock that finally looks ready to turn the corner as traders search for alternatives to the topping AI trade. This stock had a tremendous run from 2022 into 2025 before stumbling. Now I see a bearish-to-bullish reversal developing. The reversal began with a breakout above the 200DMA in August. That initial breakout failed, but SPOT bounced back. The latest 11% post-earnings gain provides further confirmation that the turnaround is underway, so I put SPOT on my buy list. Since the stock is overextended above its upper Bollinger Band (BB) (the black lines), I will patiently wait for the price action to “cool down” and hopefully pull back to $560 or so to improve the risk/reward ratio.
Spotify projected fourth-quarter operating income of €820 million, exceeding analyst expectations. Management also forecast approximately 10 million additional premium subscribers during the December quarter. Its AI-powered music discovery and personalization features have supported engagement. Third-quarter operating income reached €672 million, broadly matching expectations.
Sea Limited (SE)
Description: Sea Limited operates digital commerce, digital financial services, and online gaming businesses through Shopee, Monee, and Garena.
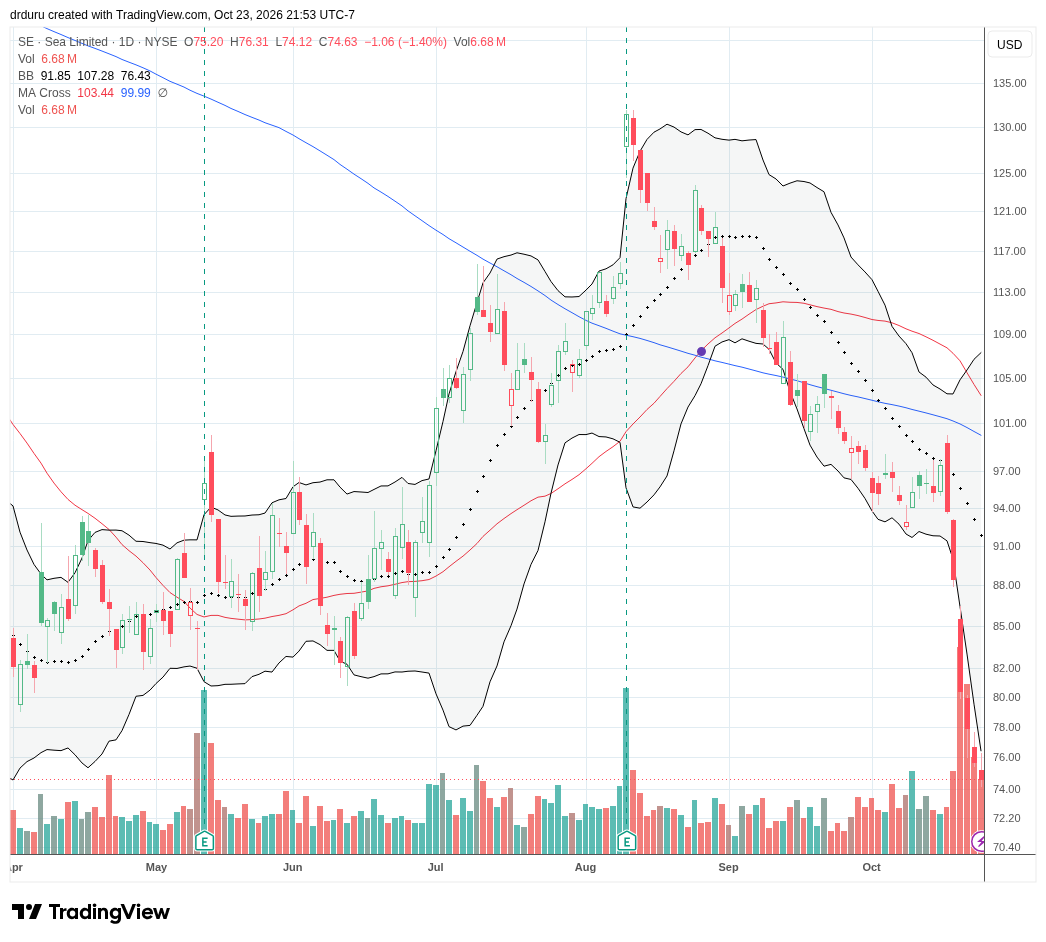
Technical Status: Sea Limited (SE) plunged another 20.4% last week on its way to a 2+ year low.
Trade Commentary: I finally found some news that could at least partially explain the aggressive selling in SE shares. Insiders have been selling the stock. Yet because the quantities pale in comparison to the volumes traded in the public market, the sharp decline in SE seems to be sentiment-driven. Given the extreme nature of the plunge, I am increasingly interested in watching the stock for a trade on a sharp rebound from oversold conditions. The stock closed every day of last week below its lower BB, setting up a sharp bounce whenever sellers finally exhaust themselves and/or buyers show renewed interest.
Freshworks (FRSH)
Description: Freshworks develops cloud-based software for customer service, employee service management, and enterprise technology operations.
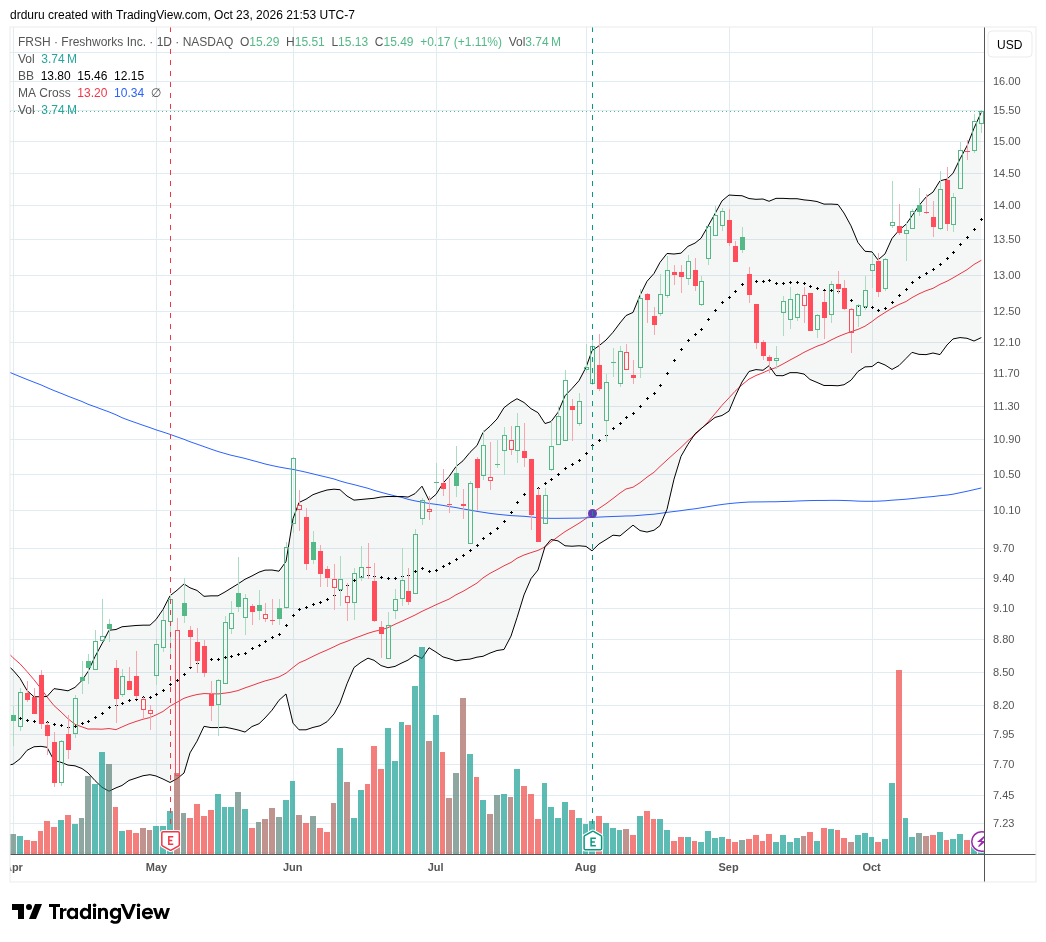
Technical Status: Freshworks (FRSH) continued its strong October with a fresh 16-month high.
Trade Commentary: The trend has been my friend in FRSH, and the stock keeps moving higher. I am still long and sticking with the trend for as long as it lasts. While I doubt FRSH will ever return to its all-time highs around $50/share, I hope the recovery has plenty of room left to run.
Netflix (NFLX)
Description: Netflix operates a global subscription entertainment service providing television, film, games, and live programming.
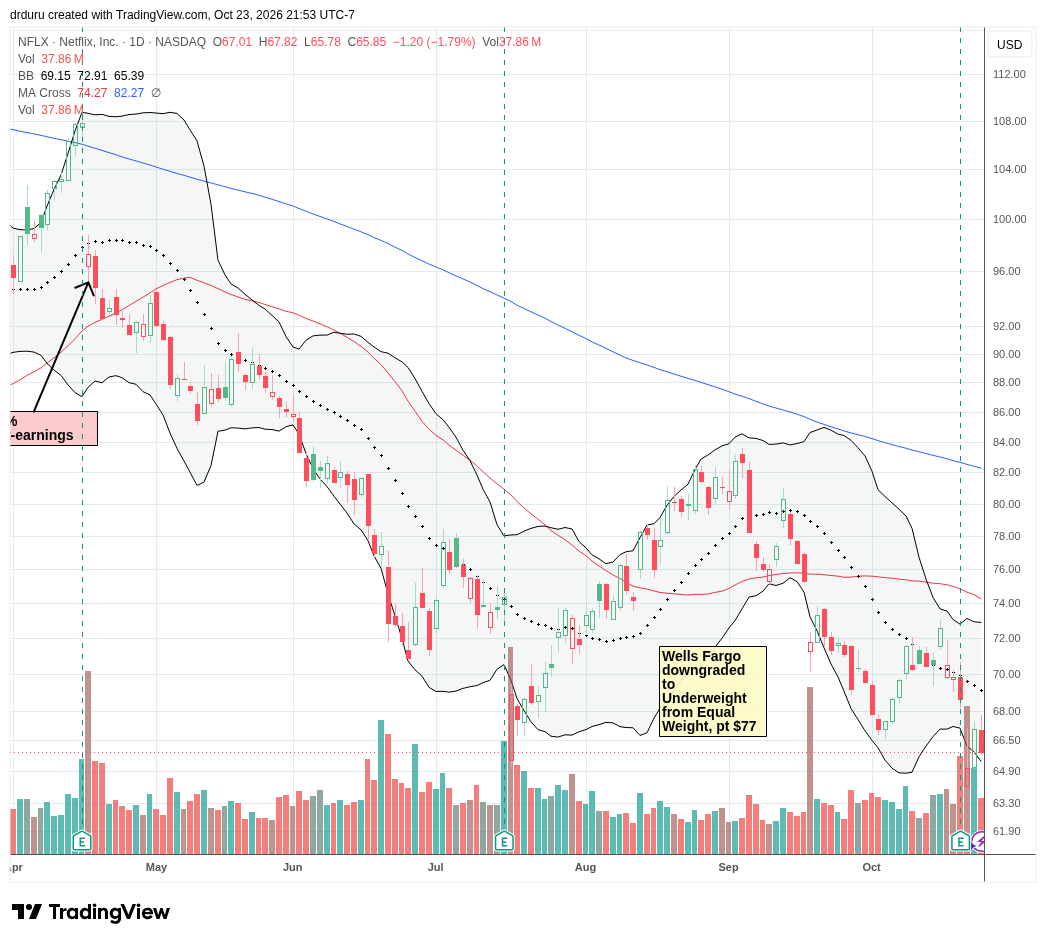
Technical Status: Netflix (NFLX) lost 5.1% post-earnings and dropped to a 2+ year low as a persistent downtrend continues to worsen.
Trade Commentary: Not every beaten-down consumer-facing stock is participating in a recovery that is helping to leave behind the topping AI trade. NFLX is a good example.
I have been trying to hang on to NFLX even as its downtrend continues. Ironically, I was once so bearish on NFLX that I anticipated an eventual decline like the current one. However, NFLX traded 2/3 of its current level, so I get no credit for that bearish call.
A pre-earnings downgrade from Wells Fargo added pressure, and NFLX never recovered from that setback. The latest earnings report produced another decline. Netflix reported third-quarter earnings on October 20, generating $12.87 billion in revenue and diluted earnings of $0.87 per share. Despite exceeding earnings expectations, shares declined in after-hours trading and remained under pressure the following session. Investors seemed to focus on delays affecting the advertising business and fourth-quarter guidance that fell short of some forecasts.
Best Buy (BBY)
Description: Best Buy operates consumer electronics retail stores and digital sales channels, providing computers, appliances, entertainment products, and related technology services.
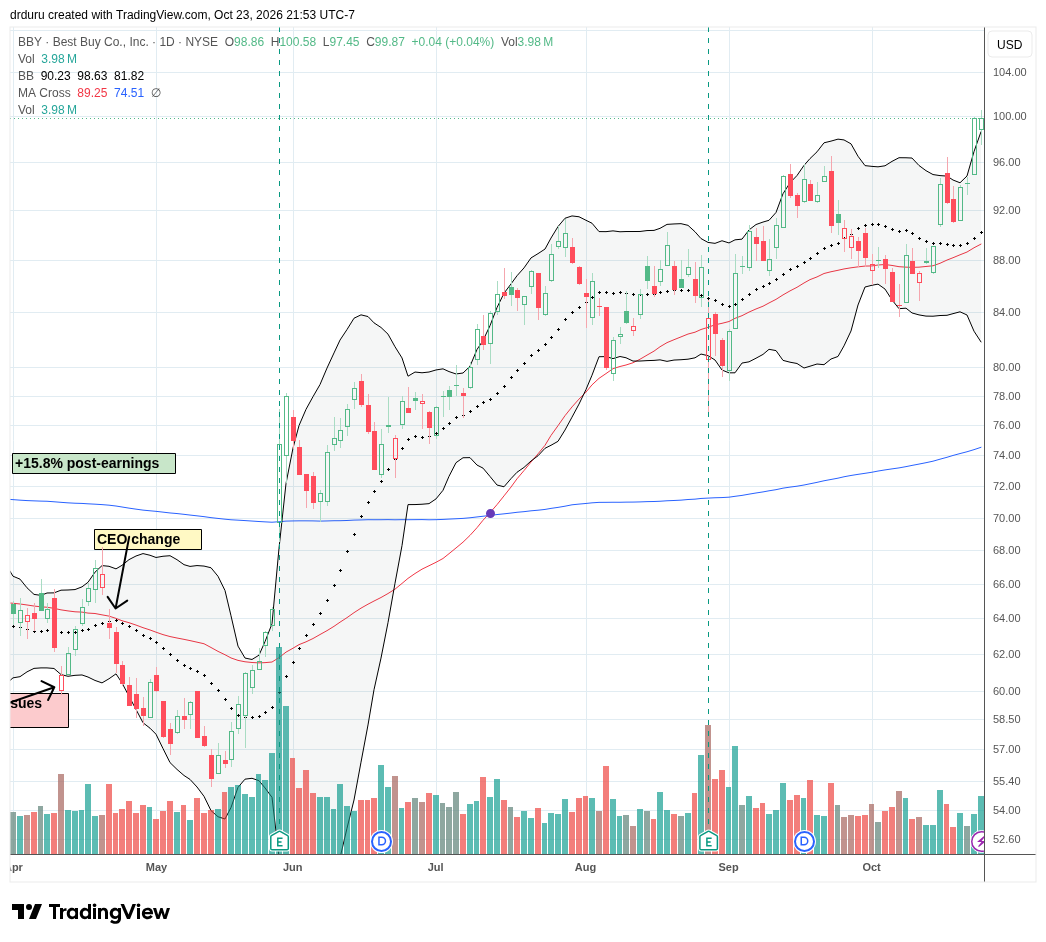
Technical Status: Best Buy (BBY) broke out to a 2-year high.
Trade Commentary: BBY is another consumer-facing stock showing surprising strength. Still, when I zoom out on the chart, the longer-term picture is not compelling. BBY has essentially gone nowhere since before the pandemic, around 2019. Thus, BBY remains a trading stock. I am looking to buy BBY after it cools down from its extension above its upper Bollinger Band.
iShares Expanded Tech-Software Sector ETF (IGV)
Description: The iShares Expanded Tech-Software Sector ETF tracks an index of North American software companies and selected interactive media and services businesses. (Source)
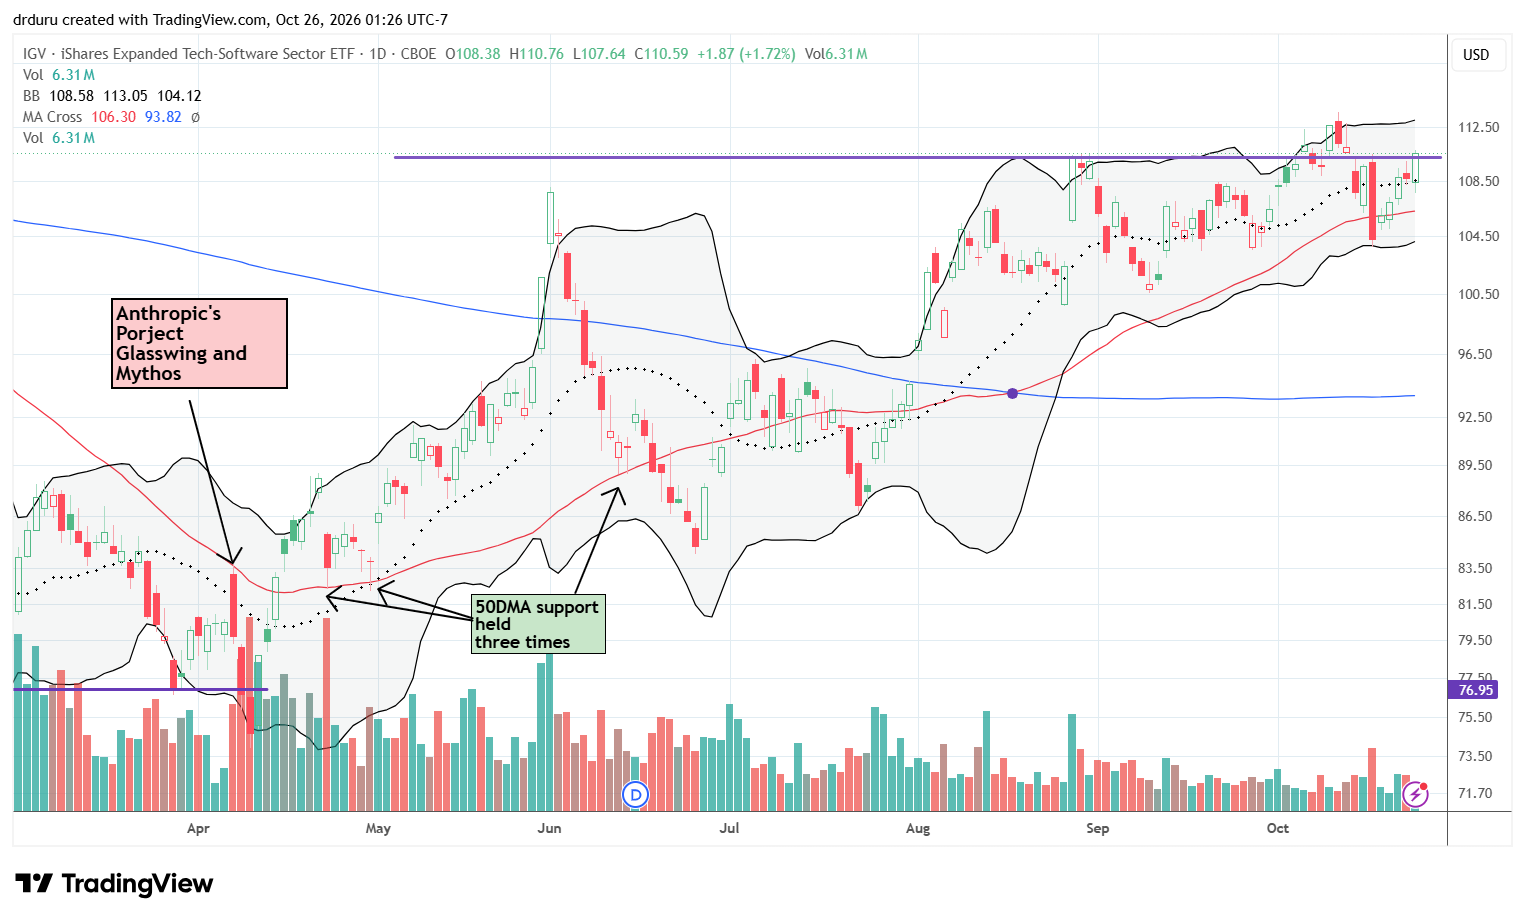
Technical status: The iShares Expanded Tech-Software Sector ETF (IGV) spent the week recovering from the previous week’s false breakout.
Trade commentary: IGV traded higher every day of the week. The ETF of software stocks ended the week marginally above the breakout point (see the purple horizontal line below). Thus, it looks ready to resume its momentum and leave the topping AI trade behind like a form of poetic justice from this year’s AI panic that generated the SaaSpocalypse.
Gartner (IT)
Description: Gartner provides research, advisory, and consulting services that help organizations make business and information technology decisions.
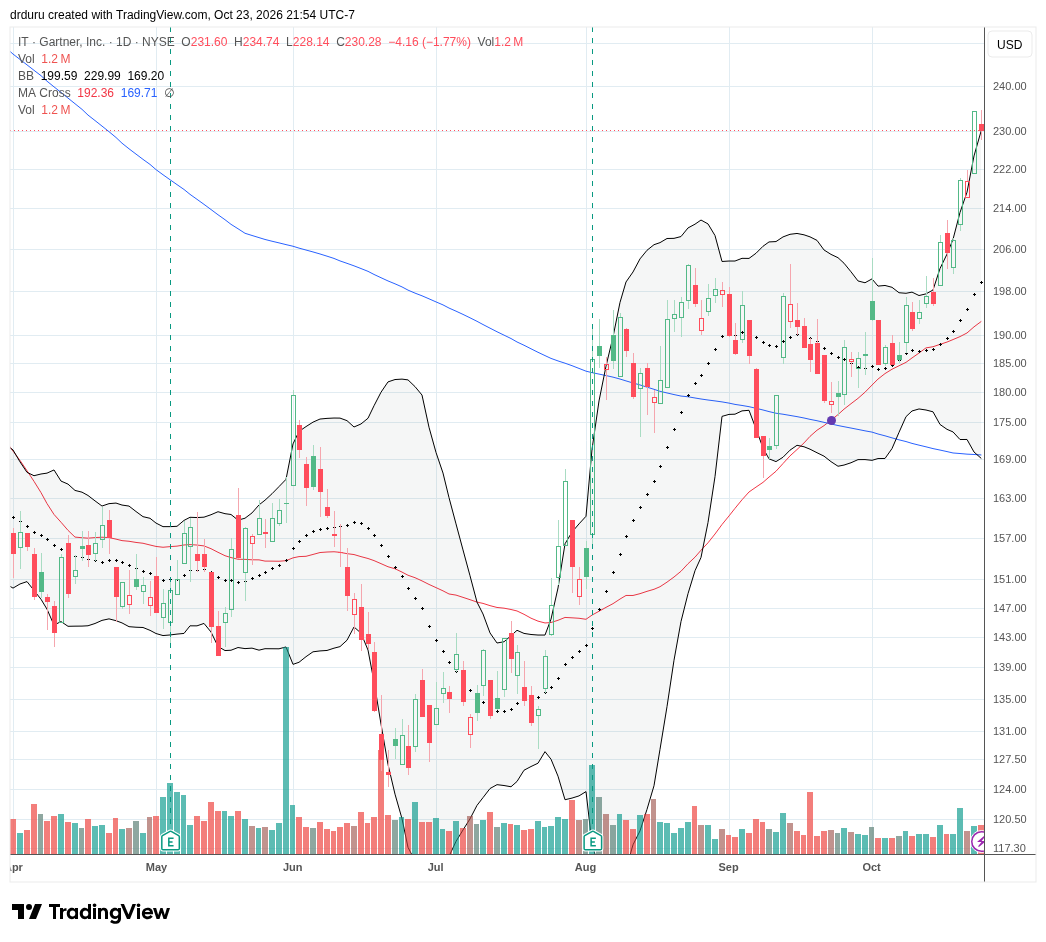
Technical Status: Gartner (IT) continued its ride along its upper Bollinger Band as it approaches its highest point of the year.
Trade Commentary: IT is one of my favorite trades from the long list of victims of this year’s AI panic over research-related companies. October treated IT particularly well with a 23.5% gain culminating in a near-parabolic runup alongside its upper Bollinger Band. Readers know that such a run makes me wary and motivates me into risk management mode. Accordingly, I finally took profits in my position. I stand ready to buy into the next sell-off if it comes. Note how well the stock held 50DMA support throughout September.
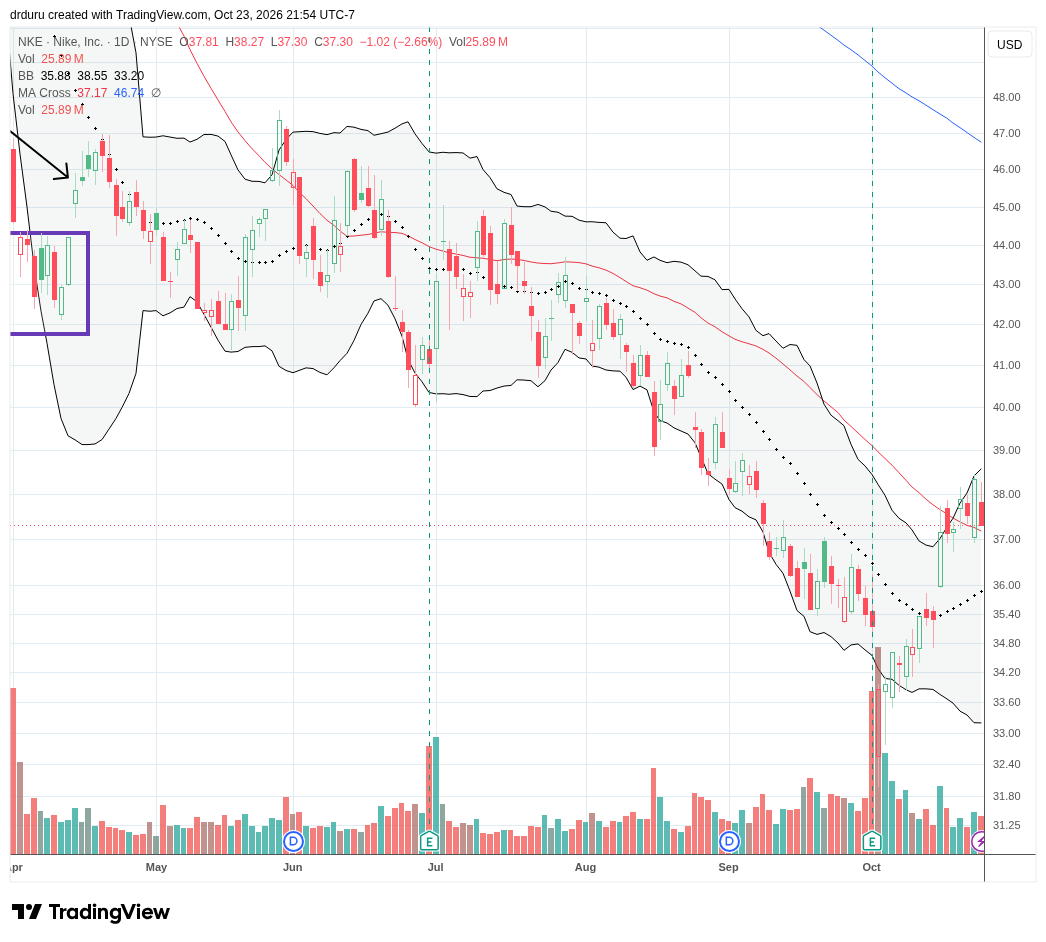
NIKE (NKE)
Description: NIKE designs, markets, and sells athletic footwear, apparel, equipment, and accessories through wholesale and direct-to-consumer channels.
Technical Status: NIKE (NKE) continued its post-earnings recovery with a tentative 50DMA breakout.
Trade Commentary: NKE’s slow recovery is the kind of development that makes the market rotation away from a topping AI trade so interesting. NKE has looked ugly since the stock topped in 2021 and has been in a steep downtrend ever since. After falling 3.6% post-earnings at the beginning of October, I almost stopped out and took a loss on my recent trades. However, buyers lifted the stock off its intraday low, so I waited to see whether those lows would hold. That wait for confirmation paid off. Now I am watching for fresh signs of a bearish-to-bullish reversal.
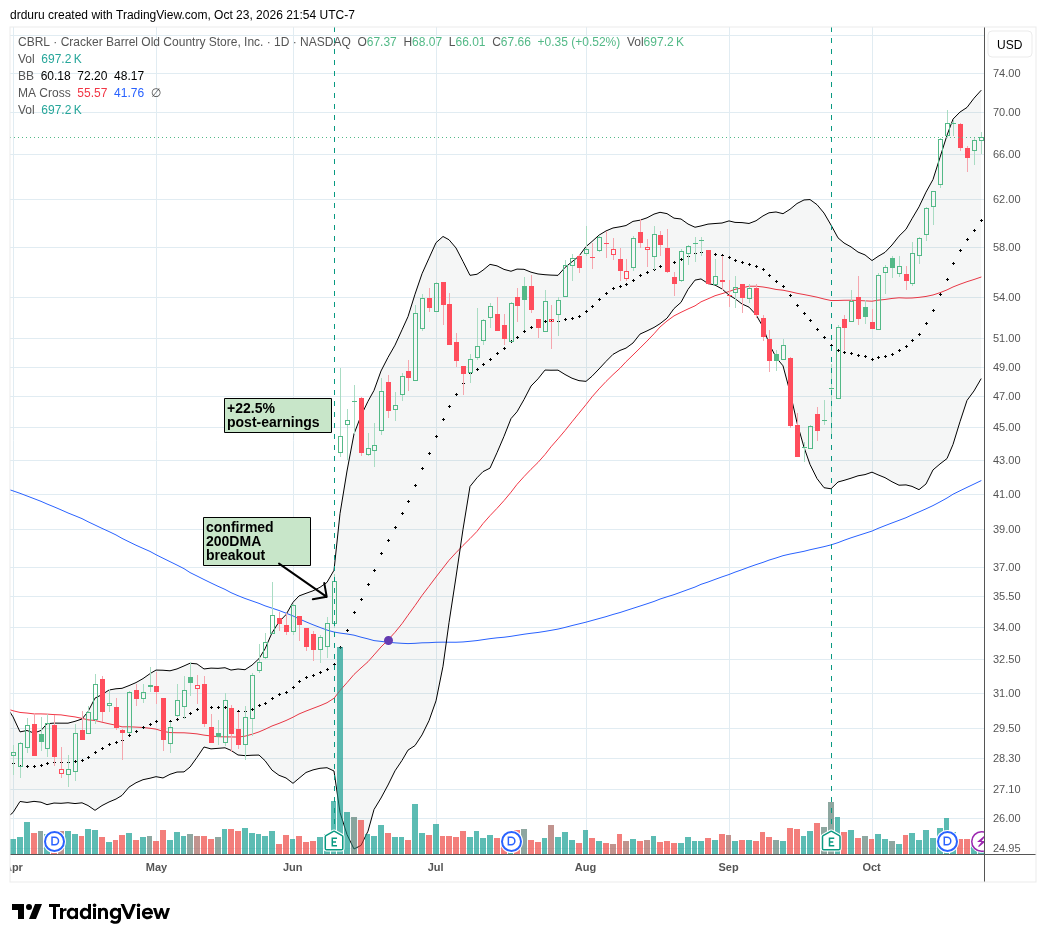
Cracker Barrel Old Country Store (CBRL)
Description: Cracker Barrel Old Country Store operates family dining restaurants and associated retail gift stores across the United States.
Technical Status: Cracker Barrel Old Country Store (CBRL) continued its post-earnings momentum to a 15-month high.
Trade Commentary: CBRL continues to surprise me. The stock’s 15-month high clears the price hurdle of last year’s logo controversy and nearly returns it to “normal.” The stock is a buy the dips from here for me. A pullback to around $62, near 20DMA support, would be a particularly attractive entry point.
Footnotes
Subscribe for free to get email notifications of future posts!
“Above the 50” (AT50) uses the percentage of stocks trading above their respective 50-day moving averages (DMAs) to measure breadth in the stock market. Breadth defines the distribution of participation in a rally or sell-off. As a result, AT50 identifies extremes in market sentiment that are likely to reverse. Above the 50 is my alternative name for “MMFI” which is a symbol TradingView.com and other chart vendors use for this breadth indicator. Learn more about AT50 on my Market Breadth Resource Page. AT200, or MMTH, measures the percentage of stocks trading above their respective 200DMAs.
Active AT50 (MMFI) periods: Day #316 over 20%, Day #4 over 30% (overperiod), Day #32 under 40% (underperiod), Day #33 under 50%, Day #49 under 60%, Day #289 under 70%
Source for charts unless otherwise noted: TradingView.com
Full disclosure: long SPY, long NKE, long ISRG, long GOOG, long XLV, long FRSH, long NFLX, long IGV
FOLLOW Dr. Duru’s commentary on financial markets via StockTwits, BlueSky, and even Instagram!
*Charting notes: Stock prices are not adjusted for dividends. Candlestick charts use hollow bodies: open candles indicate a close higher than the open, filled candles indicate an open higher than the close.
* Blog notes: I use ChatGPT to help with editing and news discovery.