
AT40 = 85.7% of stocks are trading above their respective 40-day moving averages (DMAs) (20th overbought day)
AT200 = 47.3% of stocks are trading above their respective 200DMAs (4-month high which reverses the October, 2018 breakdown)
VIX = 13.5
Short-term Trading Call: neutral
Stock Market Commentary
The waiting game continues within a bullish cloak. An extended overbought rally slowly rolls along toward major man-made March deadlines facing US-China trade relations and Brexit. March even features the next meeting of the Federal Reserve. The positive bias in the anticipation is reflected through a series of indicators. At the time of writing, President Trump announced he is willing to extend the tariff deadline because of good progress in negotiations. Stock futures are up, but I do not trust those highly manipulated markets. Instead, I look at currency markets which show traders quickly reversing the trigger-finger reaction to the headlines. For example, the Australian dollar (FXA) rolled back almost all its instant gains. In other words, stocks are as likely to fade a gap open on Monday as they are to maintain a rally into the close.
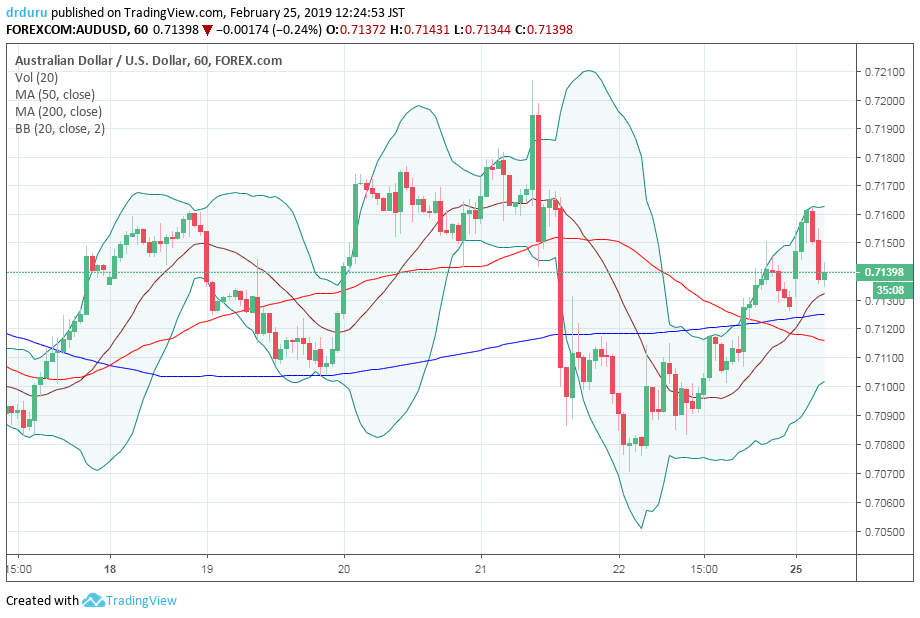
Source: TradingView.com
AT40 (T2108), the percentage of stocks trading above their respective 40-day moving averages (DMAs), is on day #20 of this overbought period. AT40 is even holding its own well above 80% for 9 straight days. The average 80% overperiod is only 5 days long with a median around 3 days. The average 70% overperiod, an overbought period, lasts around 8 days with a median around 4 days. The S&P 500 (SPY) has gained 4.8% so far during this oversold period. If the overbought period ended today, the S&P 500 would be well ahead of historical performance.
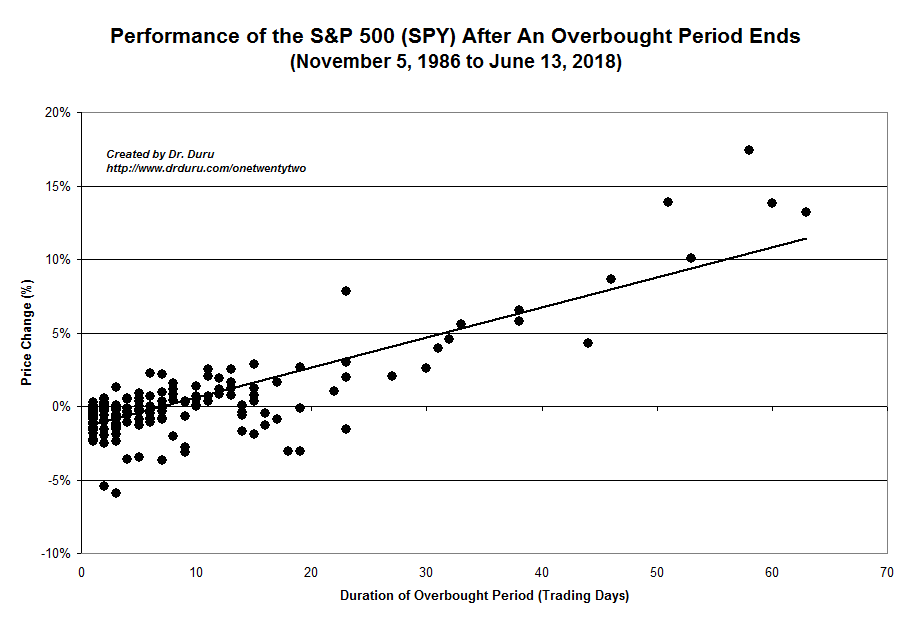
AT40 is now at the edge of a key “lift-off” point where the S&P 500 gets a “second wind” of performance. For example, over the next 10 trading days, the S&P 500’s performance for the overbought period converges toward 5%. If the current overbought period matches historical tendencies, then the S&P 500 will have to max out above 5% performance in order to exit the overbought period with a gain of 5% overall. In other words, the S&P 500 has at least a little more upside in store before this overperiod ends. I will call it another 1% or so for trading purposes.
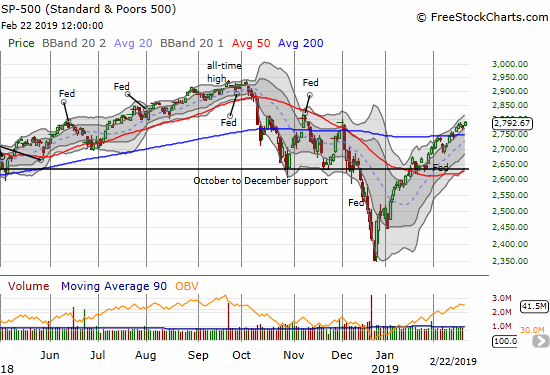
The 200-day moving average (DMA) still features prominently in this overbought period. AT200 (T2107), the percentage of stocks trading above their respective 200DMAs, is at a new 4-month high and has reversed its breakdown from the October sell-off. Meanwhile, the major indices are still lingering around their respective 200DMAs with slow motion action. The S&P 500 (SPY) is up for a critical test of the peak from November.
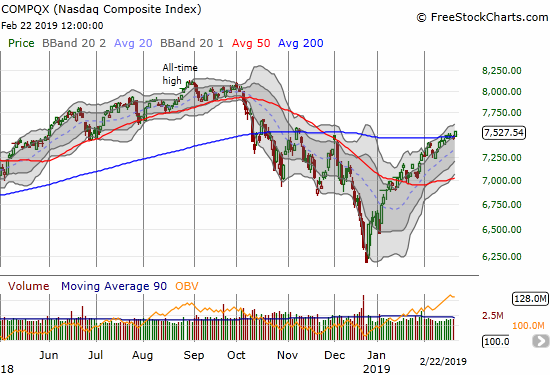
The NASDAQ went from the slightest of taps on 200DMA resistance to a tentative 200DMA breakout. The tech-laden index already slipped by its late November peak and now wrestles with the early November peak. A move higher from here faces minimal resistance until around 8000 which represents a complete reversal of the sell-off that started in early October.
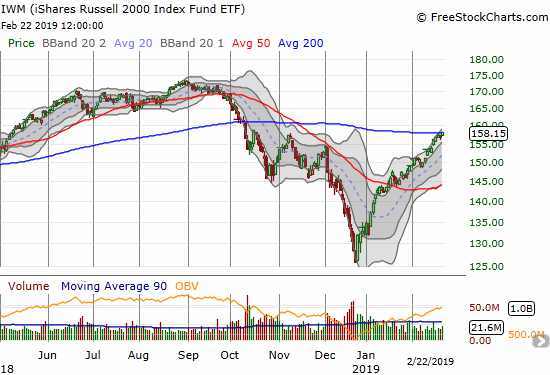
The iShares Russell 2000 ETF (IWM) is making its own bid for a 200DMA breakout. IWM finished just 0.25 points above this critical trendline. With the last three peaks already surpassed, IWM faces minimal resistance from here until a test of the all-time high set last August.
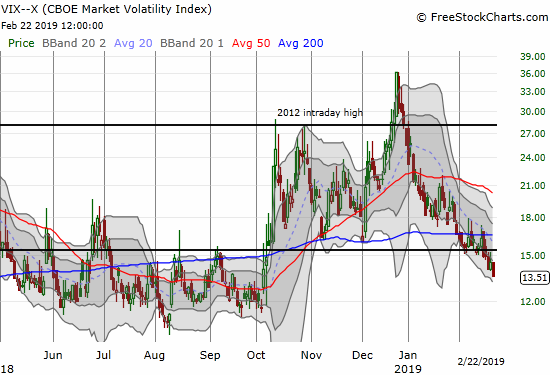
The volatility index, the VIX, made a decisive move lower. The VIX broke down from the 15.35 pivot and is charging toward the extreme low levels that dominated trading for months ahead of the October breakdown.
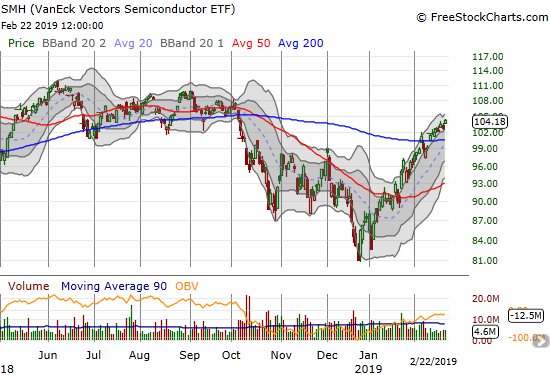
I continue to watch Semiconductor Hldrs ETF (SMH) for additional clues. SMH closed the week near a 5-month high. The index of semiconductors is near a complete reversal of its loss since the October breakdown.
My short-term trading call remains stuck in neutral even with this tantalizing picture of a stock market fueling up for another sprint higher against weakening resistance. As a reminder, this neutral setting came from the 1-day overbought period that preceded this overbought period. If not for that brief fake-out, I would be at a cautiously bullish stance. In other words, I see no signs of a top in the market, but I am also not interested in betting on the major indices. This combination makes me both willing to consider individual stocks making fresh 200DMA breakouts or tests of 200DMA support while looking to short select stocks that are demonstrating weakness relative to the market. I am also trying to avoid big bets either way.
Stock Chart Reviews
Friday, February 22nd was a fascinating day of tremendous post-earnings stock moves. Some of the moves look exaggerated, perhaps from panicked shorts closing out positions. I include several of these charts for reference as some may large trading opportunities counter to the post-earnings direction and some may present buy-the-dip candidates.
Intel (INTC)
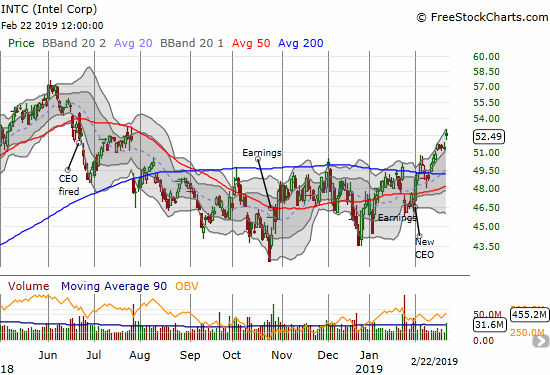
Morgan Stanley (MS) upgraded Intel from equal-weight to over-weight and increased its price target from $55 to $64/share. Nightly Business Report noted that MS last upgraded INTC over 7 years ago! The stock gained 2.1% in response and closed at a 7-month high. The October breakdown and sell-off is now receding in INTC’s rearview mirror. The move also caught me without any “between earnings” call options in hand. I now await the next pullback for another buying opportunity.
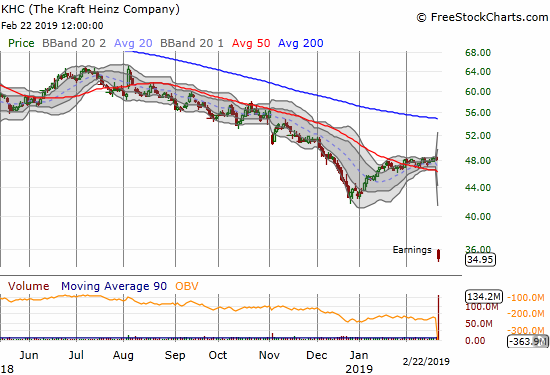
The Kraft Heinz Company (KHC)
Kraft Heinz Company (KHC) hit a major reset button that crashed the stock with a 27.5% loss. KHC included in its earnings report a massive write-down of $15.4B (at the time of close KHC had a $42.6B market cap after losing $17B in value), a dividend cut, slashed earnings guidance, AND an SEC investigation into accounting irregularities. The stock closed well below its lower Bollinger Band (BB) and thus tempts me to trade it for a bounce at least back to that technical marker. However, the downtrend in KHC has been persistent and panicked sellers may not quite be finished dumping the positions they have stubbornly held through that downtrend.
The folks at CNBC’s Options Action had an interesting idea for current stock holders to take advantage of the surge in implied volatility: buy an April $37.50 call and sell two April $40 calls for a net zero cost for every 100 shares long.
Big investors are the interesting twists to this story. KHC is roughly a whopping 7% of the holdings of Berkshire Hathway of Warren Buffet fame. Will Buffet bail or use this as an opportunity to add to his position? If investors even get a hint of Buffet dumping, I assume they will try to front-run as much as possible. Either way, I think the stock has a lot of room to move up or down, and I will be looking to put on a position marrying a put spread to call options.
Roku (ROKU)
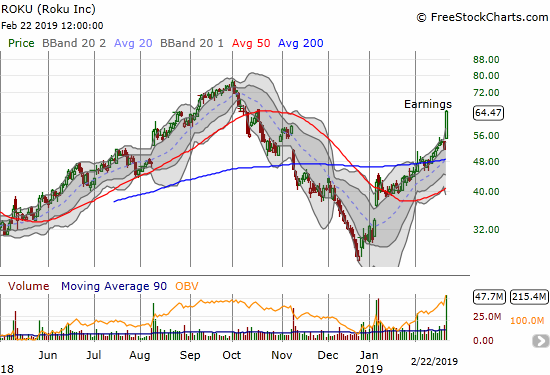
ROKU sports a heavy short position, not surprising for a consumer hardware stock not named Apple (AAPL), with 34.8% of its float sold short. I was unfortunate enough to pile on with my own hedged short position in what I thought was an earnings play with a lot more downside than upside risk for the stock.
ROKU survived its earnings and the move looked mild enough at first. The day turned into a rout for shorts. The gain was enough to get me a close on the March $52.50/$60 call spread I put in place for a hedge. At the $62 I bought a March $65 call for good measure. The race is now on to challenge the all-time high set at the end of September before the market experiences its next pullback. I like ROKU for more big moves ahead, and I will be using the short position as the backstop for call options.
KB Home (KBH)
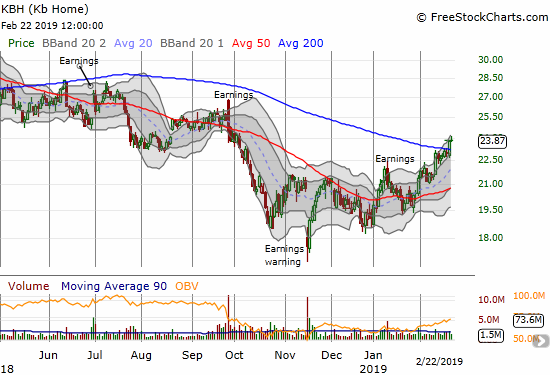
KB Home (KBH) spent almost two weeks churning just below its 200DMA. The stock finally broke out and thus goes back on my list of buys for seasonal plays on home builders.
Universal Display (OLED)
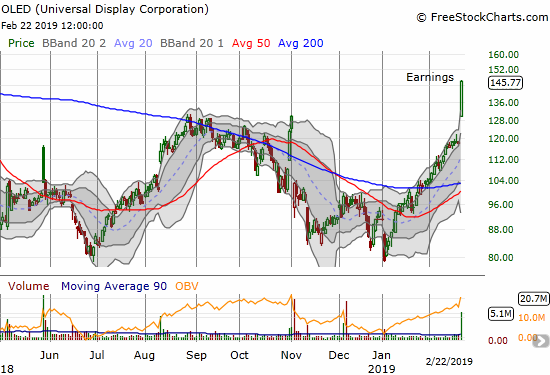
Universal Display (OLED) is a huge miss on my part. The stock essentially printed and confirmed a double bottom in January. I did not pay much attention because the stock was greatly under-performing the market off the Christmas Eve low. Now I can only hope to get a buy-the-dip opportunity after OLED rocketed to a post-earnings 23.0% gain.
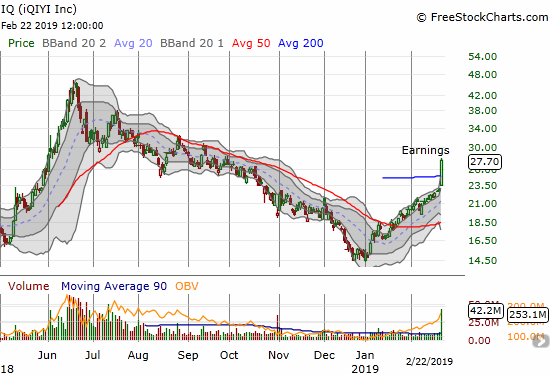
iQIYI (IQ)
The downtrend in iQIYI (IQ), the “Netflix of China”, was extensive before ending in December alongside the stock market’s major low. After a very positive post-earnings breakout and response, the stock looks ready to return to the rapid run-up days immediately following the stock’s IPO. I have accumulated a position that I intend to hold for the “long-term.”
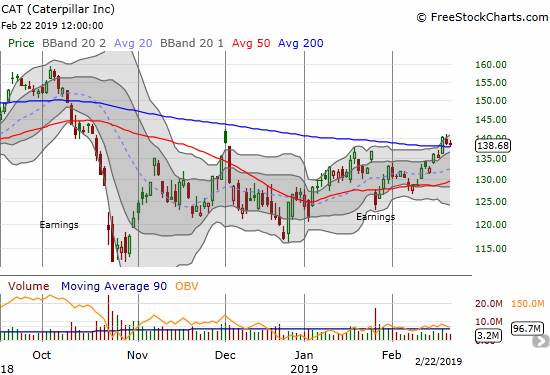
Caterpillar (CAT)
Caterpillar (CAT) answered the call and broke out above its 200DMA. No follow-through buying yet, but such a move would be very bullish for the stock. Investors are clearly eagerly trying to get ahead of an announcement of a China-US trade deal but not move too fast. There is no longer a need for me to refresh CAT puts for a hedge in the short-term until the stock trades below its 200DMA again.
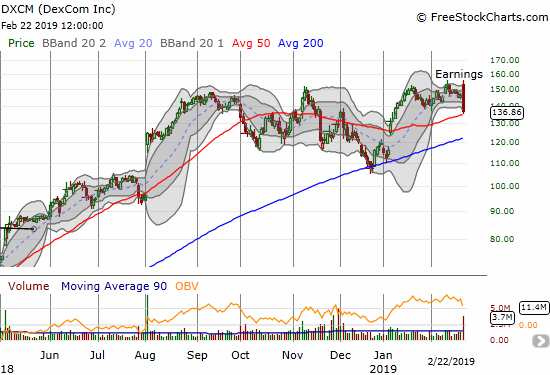
Dexcom (DXCM)
My +3% price alert on DXCM triggered first thing in the morning. Before I had a chance to check on the chart and the news, my -3% price alert triggered. Assuming a major reversal was underway, I immediately set out to short the stock. My limit order was filled and the stock kept pushing higher before settling back down into selling mode. I covered before the test of 50DMA support. This post-earnings move is topping action since the sharp reversal pushed off an all-time high. The test of 50DMA support is very critical.
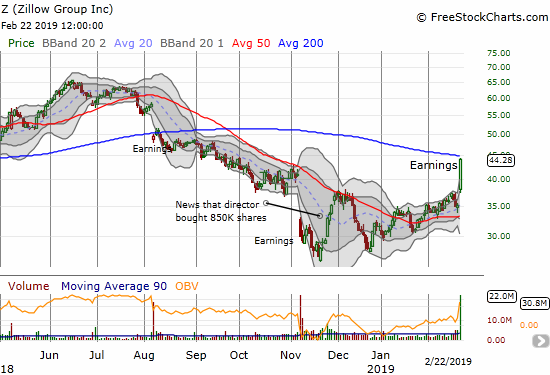
Zillow Group (Z) (ZG)
I made a case for buying Zillow Group (Z) (ZG) in late November following news of insider buying. A buyable dip followed the stock’s failure at 50DMA resistance. From an abundance of caution, I almost took profits on the stock ahead of earnings. However, I kept in mind competitor Redfin’s post-earnings 200DMA breakout as a model of upside potential. The results far surpassed my even most hopeful expectations; of course, the surge had good company on the day. Now I am trying to hold through a very important test of 200DMA resistance for Zillow Group.
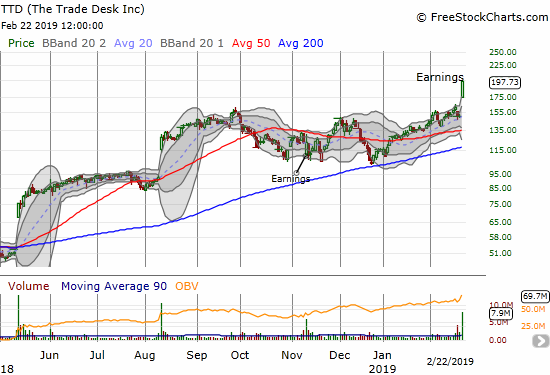
The Trade Desk (TTD)
The pre-earnings chart of The Trade Desk (TTD) looked like a coiled spring. I wish I saw that pattern BEFORE earnings!
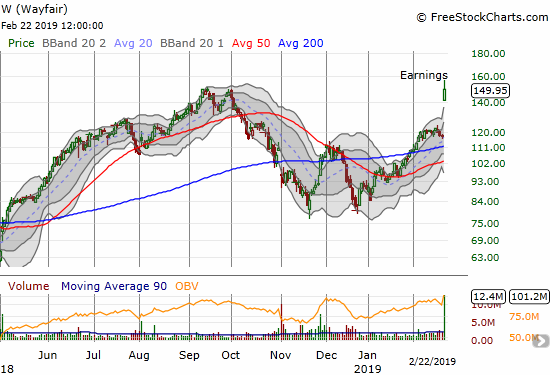
Wayfair (W)
Wayfair (W) enjoyed a 27.9% post-earnings leap. I missed the 200DMA breakout on this one (I REALLY need to get more disciplined about using SwingTradeBot!). That move alone was a signal for speculating long on W even through earnings. The stock stopped just short of closing at a new all-time high. This stock is likely a buy-on-the-dip, but it is too hot to handle for me until it consolidates its gains for at least a week or so.
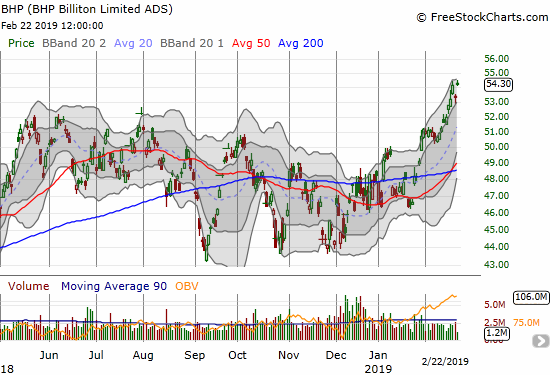
BHP Billiton (BHP)
BHP Billiton (BHP) broke out this month to multi-year highs and still looks like it has plenty of gas left. My current pairs trade on BHP vs Rio Tinto (RIO) is a switch from the usual with BHP puts and RIO calls. Looks like I would have done well to just stick with the original script after I took profits on the last trade!
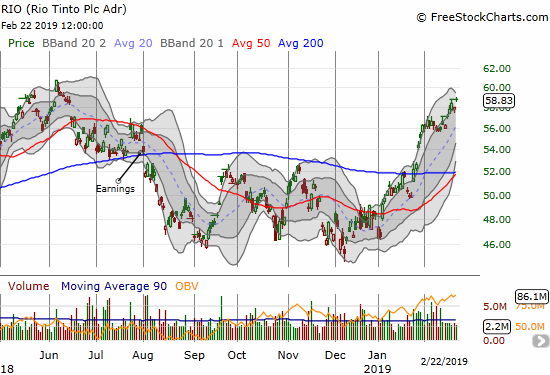
Rio Tinto (RIO)
Rio Tinto (RIO) slowed down to start the month but is ending on a strong note. The stock is facing down strong resistance around the $60 level. This point has failed several times over several years. Above that level awaits a SEVEN-year high.
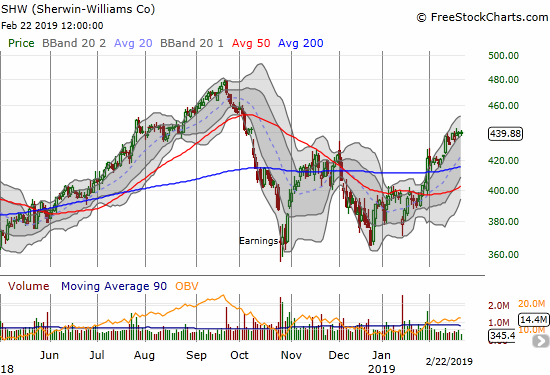
Sherwin-Williams (SHW)
Sherwin-Williams (SHW) is back in bullish form with a higher low and higher high as part of a confirmed 200DMA breakout. SHW’s fortunes are part of the turn in sentiment toward the housing market, and it helps solidify my (re)confidence in the home builder trade.
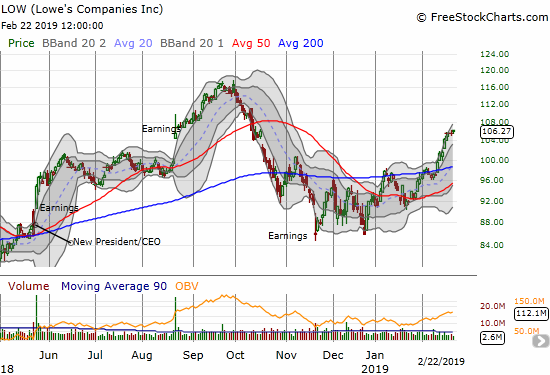
Lowe’s Companies (LOW)
Lowe’s delivered the previous week as I had hoped. Now I see a stock that could easily make a run for its all-time high. I will wait until after earnings the morning of the 27th to decide on any new moves (buys).
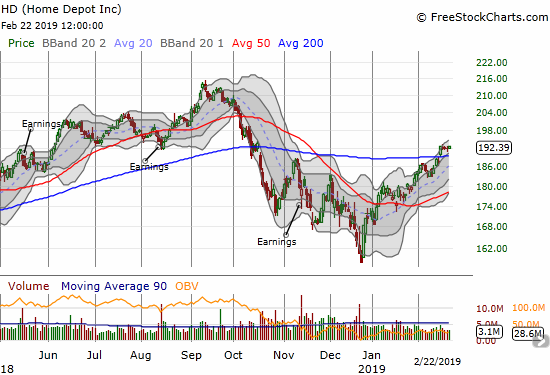
Home Depot (HD)
Home Depot (HD) finally joined LOW in breakout territory. If not for earnings on the morning of February 26th, I would have loaded up on call options. Instead, I will wait for the next signal…
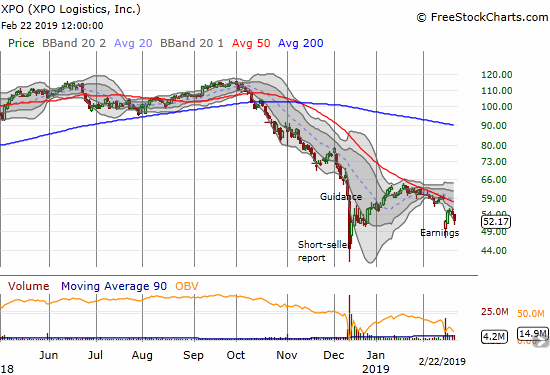
XPO Logistics (XPO)
XPO Logisitics (XPO) is a classic example of the risk of overstaying a welcome on a bottom-fishing expedition. I made the case for the stock in December after the climactic sell-off. I took profits on call options ahead of expiration. The market called my stock away which was covered by a short call. After that, I just watched as XPO first failed to punch through 50DMA resistance next started following the trendline downward. I did not buy into last week’s post-earnings selling because of the news of a loss in business from a major customer (likely Amazon.com (AMZN)). If not for the company announcing another $1.1B buyback, I would now wonder whether the short-seller got it right after all. Instead, XPO is on my buy list for the coming week assuming the stock does not zip past its latest post-earnings low. From Seeking Alpha transcripts (emphasis mine):
Also in December, our board authorized a $1 billion stock buyback, which we completed earlier this month. As we announced yesterday, the board has authorized an additional buyback of up to $1.5 billion.
While we love M&A, the acquisition that will create the most shareholder value right now is acquiring our stock. As you saw in the release, we brought down the numbers for 2019. We can’t ignore the fact that our largest customer is curtailing about two thirds of its business with us.We had substantial capacity dedicated to this customer in brokerage, last mile and logistics. But we believe the great bulk of these resources should be redeployed over the next couple of quarters.
I am following the company’s example in buying back into the stock.
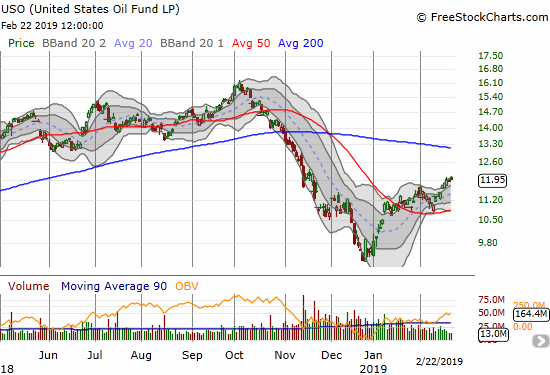
United States Oil Fund (USO)
Oil is on the rebound along with other commodities and stocks. I have not bothered buying back in because USO is chugging along so slowly. I assume USO is headed for a 200DMA rendezvous.
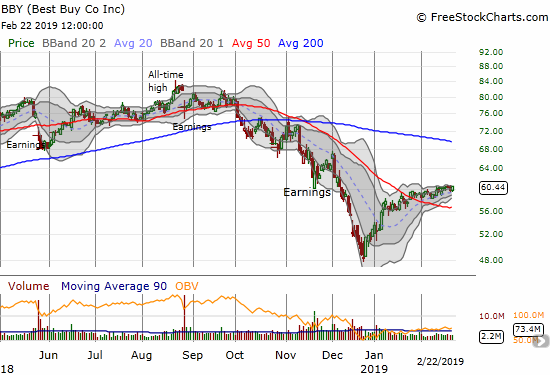
Best Buy (BBY)
Best Buy (BBY) is defying gravity with a slow motion roll that includes a 50DMA breakout. My original bearish expectations simply failed to materialize. The stock is effectively in limbo until earnings the morning of February 27th. I am looking to that event to be a major catalyst. For example, the market is pricing in about an 8.8% up or down post-earnings move given the March 1 $60 straddle (call and put at the $60 strike) costs $5.30. Compare that to the implied 9.8% move priced in for the March 15 expiration. In this situation, I like playing stock on one side and a spread on the other. Given the fireworks from Friday, I will buy shares and a Mar 1 $60/56 put spread for about $1.30. Note the 50DMA is around $56.
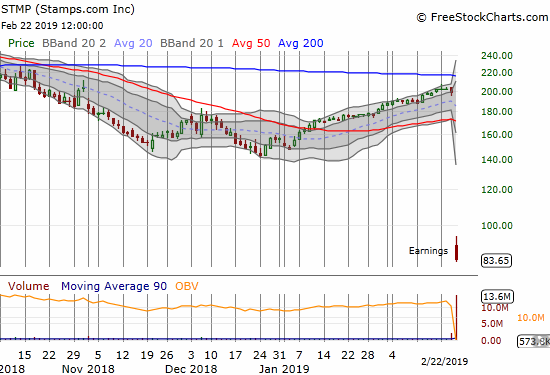
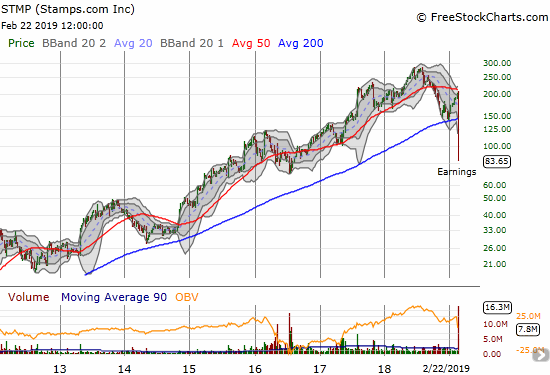
Stamps.com (STMP)
Stamps.com (STMP) lost an astounding 57.8% after cutting its guidance in half and announcing the loss of its partnership with the United States Postal Service (USPS). I honestly did not know there was anything else to STMP’s business. I thought STMP would bounce back for “only” a 40% loss, but sellers were relentless. I am still going to keep a close eye on this one for a trade: buy on a post-earnings high, short only after the lower Bollinger Band (BB) “catches up” to the stock. Notice in the chart below how volume surged ahead of earnings – “someone” had a whiff of bad news!
— – —
FOLLOW Dr. Duru’s commentary on financial markets via email, StockTwits, Twitter, and even Instagram!
“Above the 40” uses the percentage of stocks trading above their respective 40-day moving averages (DMAs) to assess the technical health of the stock market and to identify extremes in market sentiment that are likely to reverse. Abbreviated as AT40, Above the 40 is an alternative label for “T2108” which was created by Worden. Learn more about T2108 on my T2108 Resource Page. AT200, or T2107, measures the percentage of stocks trading above their respective 200DMAs.
Active AT40 (T2108) periods: Day #34 over 20%, Day #32 over 30%, Day #31 over 40%, Day #30 over 50%, Day #26 over 60%, Day #20 over 70%, Day #9 over 80%
Daily AT40 (T2108)
")
Black line: AT40 (T2108) (% measured on the right)
Red line: Overbought threshold (70%); Blue line: Oversold threshold (20%)
Weekly AT40 (T2108)

*All charts created using freestockcharts.com unless otherwise stated
The T2108 charts above are my LATEST updates independent of the date of this given AT40 post. For my latest AT40 post click here.
Related links:
The AT40 (T2108) Resource Page
You can follow real-time T2108 commentary on twitter using the #T2108 or #AT40 hashtags. T2108-related trades and other trades are occasionally posted on twitter using the #120trade hashtag.
Be careful out there!
Full disclosure: long UVXY calls, long CAT puts, long BHP puts, long RIO calls, short ROKU shares and long call, long Z, long IQ, short AUD/USD, long AUD/JPY, short EUR/AUD
*Charting notes: FreeStockCharts.com stock prices are not adjusted for dividends. TradingView.com charts for currencies use Tokyo time as the start of the forex trading day. FreeStockCharts.com currency charts are based on Eastern U.S. time to define the trading day.