
AT40 = 66.4% of stocks are trading above their respective 40-day moving averages (DMAs) (ended 1-day overperiod)
AT200 = 24.6% of stocks are trading above their respective 200DMAs
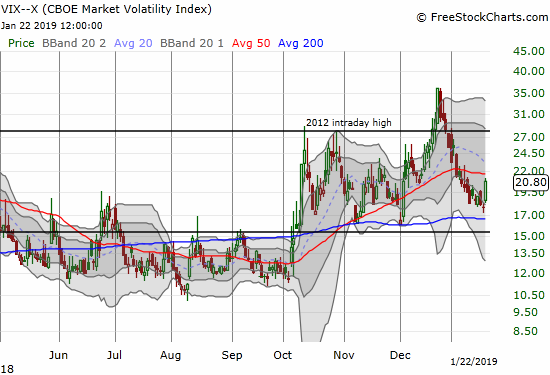
VIX = 20.8
Short-term Trading Call: neutral
Commentary
Days like these remind me of the importance of technicals.
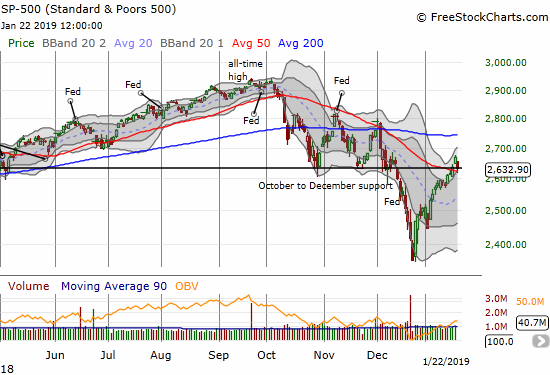
Just one trading day after surging into overbought trading territory, the stock market almost as quickly dropped out of overbought conditions. Instead of warming up for an extended bout of overbought trading, the stock market went into reverse. AT40 (T2108), the percentage of stocks trading above their respective 40DMAs, fell from 76.3% all the way back to 66.4%. Per my overbought trading rules, I downgraded my trading call, but I only went to neutral instead of bearish. Major indices sold off, some deeply, but key support levels at 50DMAs held firm. So, I can refrain from going bearish until, for example, the S&P 500 (SPY) confirms a 50DMA breakdown. For now, the index looks like it made a near picture-perfect bounce off that support. The index also closed right on top of the support that held from October to December last year.
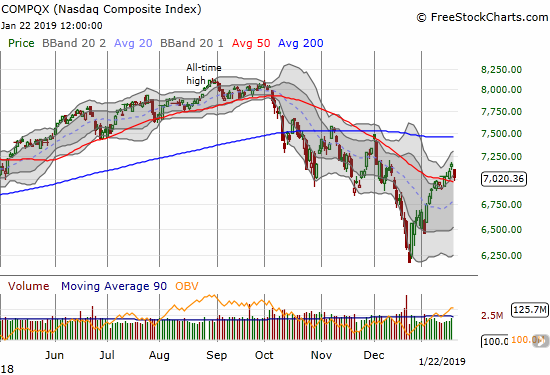
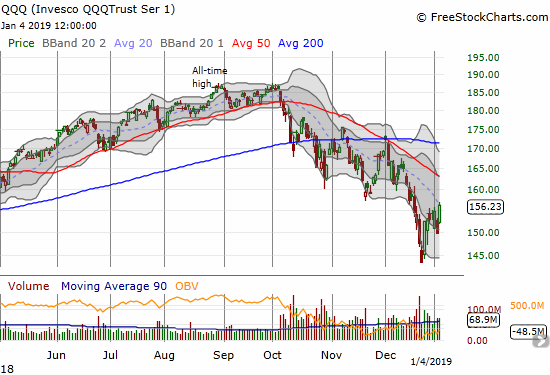
The NASDAQ and the Invesco QQQ Trust (QQQ) each had their own close encounter with 50DMA support.
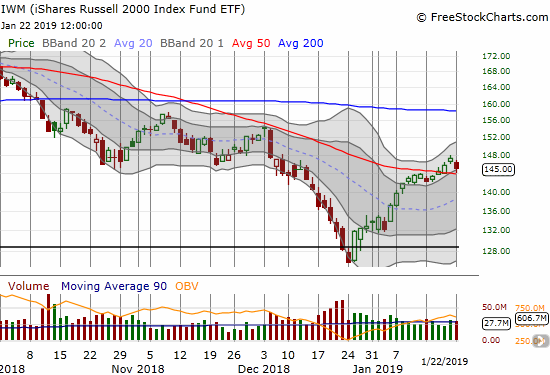
Even the iShares Russell 2000 ETF (IWM) came as close as possible to testing its 50DMA support just a day after confirming its 50DMA breakout.
Perhaps the biggest move I missed by strictly following my overbought trading rules was the surge in the volatility index, the VIX. The VIX soared right back to elevated levels (above 20). This gain was sharp enough to give the look of a bottom in the making. I was hoping to wait to go long volatility closer to the 15.35 pivot or at least the previous lows. The VIX’s surge makes me less enthusiastic about fading volatility until/unless it goes a lot higher again.
The technicals on the indices are so obvious that I am hesitant to draw firm conclusions until confirmations occur of support or fresh breakdowns. Confirmed support would be VERY bullish for the stock market especially happening in the thick of earnings season. Conversely, a confirmed breakdown would be exceptionally bearish and would set the market up for a retest of December’s climactic low.
CHART REVIEWS
Blue Apron (APRN)
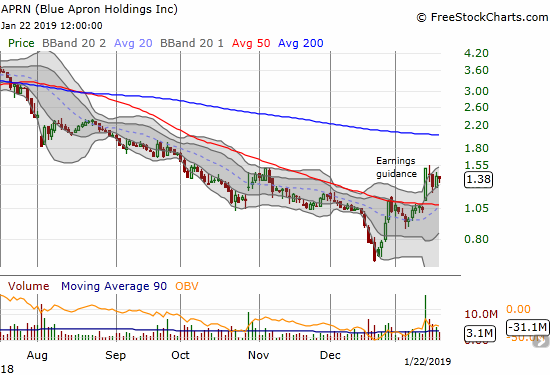
APRN came to mind after I saw an online ad for a ready-made cooking product. Last month, APRN broke through the dreaded $1 barrier but last week surged above it after encouraging pre-earnings news. The company promised to do more talking about its promising strategies. The most important piece of news came on reaffirmed guidance: “Based on its current view of the business, Blue Apron plans to reaffirm confidence in achieving profitability on an adjusted EBITDA basis both in the first quarter of 2019 and for full year 2019 as it actively pursues the appropriate strategies to create value for its stakeholders.” APRN jumped about 50% on the news and is now “digesting” that massive one-day gain. Earnings will be pre-market January 31st.
Incredibly, 19.9% of APRN’s float is still sold short. What are they waiting for? Complete and utter business failure? APRN once traded as high as $11 shortly after its IPO in June, 2017.
Amazon.com (AMZN)
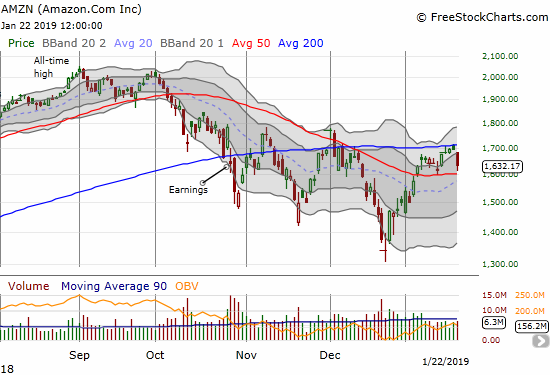
There was a time before October when a drop of over 3% in AMZN would be considered newsworthy and extremely alarming. Big cap tech stocks should NOT move in large chunks unless driven by company-specific news. Today’s 3.8% loss only created a test of 50DMA support. Still, the 200DMA looms as confirmed resistance.
Boeing (BA)
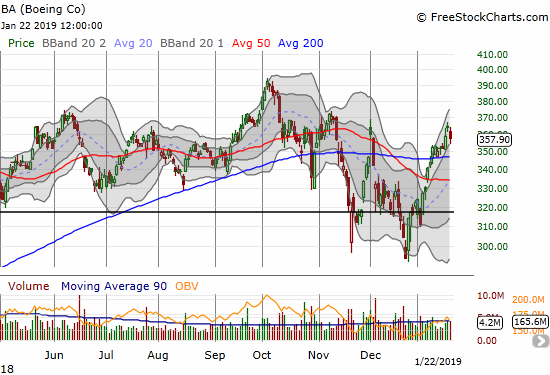
BA only lost 1.9% and stayed within its upper Bollinger Band. I post this chart because BA is one of a small minority of stocks trading above its 200DMA. Earnings are coming pre-market on January 30th.
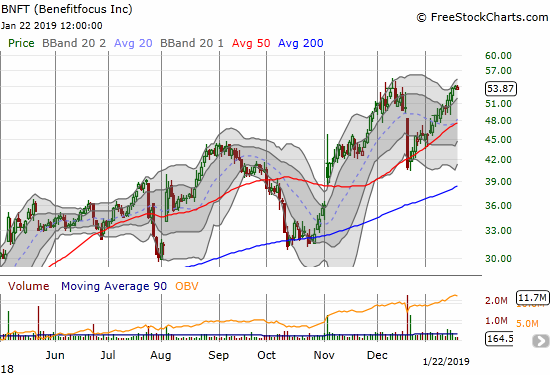
Benefitfocus (BNFT)
Speaking of trading above 200DMA support, BNFT last touched this critical support line back in October. Since then, BNFT has delivered surprising out-performance. Even after a deep swoon in December on news of a $200M convertible offering (senior notes due 2023), buyers stepped right back into the fray. This is the kind of strength I want to buy on the dips.
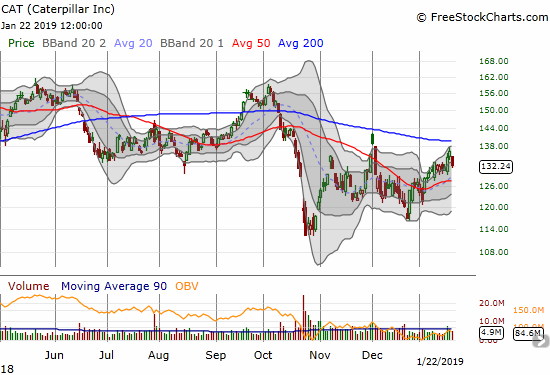
Caterpillar (CAT)
CAT dropped sharply enough to convince me the stock will not break through 200DMA before next week’s earnings pre-market January 28th. I grabbed a single put option expiring this Friday as speculation that the stock could continue selling into the week. I was hoping to get a better entry point for my next hedge; I was hesitant to do so on Friday. I am still preparing to play earnings from the bearish side.
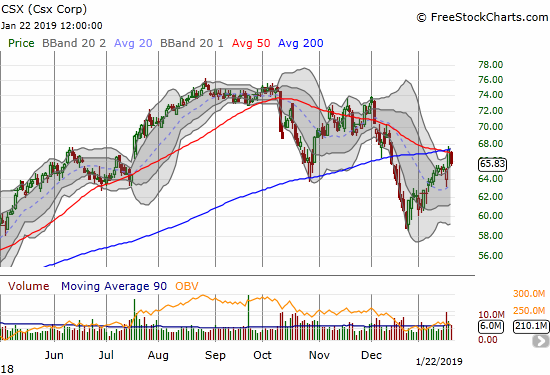
Csx (CSX)
This railroad company is a favorite of mine, yet I have not bought the stock (or calls) in a long time. I did not buy on last week’s post-earnings dip and watched in surprise as buyers ran the stock off the bottom and into resistance. Now, CSX looks like it confirmed converged and stiff resistance at its 50 and 200DMAs. This stock should be an important tell on the market. Note how the 20DMA (dashed line) is turning upward and the post-earnings low tapped it as support in picture-perfect form.
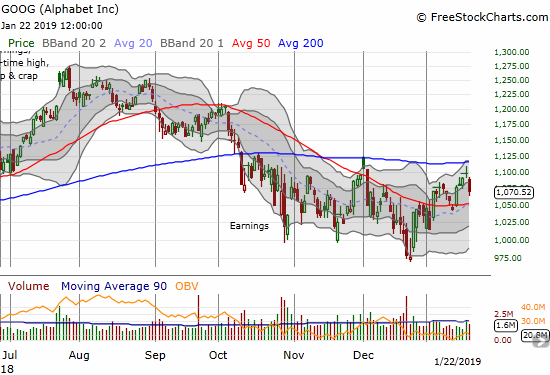
Alphabet (GOOG)
GOOG is another stock that failed at or near stiff 200DMA resistance. Ominously, GOOG pulled back from a topping “evening star” candlestick pattern. After the gap down open, I reached for a weekly put, but I low-balled my offer price too much. The put went on to double without me. On the positive side for the stock, its 50DMA is now rising to offer some support.
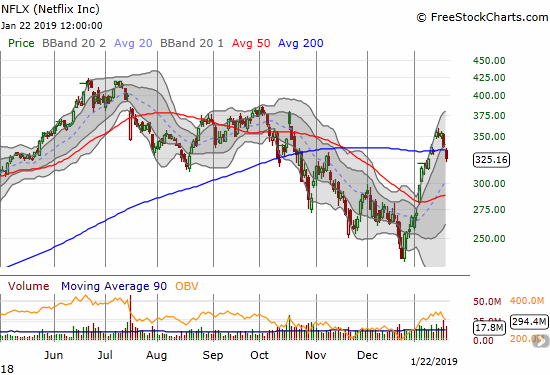
Netflix (NFLX)
The post-earnings selling continued in NFLX. The stock continued its return to bearish ways with a clean 200DMA breakdown. While the stock made an impressive run-up going into earnings, the stock’s 50DMA support is now in play as the fresh froth winds down a bit. I purchased a calendar put spread soon after the open with the $325 strike.
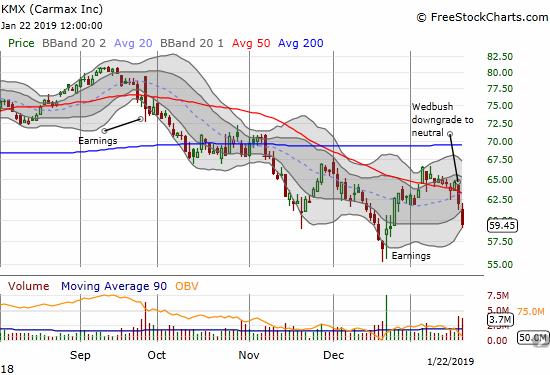
Carmax (KMX)
KMX continues to suffer from a devastating analyst downgrade on Friday. The stock’s December low is in play.
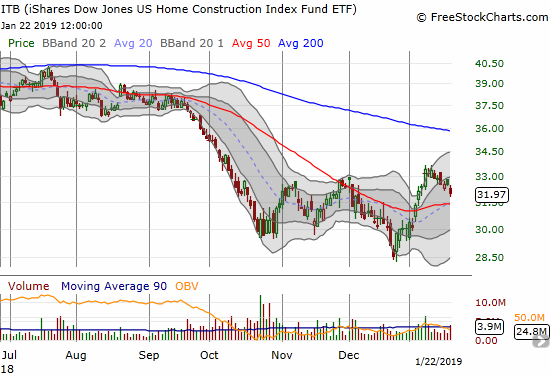
The iShares US Home Construction ETF (ITB)
ITB continued its underperformance as poor news on existing home sales put additional pressure on home builders. With ITB call options remaining as my last play on the seasonal home builder trade, I decided to take a flyer on doubling down on my April calls. If 50DMA support fails to hold, ITB will again become part of my bearish/cautionary narrative on the entire stock market.
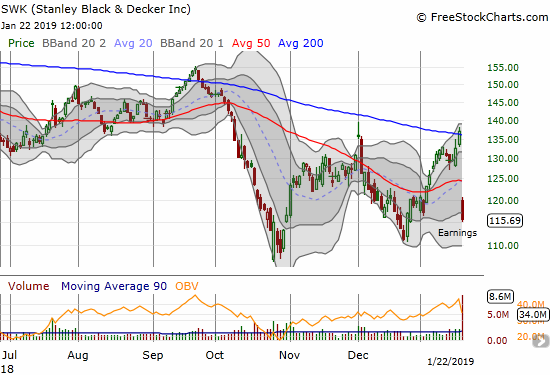
Stanley Black & Decker (SWK)
SWK added pressure to the housing sector with a very poorly received earnings report. The stock’s plunge was particularly discouraging because the stock just broke through 200DMA resistance for the first time in 4 months. The small breakout also looked like further progress on the stock’s recovery with a higher high following a higher low.
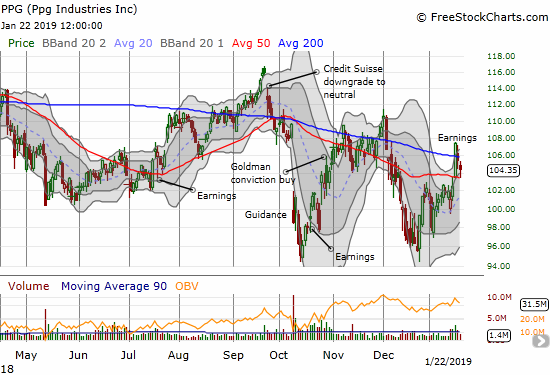
PPG Industries (PPG)
PPG was part of the bullish story last week as the market reacted very well to earnings despite lowered guidance. The subsequent selling of the last two days throws cold water on the story. The stock survived a test of 50DMA support, but it needs to soon recover 200DMA support.
Thanks again, David…!
— – —
FOLLOW Dr. Duru’s commentary on financial markets via email, StockTwits, Twitter, and even Instagram!
“Above the 40” uses the percentage of stocks trading above their respective 40-day moving averages (DMAs) to assess the technical health of the stock market and to identify extremes in market sentiment that are likely to reverse. Abbreviated as AT40, Above the 40 is an alternative label for “T2108” which was created by Worden. Learn more about T2108 on my T2108 Resource Page. AT200, or T2107, measures the percentage of stocks trading above their respective 200DMAs.
Active AT40 (T2108) periods: Day #12 over 20%, Day #10 over 30%, Day #9 over 40%, Day #8 over 50%, Day #4 over 60% (overperiod), Day #1 under 70% (underperiod ending 1-day overbought period)
Daily AT40 (T2108)
")
Black line: AT40 (T2108) (% measured on the right)
Red line: Overbought threshold (70%); Blue line: Oversold threshold (20%)
Weekly AT40 (T2108)

*All charts created using freestockcharts.com unless otherwise stated
The T2108 charts above are my LATEST updates independent of the date of this given AT40 post. For my latest AT40 post click here.
Related links:
The AT40 (T2108) Resource Page
You can follow real-time T2108 commentary on twitter using the #T2108 or #AT40 hashtags. T2108-related trades and other trades are occasionally posted on twitter using the #120trade hashtag.
Be careful out there!
Full disclosure: long CAT put, long ITB calls, long NFLX calendar put spread
*Charting notes: FreeStockCharts.com stock prices are not adjusted for dividends. TradingView.com charts for currencies use Tokyo time as the start of the forex trading day. FreeStockCharts.com currency charts are based on Eastern U.S. time to define the trading day.