
AT40 = 19.7% of stocks are trading above their respective 40-day moving averages (DMAs) (1st day oversold)
AT200 = 20.7% of stocks are trading above their respective 200DMAs (34-month low)
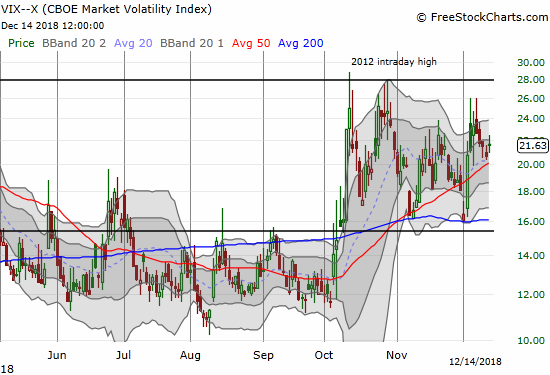
VIX = 21.6
Short-term Trading Call: cautiously bullish
Commentary
The stock market is oversold again as a bearish divergence to start the week came to its “logical conclusion.” AT40 (T2108), the percentage of stocks trading above their respective 40-day moving averages (DMAs), dropped to 19.7%, below the 20% threshold for oversold. By rule, I am supposed to switch my short-term trading call to bullish when the market goes oversold, but too much technical damage exists for me to switch off my “cautious” stance. For example, I am still actively hedging long positions even as I stay on alert for a sign to get fully bullish (short-term). I am anticipating a fresh spike in the volatility index, the VIX, as one of those signals.
AT200 (T2107), the percentage of stocks trading above their respective 200DMAs, dropped to a 34-month low showing confirmation of the deepening technical damage happening in the stock market. The longer the market stays stuck in this oversold period, the more bearish I become about whatever rally the market manages to enjoy after the oversold period ends. If the stock market somehow rallies 10% to close the year as one unrepentant bull claims, I will almost certainly look to enter 2019 aggressively short no matter how long this oversold period lasts.
Raging bull Tom Lee @fundstrat says investors should buy stocks hand-over-fist right now. He explains why stocks could rally 10% by year-end pic.twitter.com/QxeybRwHCD
— CNBC’s Fast Money (@CNBCFastMoney) December 14, 2018
The last oversold period ended in a surge on November 1st. Since then, the S&P 500 (SPY) has struggled mightily to regain upward momentum. For example, the index peaked after making just two more higher closes after that oversold period ended. The Federal Reserve helped mark the end of the rally. The index came short of that high after its last rally. That rally peaked in what is now an infamous post-G20 flourish that delivered more classic bear market action. That fake-out was underlined by the market’s refusal to respond when on Friday President Trump tweeted out a claim that the Chinese are eager and ready to make a trade deal. The end result was a 1.9% loss and a close just above the 2018 low.
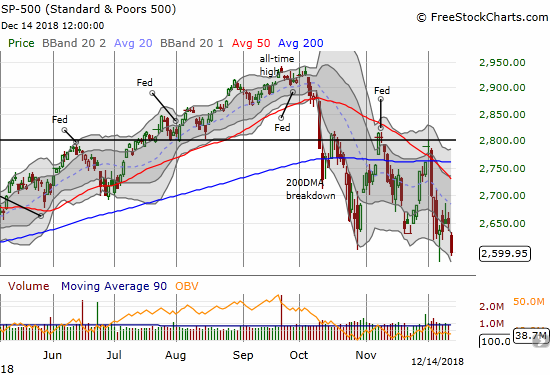
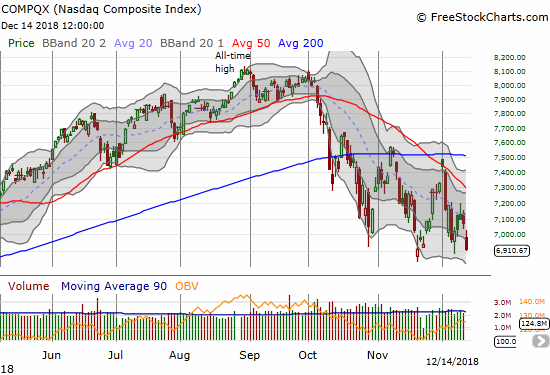
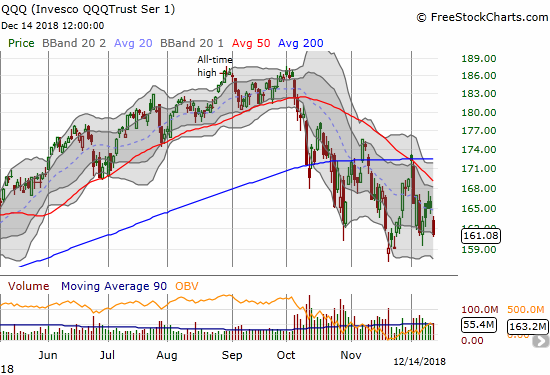
The NASDAQ and the Invesco QQQ Trust (QQQ) avoided breaking important lows…just barely. The NASDAQ closed right at its closing low from November. QQQ still has a little bit of cushion above its November closing low. That cushion is exactly why I rushed in to buy a put spread on QQQ as a fresh hedge on my long positions.
The volatility index, the VIX, surprised me with just a 4.8% gain. In fact, the VIX surprisingly declined the entire week even as the bearish mood intensified. I have to assume a delayed spike is on the way this week, perhaps pivoting around the Federal Reserve’s next decision on monetary policy on December 19th. If the VIX does not spike on Monday, I will look to go long volatility with a target of closing out the position, profit or not, just ahead of the Fed meeting.
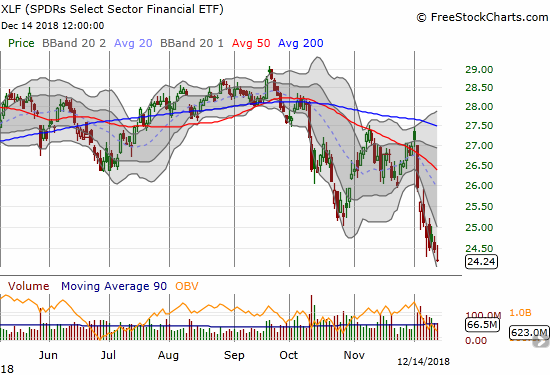
The leaky boat of financials sank further. The Financial Select Sector SPDR ETF (XLF) was actually up early in the day, but it faded sharply for a new 15-month low. This drag keeps tempering my upside expectations for market rallies.
The iShares Russell 2000 ETF (IWM) also closed at a new 15-month low. My attempt earlier in the week to play IWM for a rebound blew up in my face.

In a bull market, traders and investors do not care about risk, love buying dips no matter the news, and can even treat bad news as temporary setbacks that offer positive interpretations. That high-flying sentiment is a hazy memory. Now, bear market action dominates as negative headlines get sold quickly and sharply (see below for some examples), bad news is actually interpreted as bad news, and good news is treated as temporary relief and a fresh opportunity to unload inventory of stocks. Under these circumstances, a Federal Reserve meeting and yet another battle over a government shutdown look like yet more headwinds. Their resolution will have to form the core of a rebound if one comes soon.
Speaking of headwinds, here is a quick check-in on the mess that is Brexit. Brexit is one of several growing macro-economic issues that are keeping comfortable company with negative domestic sentiment.
CHART REVIEWS
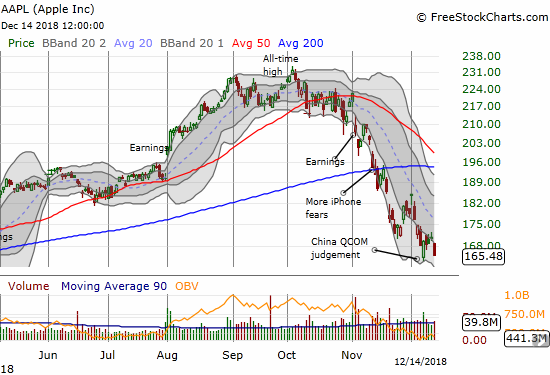
Apple (AAPL)
It seems like an eternity since AAPL was the bright light of a darkening market in October. Now, AAPL is one of the heaviest ankle weights around. The company’s stock buybacks are still not preventing deepening losses. I even traded a put spread last week in parallel to this coming week’s call option play.
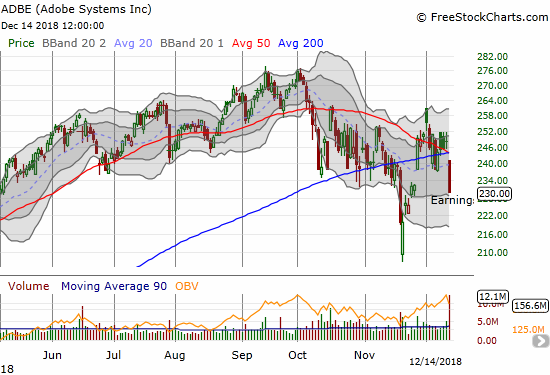
Adobe (ADBE)
ADBE rejoined the growing majority of stocks trading below their 200DMAs. A post-earnings plunge created what is likely now stiff resistance at a converged 50 and 200DMA. I bought a calendar put spread.
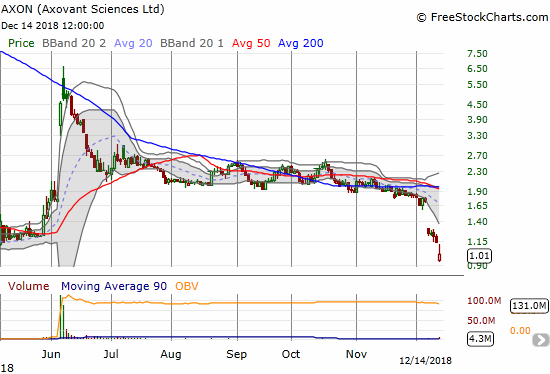
Axovant Sciences (AXON)
I should have left well enough alone. After profiting nicely from the quick pop in June, I decided to give AXON another try after it looked like the 50DMA held as support on a near gap fill. After a long slog through what I thought was a bullish consolidation, AXON completely fell apart last week. The selling started with poor phase 2 results and the end of clinical development of nelotanserin . Next, the company announced a share offering and priced those shares at $1.00 in what looks like a very desperate move to save the company. Now I am looking for that important $1 line in the sand to hold before acknowledging defeat.
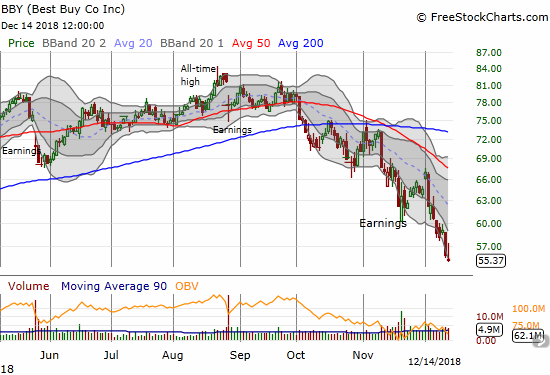
Best Buy (BBY)
BBY continues to put an exclamation point on the top in retail stocks. BBY closed at a 13-month low.
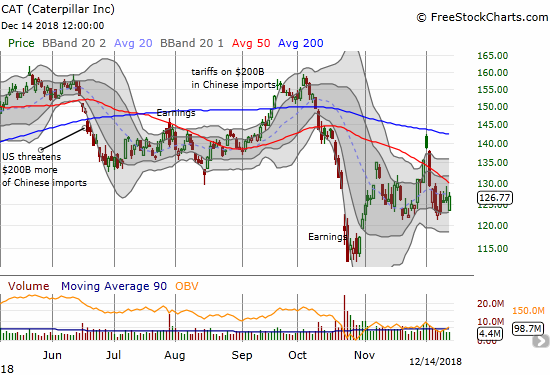
Caterpillar (CAT)
On a day of heavy selling, I was surprised to see CAT rebounding nicely enough off its intraday low for a positive monthly gain. The stock became an obvious target for puts as another hedge.
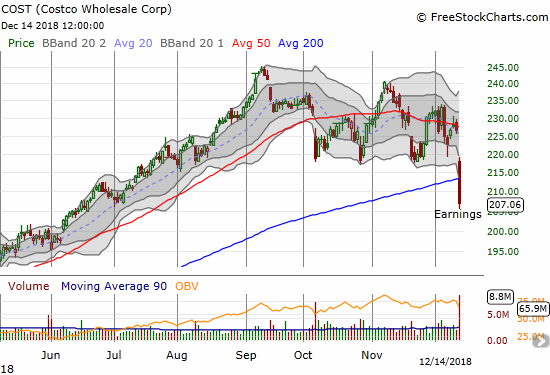
Costco (COST)
As if the top in retail needed any more confirmation, along comes COST to make sure. COST last closed below its 200DMA 13 months ago. Now COST is yet another stock on the wrong side of AT200.
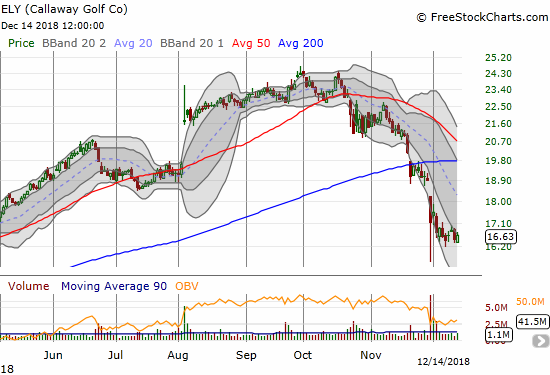
Callaway Golf Company (ELY)
ELY never maintained upward momentum as I had hoped. I took my remaining profits on Friday. It now looks like the upper bound of the lower Bollinger Band (BB) channel will serve as stiff resistance.
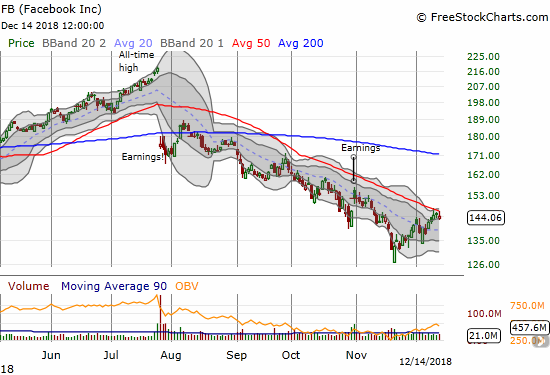
Facebook (FB)
FB moved contrary to the market last week, but 50DMA resistance still held firm. I still have my pre-earnings position in play and last week’s rally gave it some fresh life. Looking back, I wish of course I just took the profits when I had them!
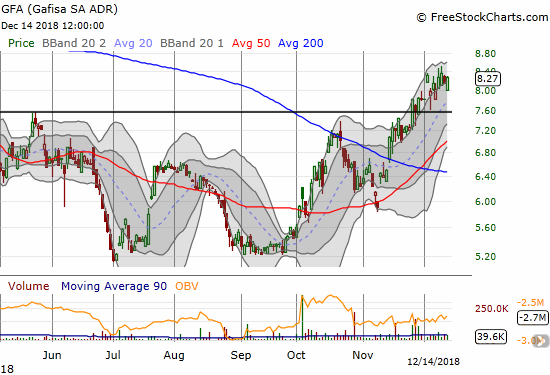
Gafisa S.A. (GFA)
At the time I pointed out the breakout in GFA, home builders and related stocks were displaying impressive strength. GFA is the lone survivor and clinging to its breakout. I still think the stock is in a bullish position.
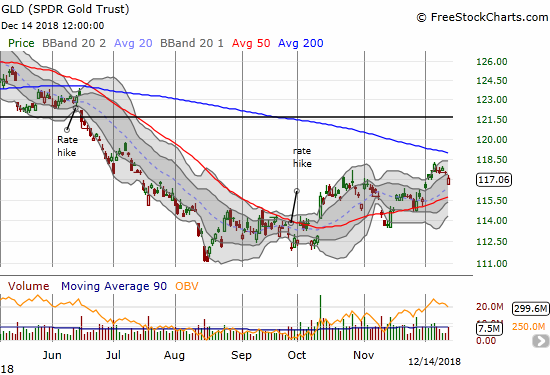
SPDR Gold Trust (GLD)
GLD is not performing as I expected; it did not even challenge downtrending 200DMA resistance before falling backward. I expect GLD to soar if the Fed capitulates as so many expect and hope.
Johnson & Johnson (JNJ)
JNJ denied the damaging Reuters report titled “Johnson & Johnson knew for decades that asbestos lurked in its Baby Powder“, but the market did not care. Bear market action dictates sell first and assess later. Buyers did well to hold onto 200DMA support!
Normally, I would look to play a bounce given the stock trades so far below its lower BB and important support levels await nearby from the October low and the 200DMA. Instead, I took advantage of the high premiums and opened a $130 put calendar spread with the short side expiring on Friday. The long side expiring the same day. I expect sellers to manage at least one more push lower. JNJ was treated as a safety stock and a shelter from market weakness; I doubt all the panic from this kind of shock can be shaken out in one day.

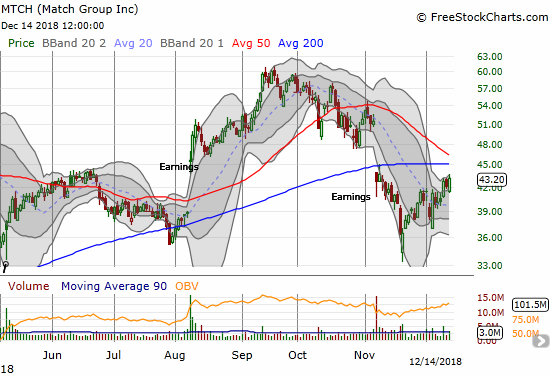
Match Group (MTCH)
MTCH started a post-earnings recovery in mid-November. I hopped aboard this month for a play to converging resistance from the 50 and 200DMAs. Almost there…
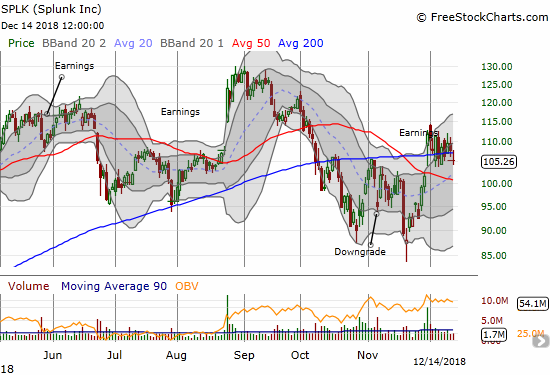
Splunk (SPLK)
I am getting increasingly interested in the relative hardiness of many cloud and “big data” stocks. SPLK experienced a sharp rebound from the November low and still had enough juice to deliver an impressive post-earnings gain. The stock has been stuck since then, but given the market sell-off things could be a LOT worse! I tried a call calendar spread over the past two weeks. After failing to take profits on a mid-week bounce, I watched helplessly as everything fell apart on Friday’s gap down. SPLK is at the top of my list for playing a bounce from oversold conditions.
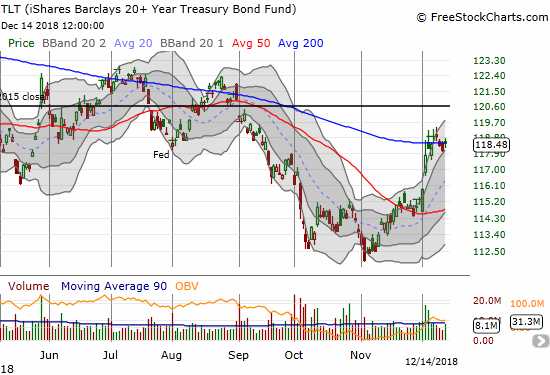
iShares 20+ Year Treasury Bond ETF (TLT)
I thought TLT would continue to rally all week given what I think is anticipation of a friendlier Fed this week. Instead, the market seems to be at maximum uncertainty here with TLT pivoting around its 200DMA all week.
Tesla (TSLA)
Until Friday’s drop, I thought TSLA might soar to $400 by the end of the coming week. TSLA’s resilience in the face of a bearish tape is still impressive. I see a yellow flag in the stock’s reluctance to deliver a convincing breakout above $380 resistance.

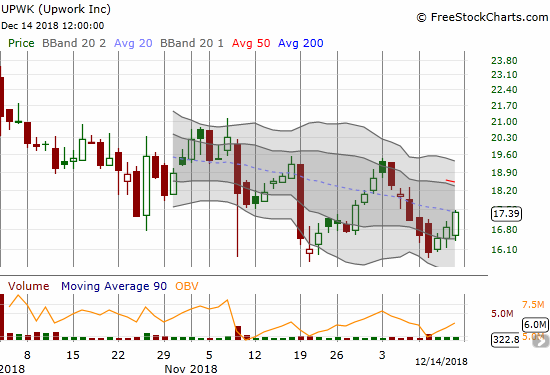
Upwork (UPWK)
I could be early, but it looks like UPWK is making a double-bottom…at least a bottom good enough for a swing trade back to the last peak.
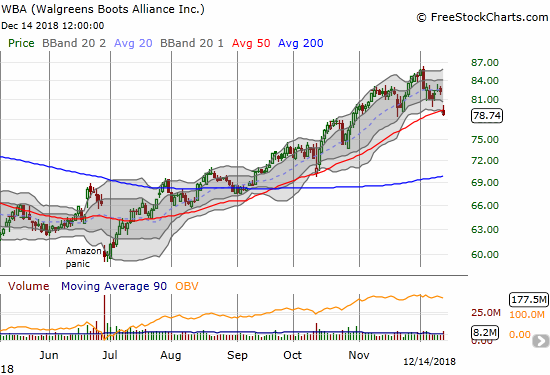
Walgreens Boots Alliance, Inc. (WBA)
On Friday, Goldman Sachs (GS) issued a scathing downgrade of WBA to a sell rating. In a bearish tape, the sellers readily obliged and even closed WBA below its 50DMA. It is very possible that the selling in JNJ weakened other “safety” stocks in the health care sector. Regardless, I am staying short (and recently doubled down) even if GS’s issues are not the same as my issues.
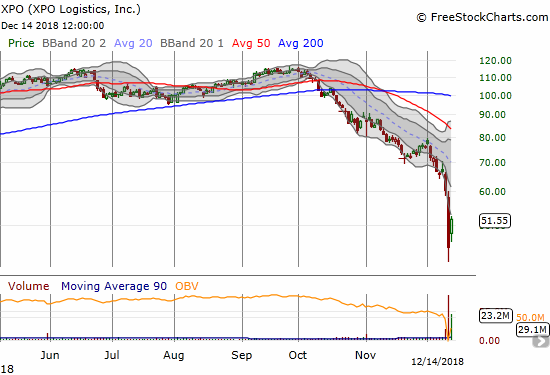
XPO Logistics (XPO)
Unlike the JNJ plunge, I looked at XPO’s plunge and instantly thought “buy.” XPO was taken down by a short-seller report. The company refuted each bearish point. XPO next announced a share repurchase plan of a whopping $1B. I want to be on the LONG side of this kind of firepower. I started buying early (the stock was down 13% and well below its lower BB at the time but continued to lose another 10 percentage points from there!).
— – —
FOLLOW Dr. Duru’s commentary on financial markets via email, StockTwits, Twitter, and even Instagram!
“Above the 40” uses the percentage of stocks trading above their respective 40-day moving averages (DMAs) to assess the technical health of the stock market and to identify extremes in market sentiment that are likely to reverse. Abbreviated as AT40, Above the 40 is an alternative label for “T2108” which was created by Worden. Learn more about T2108 on my T2108 Resource Page. AT200, or T2107, measures the percentage of stocks trading above their respective 200DMAs.
Active AT40 (T2108) periods: Day #1 over 20% (1st oversold day, ending 26 days over 20%), Day #6 under 30% (underperiod), Day #8 under 40%, Day #58 under 50%, Day #74 under 60%, Day #129 under 70% {corrected 1/6/19}
Daily AT40 (T2108)
")
Black line: AT40 (T2108) (% measured on the right)
Red line: Overbought threshold (70%); Blue line: Oversold threshold (20%)
Weekly AT40 (T2108)

*All charts created using freestockcharts.com unless otherwise stated
The T2108 charts above are my LATEST updates independent of the date of this given AT40 post. For my latest AT40 post click here.
Related links:
The AT40 (T2108) Resource Page
You can follow real-time T2108 commentary on twitter using the #T2108 or #AT40 hashtags. T2108-related trades and other trades are occasionally posted on twitter using the #120trade hashtag.
Be careful out there!
Full disclosure: long AAPL calls, long ADBE calendar put spread, long AXON, long CAT puts, long FB calls, long GFA, long GLD shares and calendar call spread, long IWM calls, long JNJ puts, long MTCH calls, short TSLA call spread, long UPWK, short WBA; long XPO shares, short call, long calendar call spread
*Charting notes: FreeStockCharts.com stock prices are not adjusted for dividends. TradingView.com charts for currencies use Tokyo time as the start of the forex trading day. FreeStockCharts.com currency charts are based on Eastern U.S. time to define the trading day.
This market is starting to scare the heck out of everybody. That’s good. And I’m sure all the negative action isn’t lost on the FED, either. Chances are we will be getting a rally in the coming weeks.
Having said that, I wouldn’t be buying stocks ‘hand over fist’ as Mr. Lee recommends, as one could well lose both the hand AND the fist. Nevertheless, I’m nibbling. For long term investors like myself, there appear to be some decent values at this point. Along with that, seasonality is in the bulls favor. But we could get more oversold before any positive relief occurs. That’s certainly happened before. Should it play out that way, I will take bigger nibbles, but in more conservative names.
Personally I would like to see the VIX up around 30 before feeling more confident about a decent rally. The more fear, the better.
I also would like to see a much higher VIX before being confident in a lasting bottom. I am still expecting an even bigger drawdown in January. THAT might be a good time to get aggressive.
I am about to write a piece explaining how I think a post-Fed rally could produce another classic head fake.