
AT40 = 85.0% of stocks are trading above their respective 40-day moving averages (DMAs) (14th overbought day)
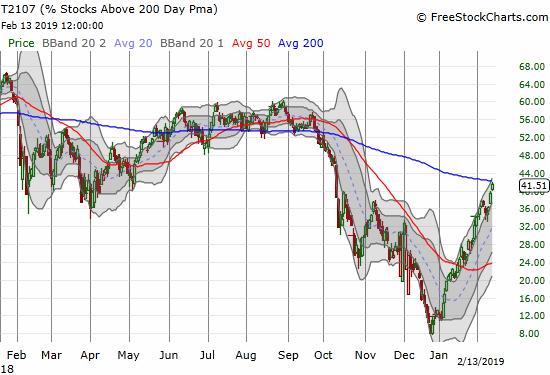
AT200 = 41.5% of stocks are trading above their respective 200DMAs (4-month high)
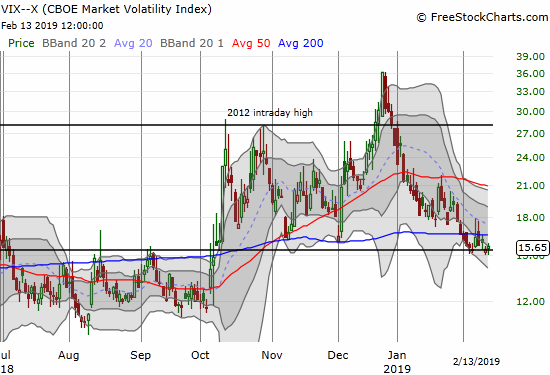
VIX = 15.7
Short-term Trading Call: neutral
Commentary
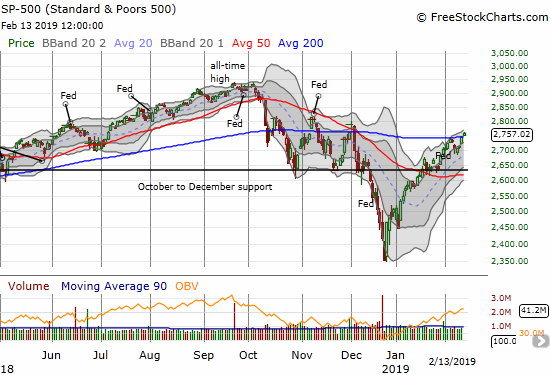
{Note some charts were saved right before final price updates. All chart descriptions reflect the actual close} The 200-day moving average (DMA) continues to provide “convenient resistance” to the trading action on the major indices even as more and more stocks are breaking out above their 200DMAs. Today’s trading action was all about tepid and tentative trading action as neither buyers or sellers managed to deliver a decisive move through 200DMAs on the major indices. The S&P 500 broke out above its 200DMA by a hair on Tuesday and today just barely held on to that tepid breakout.
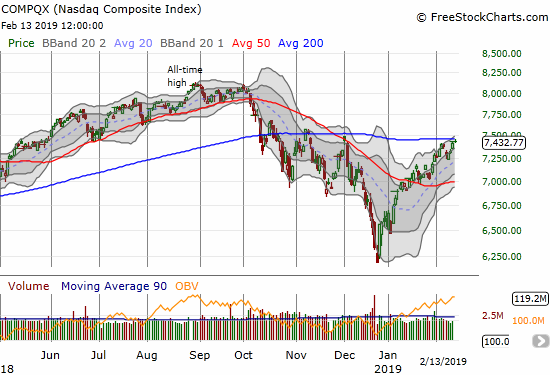
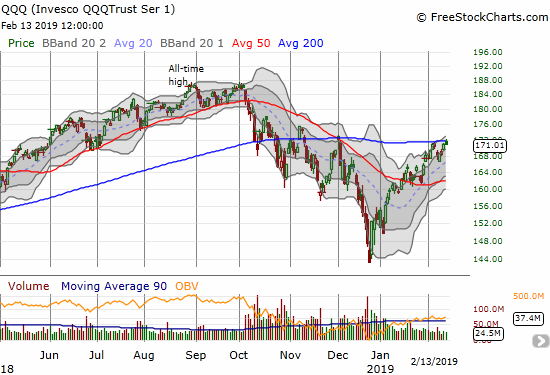
The NASDAQ managed the slightest of taps on its 200DMA resistance while the Invesco QQQ Trust (QQQ) actually slipped above its 200DMA resistance before sliding right back down.
Fittingly, AT200 (T2107), the percentage of stocks trading above their respective 200DMAs, rallied right to its own 200DMA. Unlike the other charts, AT200 still looks very strong in the middle of a rally that shows how the market is steadily trying to repair all the technical damage from the last three months of 2018.
AT40 (T2108), the percentage of stocks trading above their respective 40DMAs, is above 80% again. It closed at 85.0%, almost back to the last high that preceded the market’s one day pullback. This overbought periods is truly extended lasting 14 days and counting, well above the 9-day average and 4-day mean for overbought periods (AT40 above 70%).
The VIX is idling away awaiting a decisive move. The 15.35 pivot is acting like a magnet again.
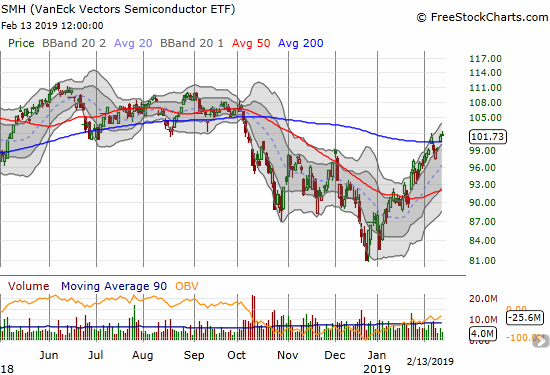
The Semiconductor Hldrs ETF (SMH) is still in focus. After breaking out above its 200DMA last week, SMH immediately reversed. SMH started the week with a gap down, but buyers have been roaring back ever since. The SMH is above its 200DMA once again.
The iShares US Home Construction ETF (ITB) is also playing games with its 200DMA. The home builder index is on the edge of a very bullish breakout. ITB’s 22.4% gain from the December lows returns the index to seasonal out-performance over the S&P 500 which is 17.1% off that low.
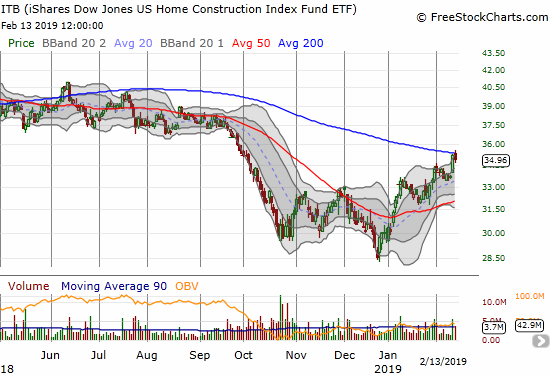
CHART REVIEWS
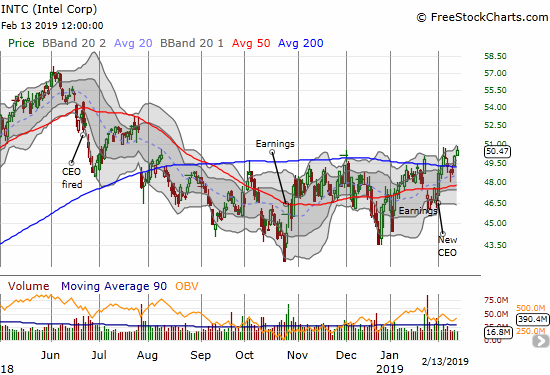
Intel (INTC)
INTC is benefiting from the resurgence in semiconductor stocks. I used this second lunge at the $51 level to take profits on my second tranche of “between earnings” call options.
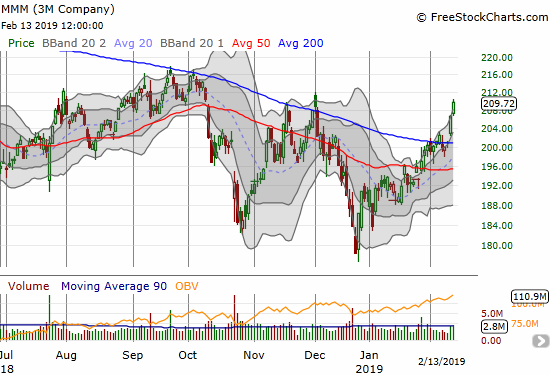
3M Company (MMM)
I thought MMM would stall out at its 200DMA. This week proved me wrong. Now the stock is in a very bullish position and is a buy on the dips. The stock is “another trade” away from finishing its repairs from the October breakdown.
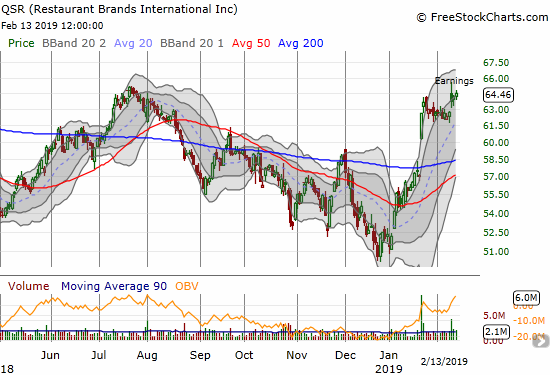
Restaurant Brands International (QSR)
QSR played a prominent role in my “chicken trade.” Now I am eyeing the stock for a fresh trade as investors took a liking to the cooking in the latest earnings report.
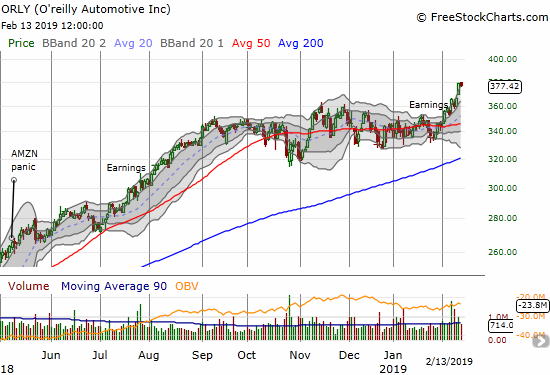
O’reilly Automotive (ORLY)
ORLY is off to the races again. In my last Above the 40 post I pegged ORLY for a post-earnings buy. So far it looks like a timely purchase.
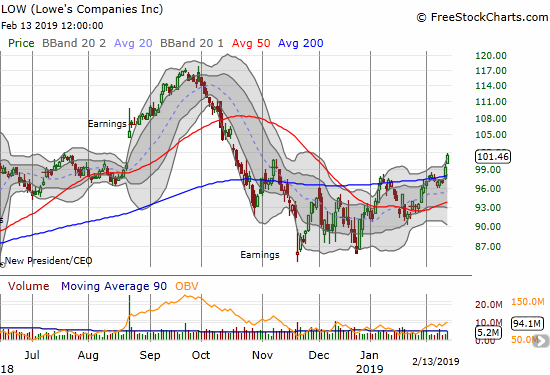
Lowe’s Company (LOW)
With home builders surging, I immediately looked at the home improvement retailers for potential trades. LOW surged through its 200DA on Tuesday and confirmed the breakout on today’s 2.0% gain. On Tuesday I bought a first tranche of call options expiring next Friday at the $101 strike. I am of course now under the clock to take profits and will not likely carry these into next week. Regardless, LOW is another buy on the dips with this bullish move.
— – —
FOLLOW Dr. Duru’s commentary on financial markets via email, StockTwits, Twitter, and even Instagram!
“Above the 40” uses the percentage of stocks trading above their respective 40-day moving averages (DMAs) to assess the technical health of the stock market and to identify extremes in market sentiment that are likely to reverse. Abbreviated as AT40, Above the 40 is an alternative label for “T2108” which was created by Worden. Learn more about T2108 on my T2108 Resource Page. AT200, or T2107, measures the percentage of stocks trading above their respective 200DMAs.
Active AT40 (T2108) periods: Day #28 over 20%, Day #26 over 30%, Day #25 over 40%, Day #24 over 50%, Day #20 over 60%, Day #14 over 70%, Day #3 over 80%
Daily AT40 (T2108)
")
Black line: AT40 (T2108) (% measured on the right)
Red line: Overbought threshold (70%); Blue line: Oversold threshold (20%)
Weekly AT40 (T2108)

*All charts created using freestockcharts.com unless otherwise stated
The T2108 charts above are my LATEST updates independent of the date of this given AT40 post. For my latest AT40 post click here.
Related links:
The AT40 (T2108) Resource Page
You can follow real-time T2108 commentary on twitter using the #T2108 or #AT40 hashtags. T2108-related trades and other trades are occasionally posted on twitter using the #120trade hashtag.
Be careful out there!
Full disclosure: long UVXY calls, long ITB calls, long ORLY, long LOW calls
*Charting notes: FreeStockCharts.com stock prices are not adjusted for dividends. TradingView.com charts for currencies use Tokyo time as the start of the forex trading day. FreeStockCharts.com currency charts are based on Eastern U.S. time to define the trading day.