

The Market Breadth Summary
- Tech stocks kept winning as AI-related shares rallied, while weakening market breadth exposed continued deterioration beneath the headline indices.
- The S&P 500 and Nasdaq recovered from post-Fed weakness, but small-cap stocks remained under pressure as bond yields climbed and rate-sensitive shares sold off.
- Meta Platforms, AMD, Intel, and Arm led AI-related strength, while Airbnb, Expedia, Yelp, and other rate-sensitive or consumer-facing stocks struggled.
The Stock Market Summary
High tech stocks keep winning as AI leadership carries the sector and the headline indices, but market breadth keeps failing including a steep downtrend all month.
In the prior week, the AI trade hit a short speed bump on AI safety concerns, but last week’s rally confirmed the market’s complete amnesia over AI safety. The excitement started with news about the surging app downloads for Meta Platform’s agentic consumer app called Muse. The rapid adoption suggested an incremental jump in future AI compute needs. Accordingly, semiconductor and other AI-related stocks rallied. In parallel, higher bond yields continued to pressure consumer-facing and other rate sensitive stocks. Bond yields surged in the final three days of the week, partially thanks to a strong economic data, and the 10-year Treasury yield reached levels not seen since 2007, just before the Great Financial Crisi erupted. The resulting bearish divergence between the S&P 500 and market breadth leaves me wary and cautious about the technical health of the stock market.
S&P 500 (SPY)
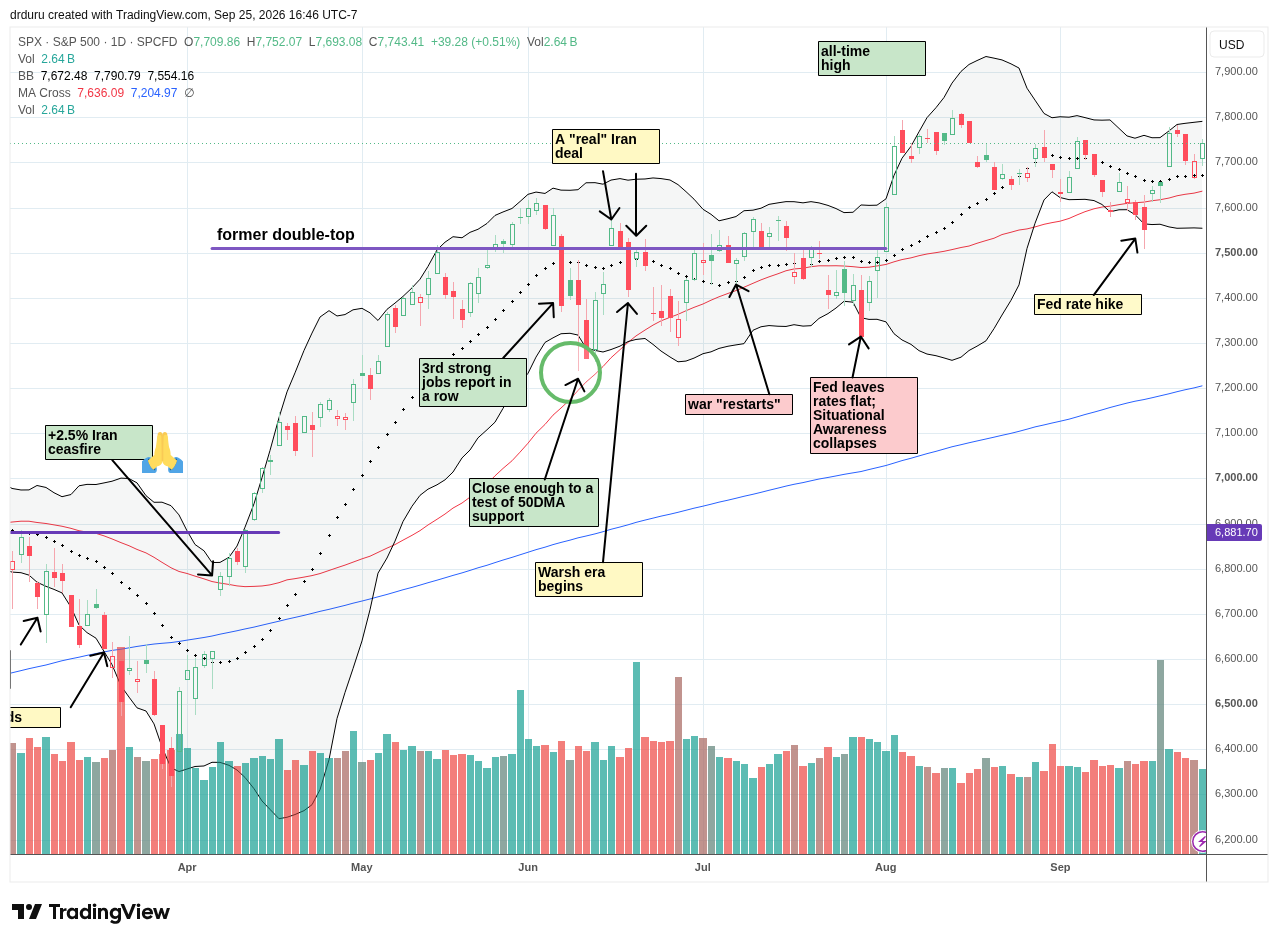
The S&P 500 (SPY) has gone nowhere for two and a half months, allowing the 50-day moving average (DMA) (red line) to converge with the 20DMA (dashed line). This convergence sets up a technical test of dominance: will the downtrending 20DMA dominate direction or will the uptrending 50DMA do so? The quick and definitive recovery from the post-Fed 50DMA breakdown suggests the pricing dynamics favor short-term upside over downside.
NASDAQ (COMPQ)
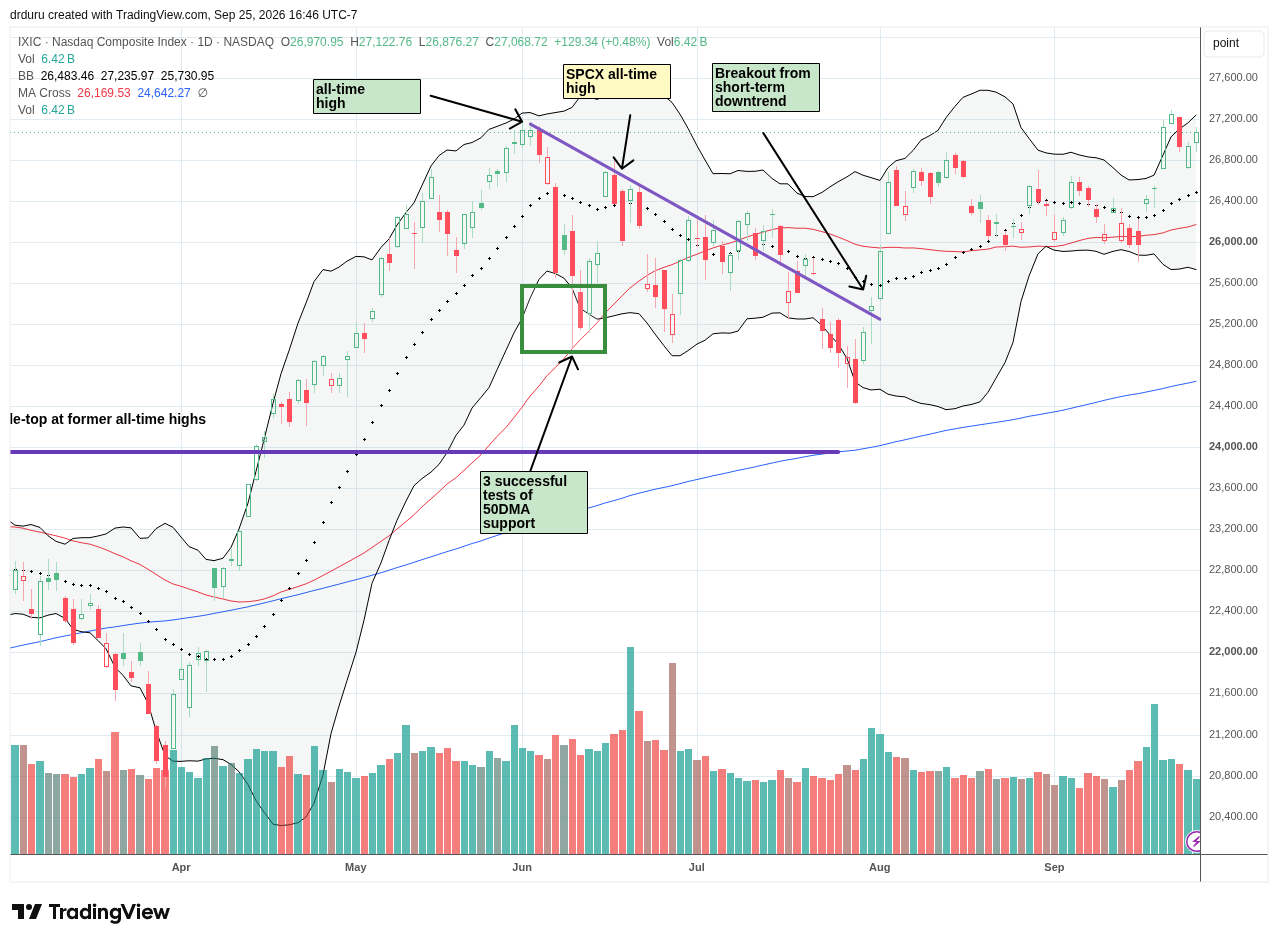
The NASDAQ (COMPQ) has gone nowhere for over 4 months, resulting in a flattened 50DMA. Thus, the tech-laden index is trendless. The repeated, successful defenses of 50DMA support generate a greater likelihood of a short-term upside breakout over a breakdown. Until an upside or downside resolution, the NASDAQ offers little of interest to trade (in aggregate). AI-related stocks contributed to the NASDAQ’s two-day post-Fed recovery.
iShares Russell 2000 ETF (IWM)
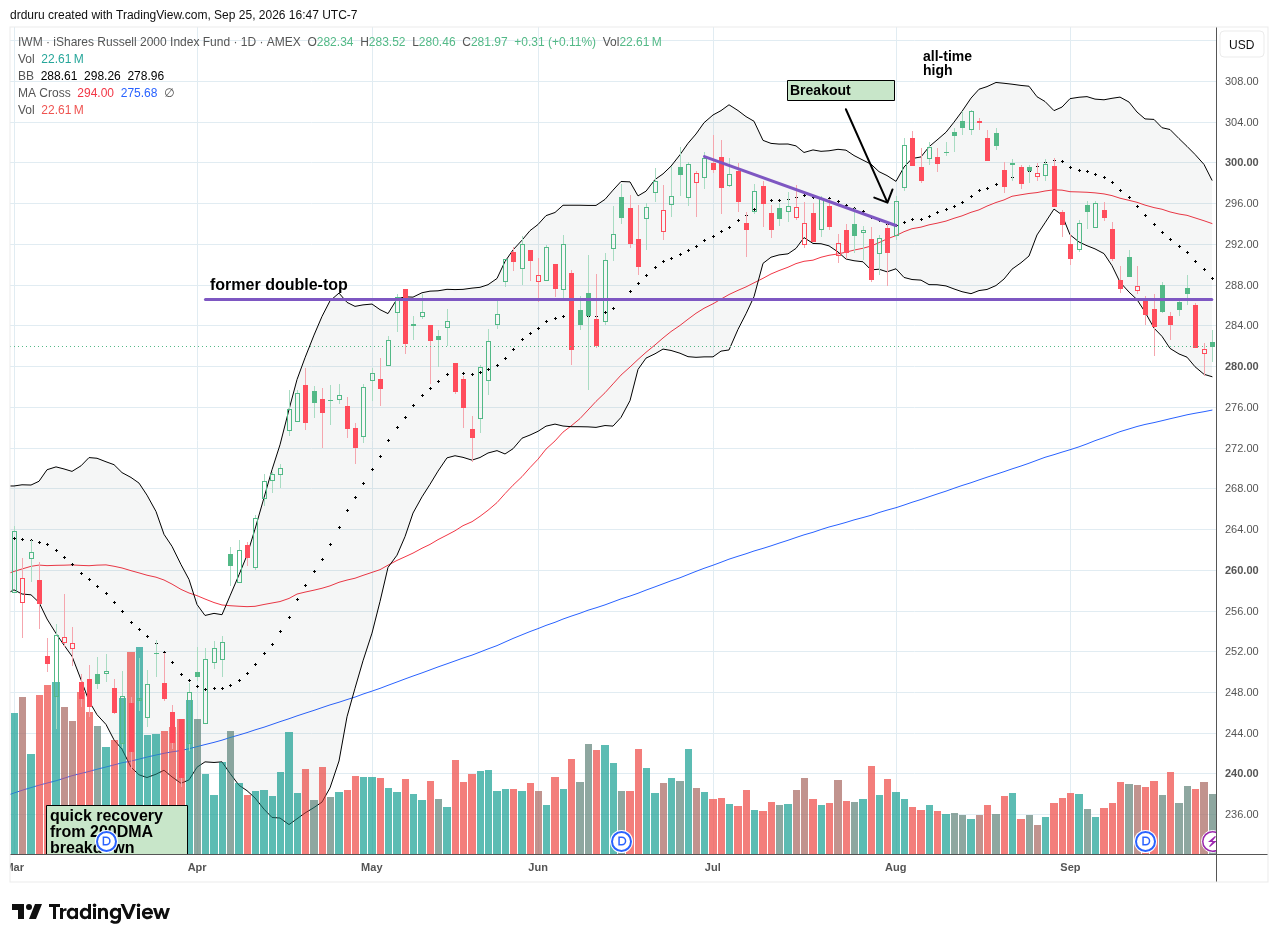
The iShares Russell 2000 ETF (IWM) continued its downtrend from August’s all-time high. The ETF of small caps got punished on Wednesday’s rate hike. With IWM trading well below its lower Bollinger Band (BB), I reflexively bought call options. Yet, I failed to take profits on Thursday’s gap open higher. By Friday, I was adding to my position at much lower prices as a speculative trade on a fresh rebound. However, I only see the potential for relief for IWM if oil prices abruptly come down and bond yields similarly come down in parallel. Otherwise, I expect IWM to continue its downtrend with a test of 200DMA (the blue line) support in sight.
The Short-Term Trading Call With Winning vs Failing
- AT50 (MMFI) = 30.2% of stocks are trading above their respective 50-day moving averages
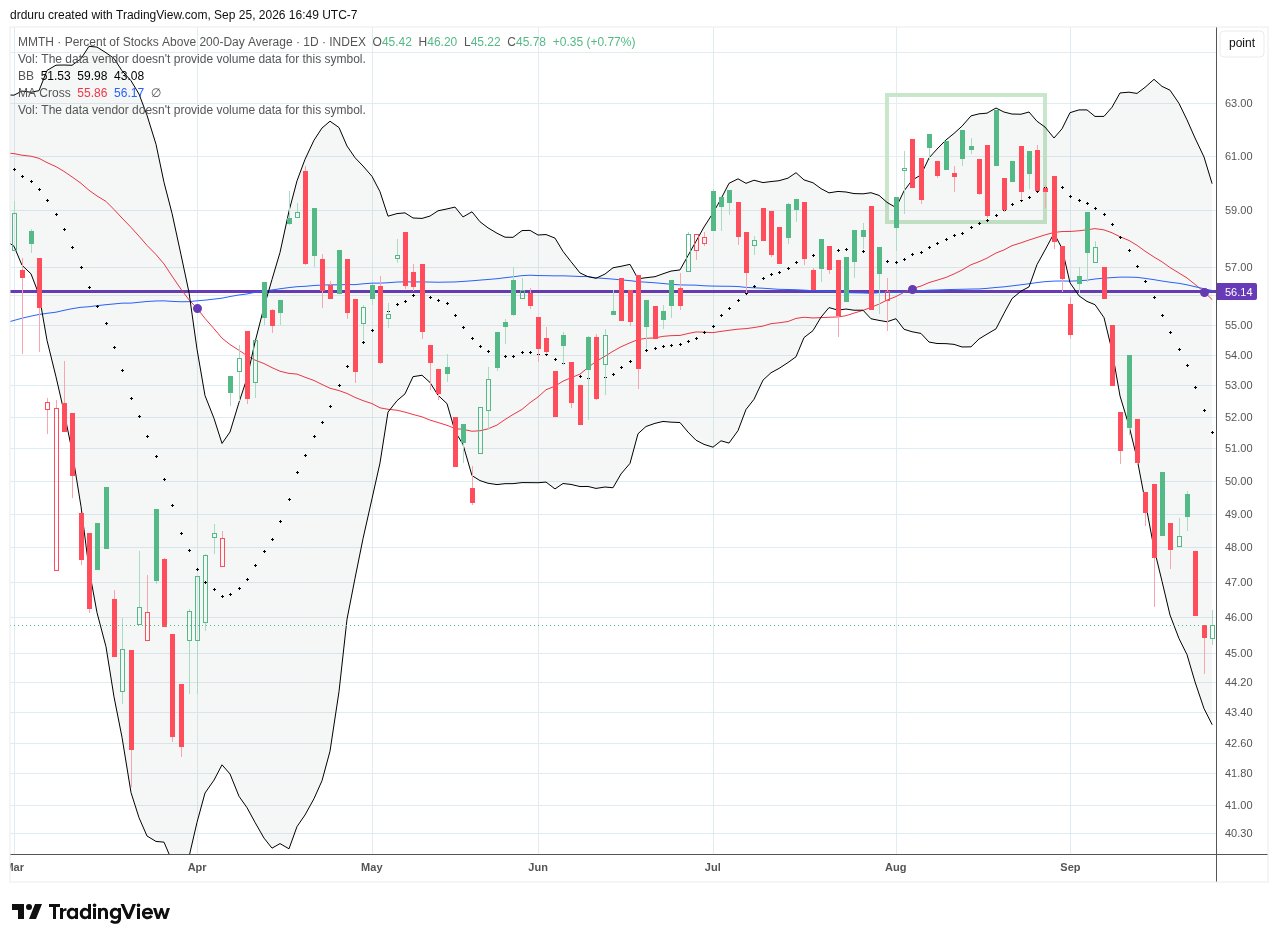
- AT200 (MMTH) = 45.8% of stocks are trading above their respective 200-day moving averages
- Short-term Trading Call: neutral
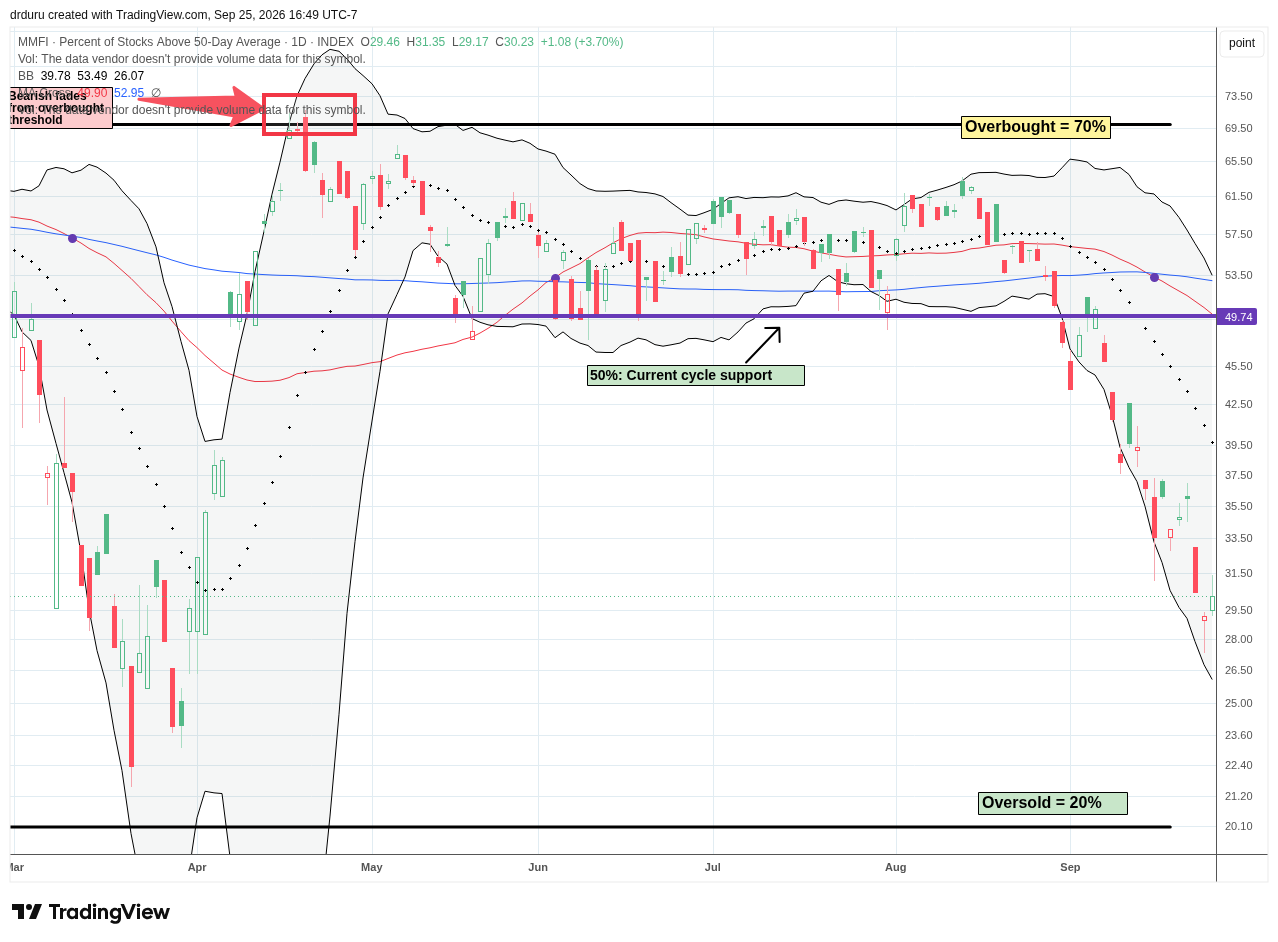
AT50 (MMFI), the percentage of stocks trading above their respective 50DMAs, closed the week at 30.2%. The chart below says it all. The underlying health of the stock market has persistently deteriorated since its mid-August breakout. At that time, IWM was enjoying a series of all-time highs, and I anticipated ongoing momentum taking my favorite technical indicator to the overbought threshold. Instead, one headwind after another slowly dragged down small-caps and other rate-sensitive stocks. The Fed rate hike sealed the deal.
My short-term trading call stays at neutral while I am on alert for a signal to flip bullish. AT50 is on pace to hit oversold levels in the next two weeks, an event that would trigger my AT50 trading rules. Note that AT50 was last oversold during the tariff drama in April, 2025, so AT50’s visit last week to 30% could be the kind of “oversold enough” that happens during strong bull markets. AT50 turned out to be oversold enough at the end of March and the early weeks of the Iran war.
AT200, the percentage of stocks trading above their respective 200DMAs, has accompanied AT50 on a sharp decline for the month of September. The move further confirms the underlying poor health of the stock market.
The volatility index (VIX) continues to meander above its lows for the year. I see very little signal in the VIX except this ongoing complacency makes me doubt the stock market will experience a strong rally from current levels. A series of lower peaks since March’s high makes me expect the next negative catalyst to have a very short lifespan….consistent with a brief oversold period.
In Case You Missed It…
Last week’s breakout for QQQ provided a classic example of an old Wall Street adage cautioning traders to avoid shorting a quiet market. The price consolidation in Microsoft (MSFT) provided another example with the stock jumping 3.7% on Friday in the wake of positive product news.
The Equities
Meta Platforms (META)
Description: Meta Platforms operates Facebook, Instagram, WhatsApp and other digital platforms while developing artificial intelligence, advertising technology and augmented- and virtual-reality hardware.
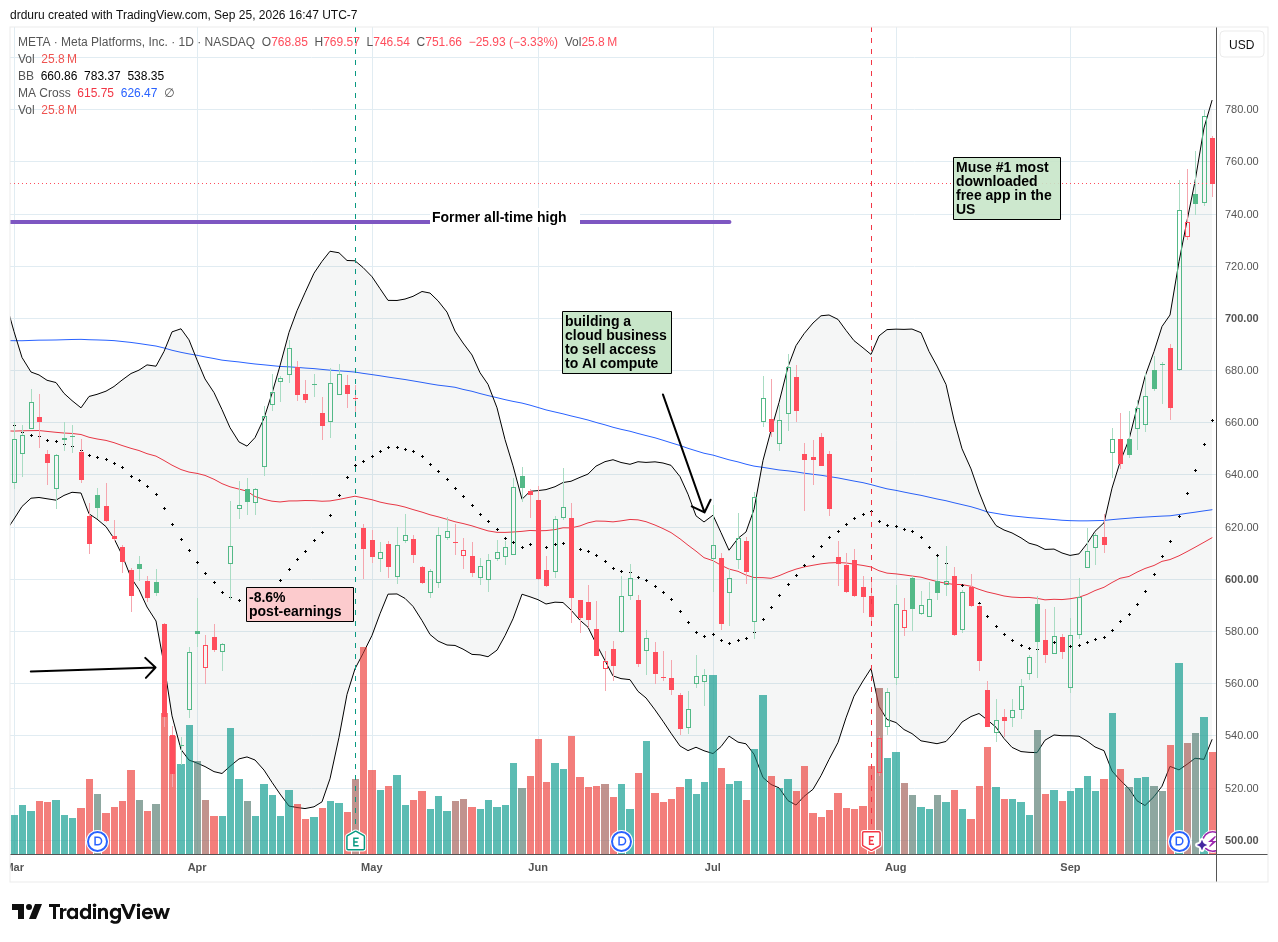
Technical Status: The reported success of Muse drove Meta Platforms (META) to a winning week that created tailwinds throughout tech, especially AI. Monday’s 11.3% surge helped push META to a 52-week high and close to its all-time high.
Trade Commentary: META led the week’s winning for tech stocks. The news about Muse’s success is important for the AI trade because of the assumption that these kinds of products will increase AI compute for inference. The sentiment shift rapidly cascaded through AI-related stocks, with semiconductor stocks among the biggest winners.
At Connect on Wednesday, Meta expanded the story by bringing Muse to its AI-glasses lineup and unveiling additional AI and VR hardware. META is riding a barrage of positive news flow. The skeptic in me is waiting for the hype to fade in coming months, especially once competing products enter the market.
Advanced Micro Devices Inc (AMD)
Description: Advanced Micro Devices designs CPUs, GPUs, AI accelerators and other semiconductor products for data centers, PCs, gaming and embedded computing.
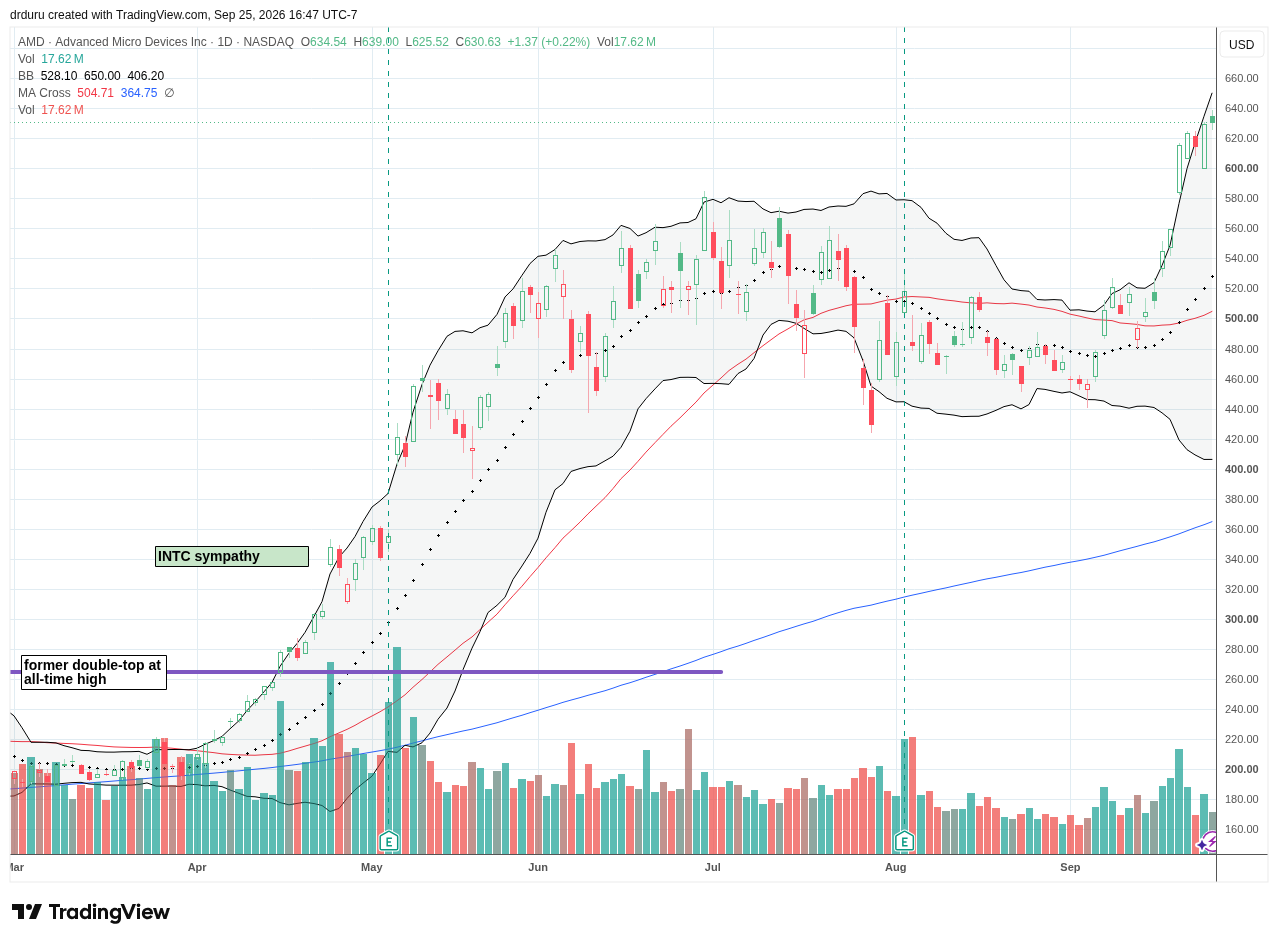
Technical Status: Advanced Micro Devices (AMD) surged 10.0% to start the week to lead the winning for tech stocks, with 4 of 5 trading days closing at all-time highs.
Trade Commentary: AMD was one of the main beneficiaries of the Muse-driven rush into the AI trade. I do not know why AMD benefited in such an outsized amount, but the prior week’s sharp move along the upper Bollinger Band set up breakout-quality tension. The fresh all-time highs and $1+ trillion market cap (re)establish AMD as a leader for the AI trade.
Intel Corporation (INTC)
Description: Intel designs and manufactures processors and other semiconductors while also operating a foundry business that manufactures chips for outside customers.
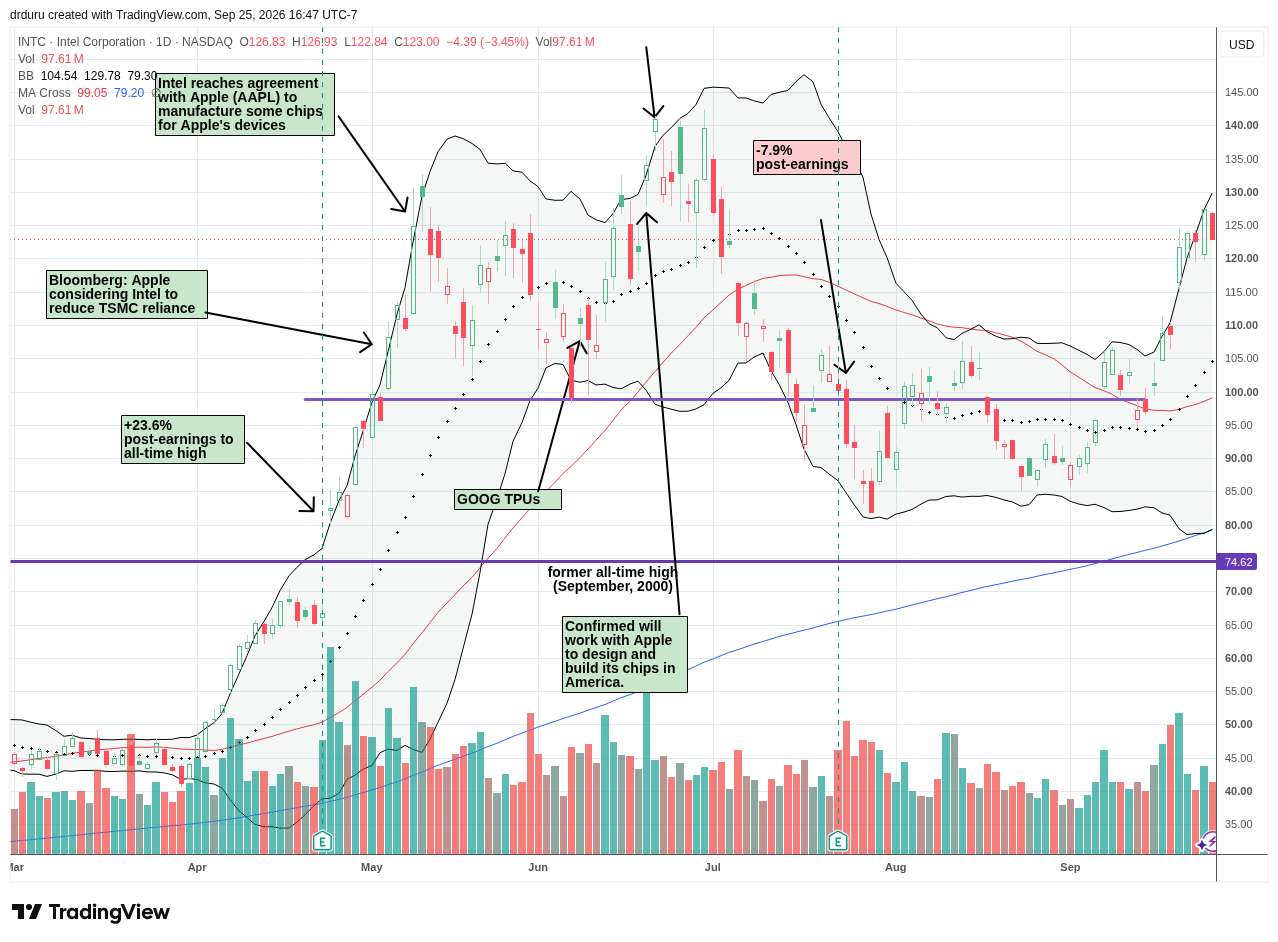
Technical Status: Intel Corporation (INTC) joined the winning for tech stocks with a 12.1% surge to start the week. The new momentum puts all-time highs in play.
Trade Commentary: INTC surged more than 12% Monday as enthusiasm around AI agents revived expectations for CPU and server demand. I have been a lot more vigilant about trading INTC since July earnings, but I did not have anything in place to take advantage of INTC’s initial surge. I rushed into a weekly calendar call spread at the $135 strike, and that position was taken out at its initial profit target on Thursday’s 3.9% gain. On Friday’s pullback, I jumped back into a new weekly calendar call spread, this time at the $140 strike.
Arm Holdings (ARM)
Description: Arm Holdings develops and licenses processor architectures and semiconductor intellectual property used by chipmakers across mobile, data-center, automotive and embedded markets.
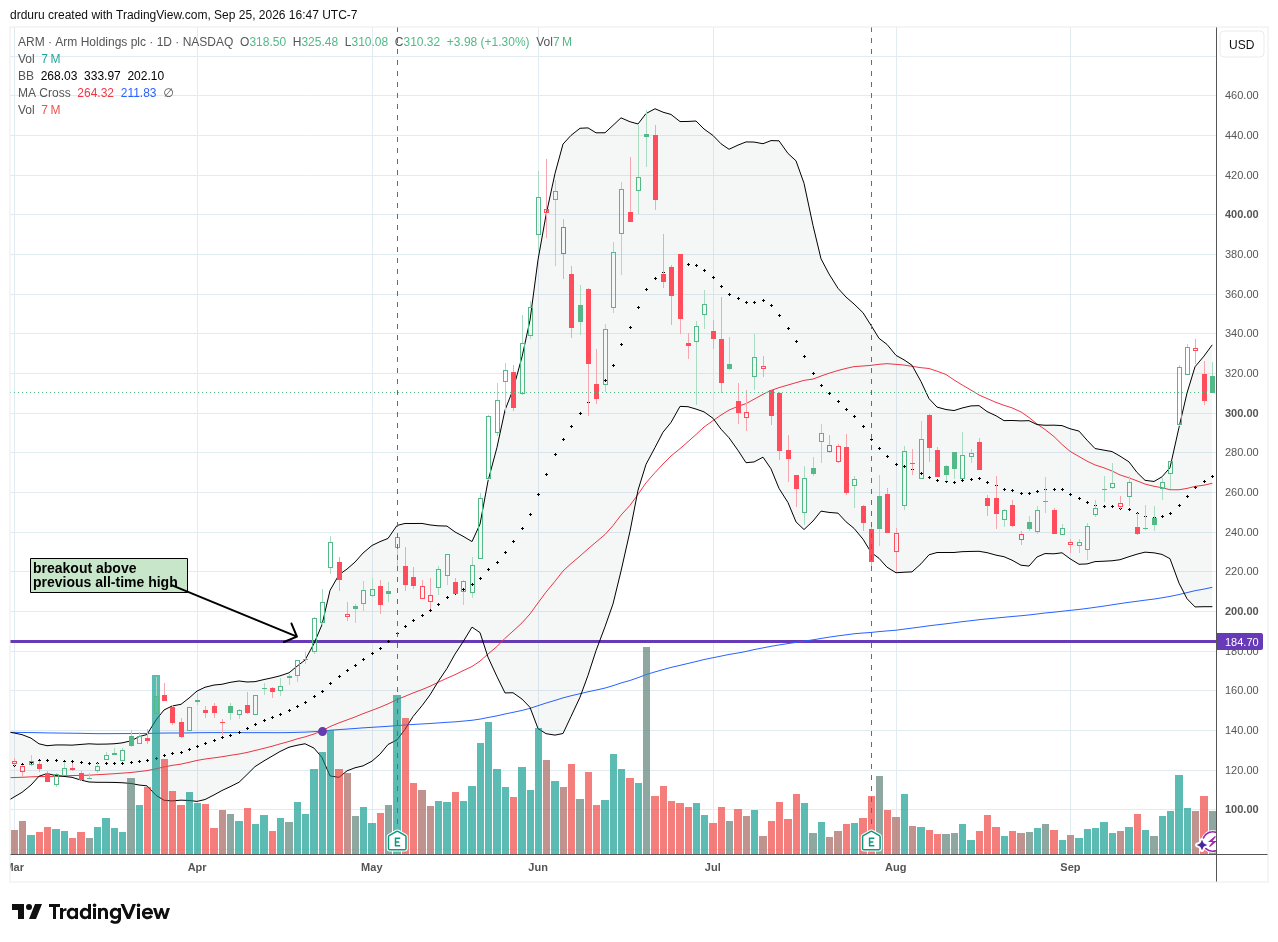
Technical Status: Arm Holdings (ARM) rode the winning for tech stocks to a definitive confirmation of a 50DMA breakout. The 17.2% surge to start the week stretched ARM above its upper Bollinger Band.
Trade Commentary: ARM outdid AMD with its Monday surge. However, ARM was unable to hold its highs of the week. I am looking for a pullback to Monday’s open to start considering a buy. A drop to $280 would completely reverse the gap up and make me even more interested in buying given the nearby converged support from the 20DMA and 50DMA.
Micron Technology (MU)
Description: Micron Technology manufactures memory and storage semiconductors including DRAM, NAND and high-bandwidth memory used in data centers, PCs, mobile devices and AI systems.
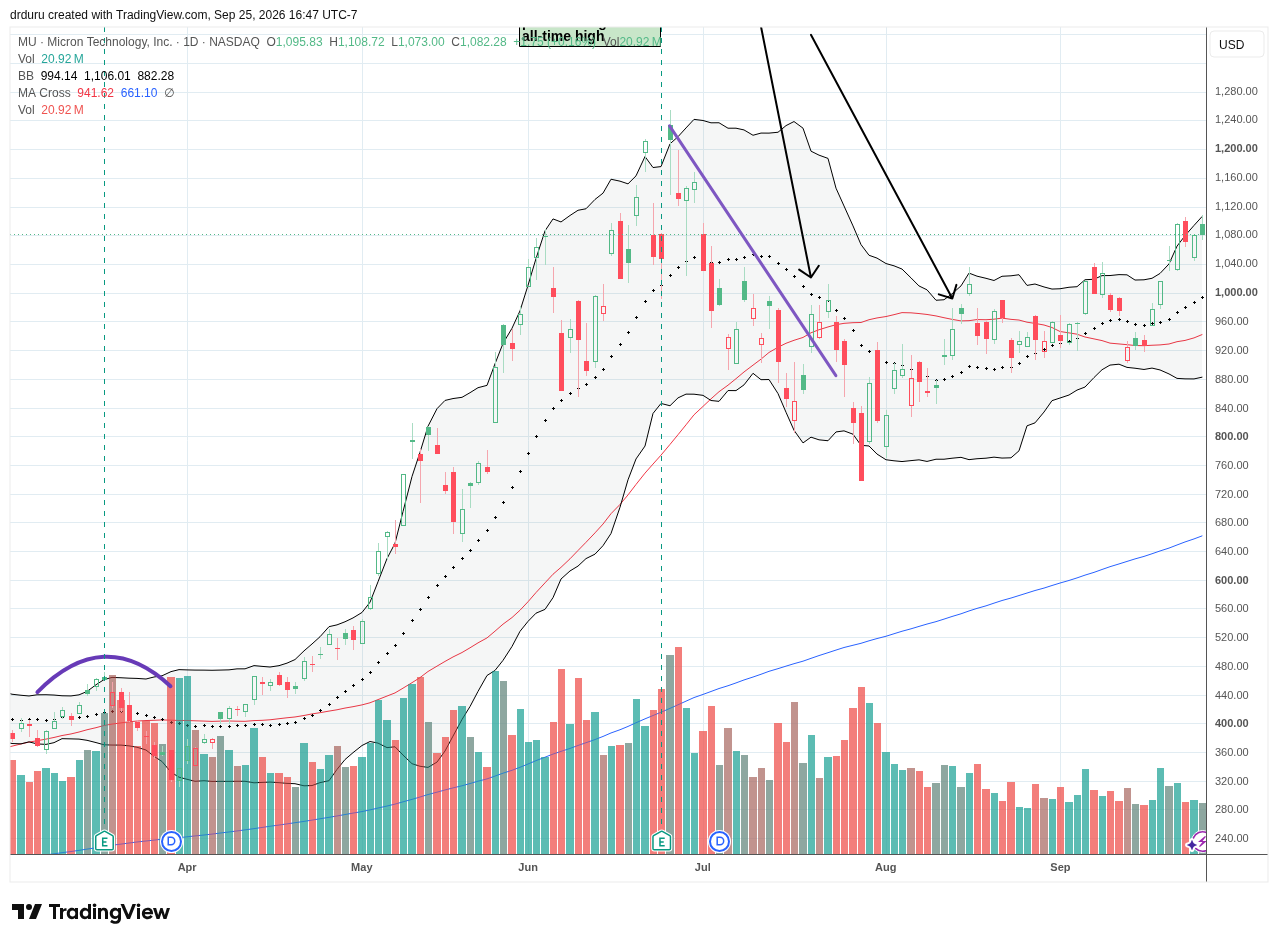
Technical Status: Micron Technology (MU) started the week with a 5.0% jump to a near 3-month high but churned the rest of the week.
Trade Commentary: MU actually lagged other semiconductor stocks on Monday’s Muse-driven rally. Still, the breakout and renewed momentum were enough to push the stock into my $1100 price target where my trading position closed out. With earnings coming this week, I am content to return to the sidelines. While I expect another strong earnings report, I do not want to bet on the market’s reaction to the earnings report.
Coinbase Global (COIN)
Description: Coinbase Global operates a cryptocurrency trading, custody and financial-infrastructure platform serving retail customers, institutions and developers.
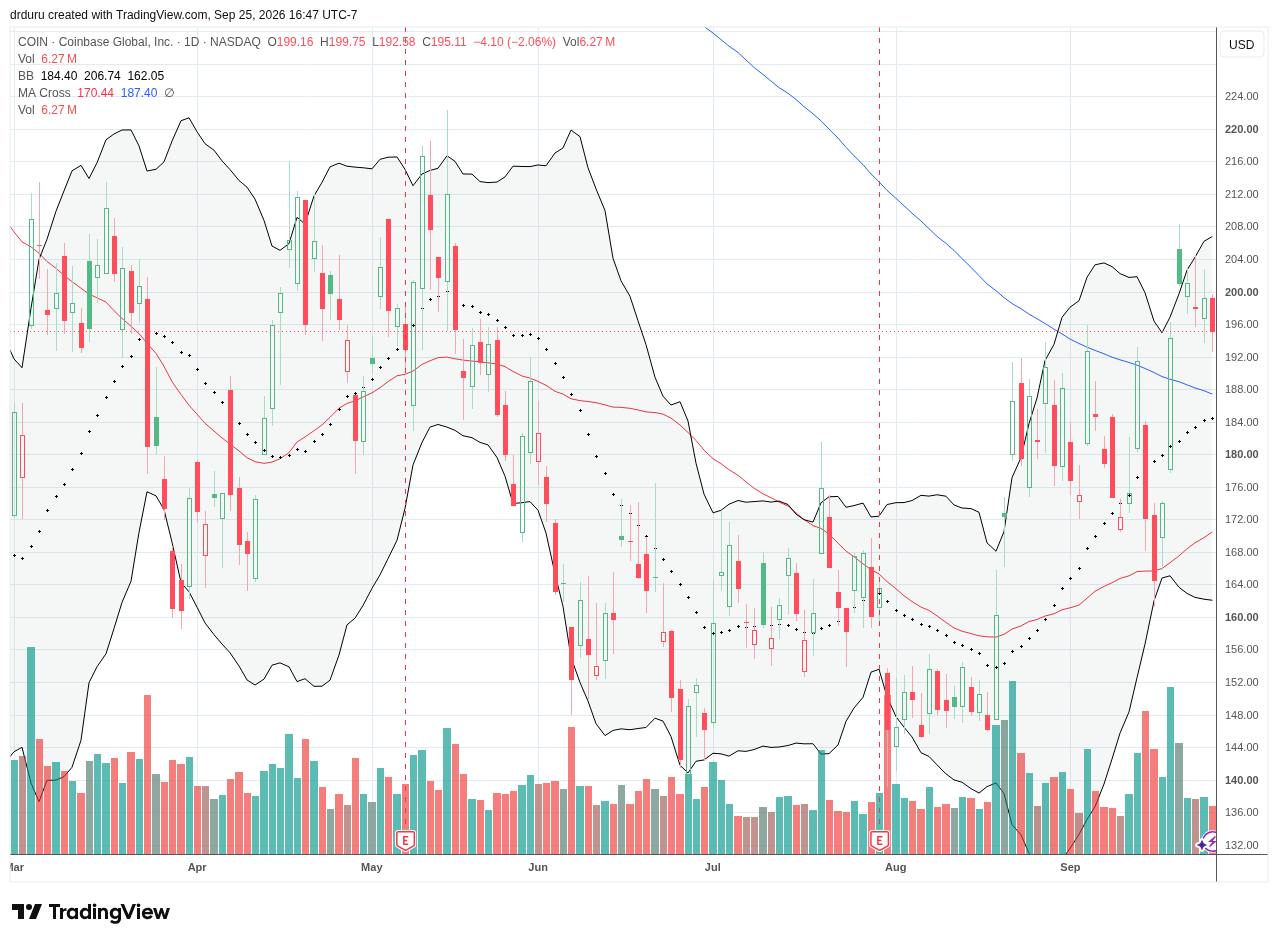
Technical Status: Coinbase Global (COIN) confirmed a 200DMA breakout on renewed momentum for cryptocurrencies.
Trade Commentary: COIN joined Monday’s tech rally as Bitcoin surged above $86,000. The company also announced that eligible U.S. customers can request allocations in IPOs directly through Coinbase, starting with Oura, pushing the platform further into traditional brokerage territory. While Monday’s gap higher and 3.5% gain did not survive the rest of the week, I have COIN on my buy list given the confirmed 200DMA breakout. Note well that COIN traded to the top of a trading range that has been in place for most of the year. A breakout could unleash significant pent-up buying interest.
Airbnb Inc (ABNB)
Description: Airbnb operates a global online marketplace connecting travelers with short-term accommodations, experiences and related travel services offered by hosts.
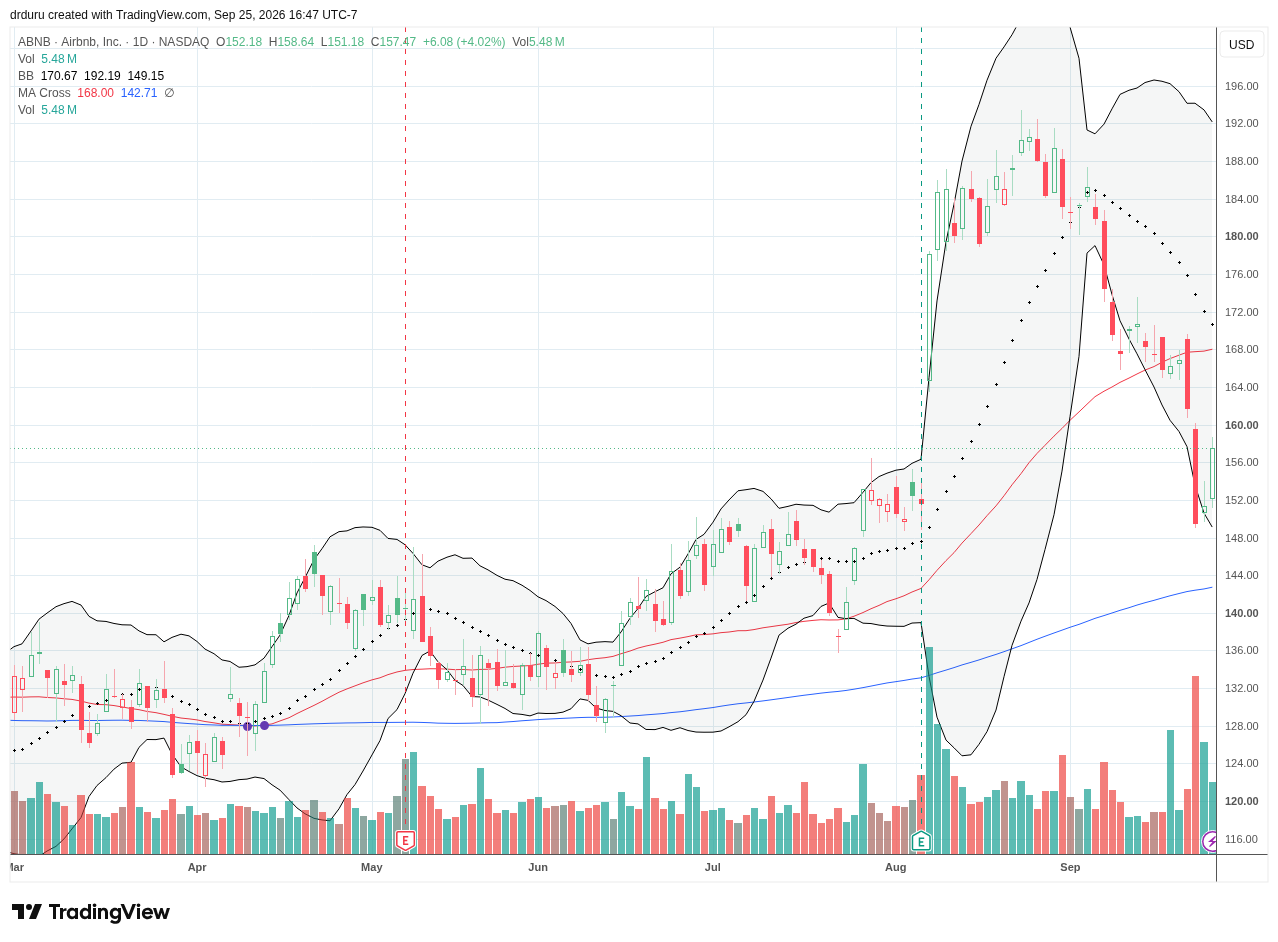
Technical Status: Airbnb (ABNB) finished reversing its August post-earnings surge as Muse’s success pressured the stock.
Trade Commentary: ABNB sat on the failing side of the Muse-driven excitement. The panic unfolded with a time delay. ABNB actually gained fractionally on Monday but dropped 3.0% on Tuesday. Sellers followed up on Wednesday delivering a 7.6% loss. I bought ABNB the previous week at 50DMA support. I am looking to add more shares this week. While I do not think the Muse-driven selling is as panicked as the AI-driven panic in software stocks, I still consider this pullback to be an opportunity because Muse may simply help more people book more ABNB properties. I can see a scenario where agentic shopping makes comparison-shopping easier than ever and drives pricing down across booking platforms.
Expedia Group (EXPE)
Description: Expedia Group operates online travel platforms that connect consumers and businesses with lodging, flights, vacation rentals and other travel products.
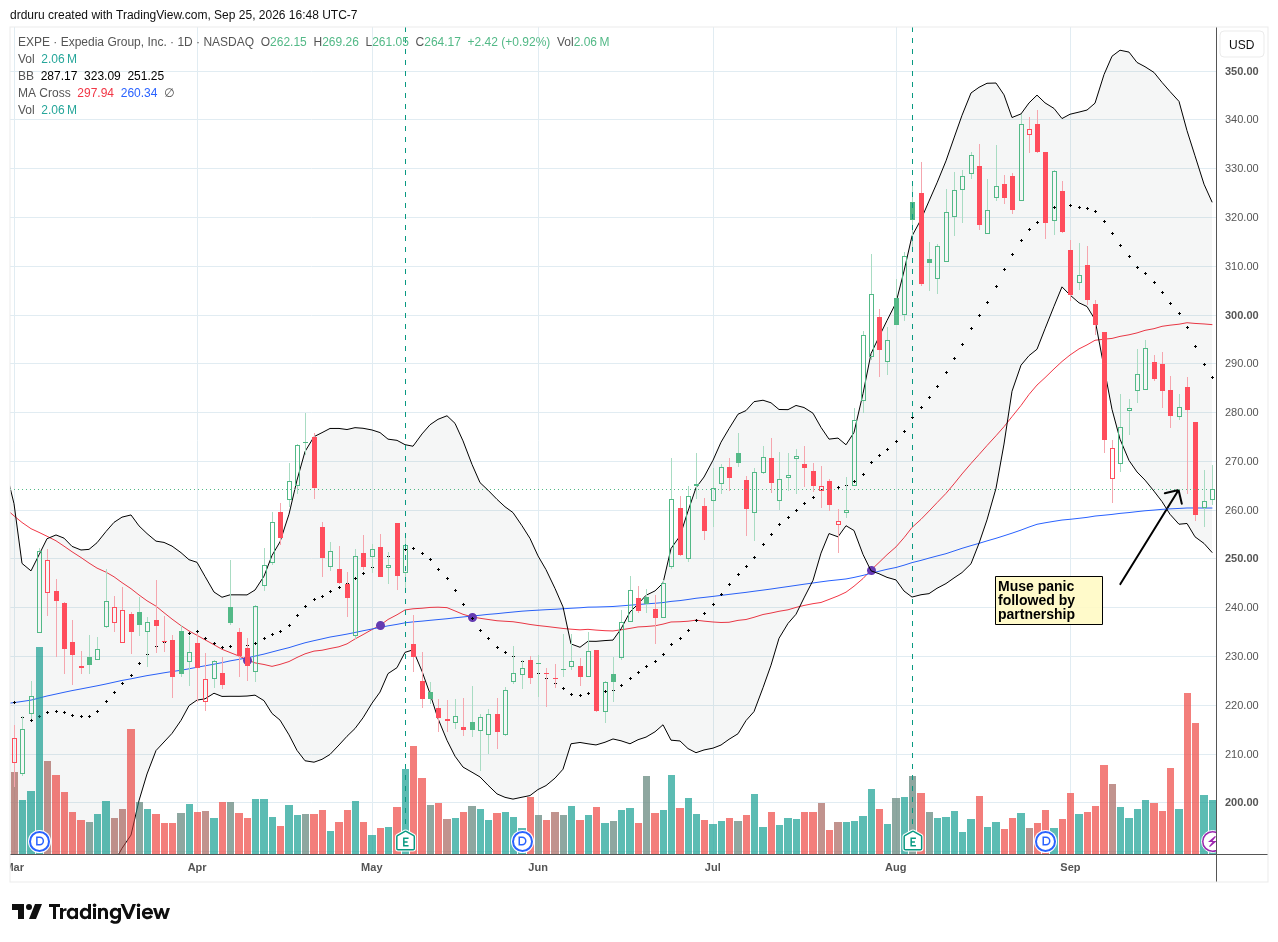
Technical Status: The news of Muse pushed Expedia Group (EXPE) to a 50DMA test despite the company announcing a partnership with META.
Trade Commentary: EXPE also ended up on the failing side of the Muse-driven excitement. Like ABNB, EXPE gained fractionally on Monday. However, its travails took a strange turn after a post on X provided assurance that travelers could use Muse to book on Expedia. The stock went from a 6.3% loss on the day to essentially flat. Sellers returned the next day and pushed EXPE right back to 200DMA support. An Expedia press release on Thursday provided more details and, for now, seemed to placate the sellers. I am a buyer on one more higher close. Friday’s continuation buying confirmed 200DMA support, but the move was too tepid to convince me to jump in.
Yelp (YELP)
Description: Yelp operates a digital platform that connects consumers with local businesses through reviews, discovery tools, advertising and business-service products.
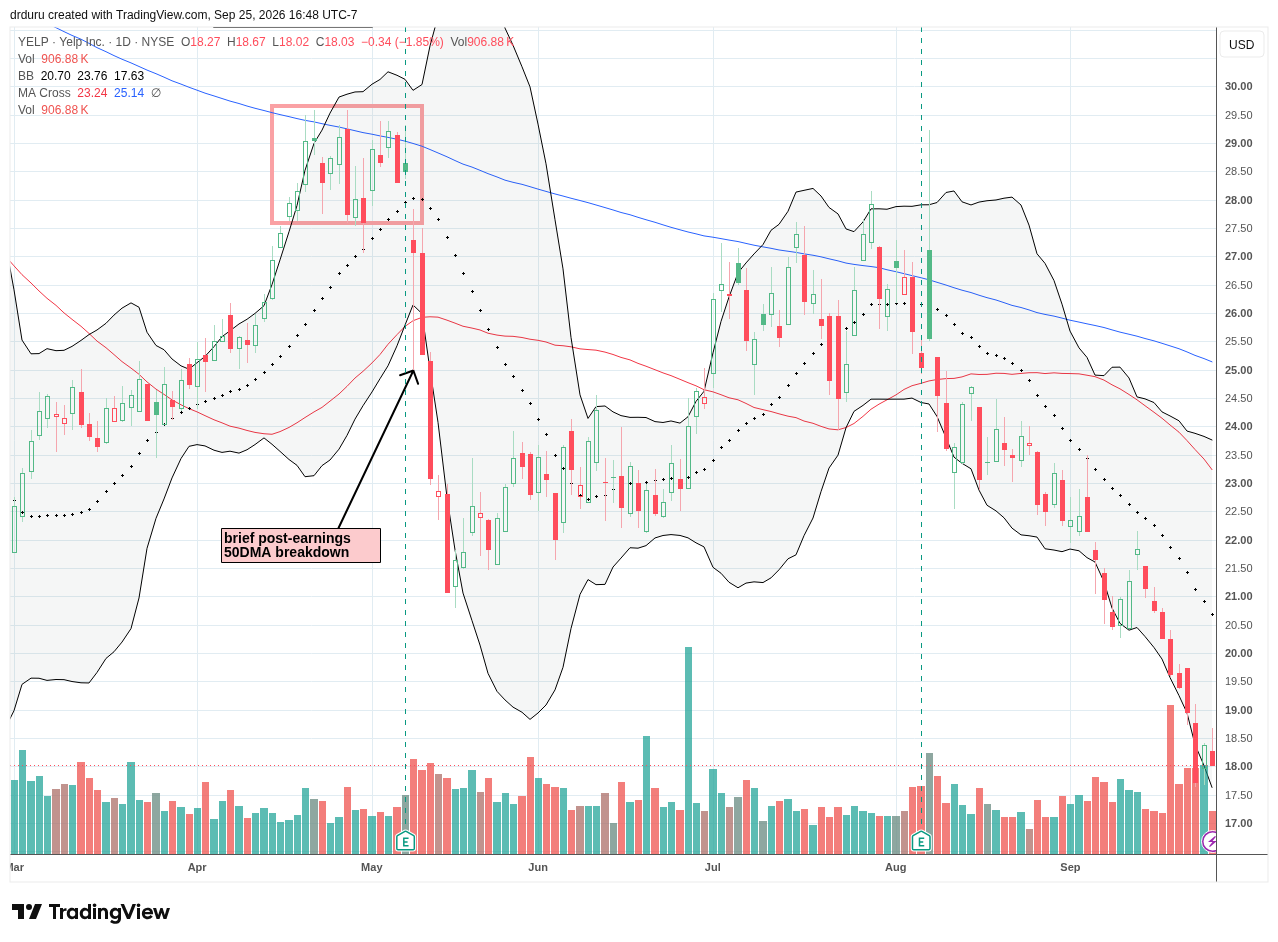
Technical Status: Yelp (YELP) has steadily sold off since August earnings and now trades back to levels last seen when the pandemic started.
Trade Commentary: YELP was on my buy list in May, and it still is. The stock failed to make a convincing 200DMA breakout. Its rally stalled right before finishing a reversal of its post-earnings loss. August earnings generated a gap and crap and sellers have barely relented since then. Now YELP is back to price levels it last saw soon after the COVID-19 pandemic started six and a half years ago. I cannot treat current levels as a bargain buying opportunity until the downtrend comes to an end. In the meantime, YELP is at risk for breaking down to all-time lows.
United States Oil Fund (USO)
Description: The United States Oil Fund is an exchange-traded commodity pool designed to reflect daily movements in light sweet crude oil primarily through short-term oil futures contracts.
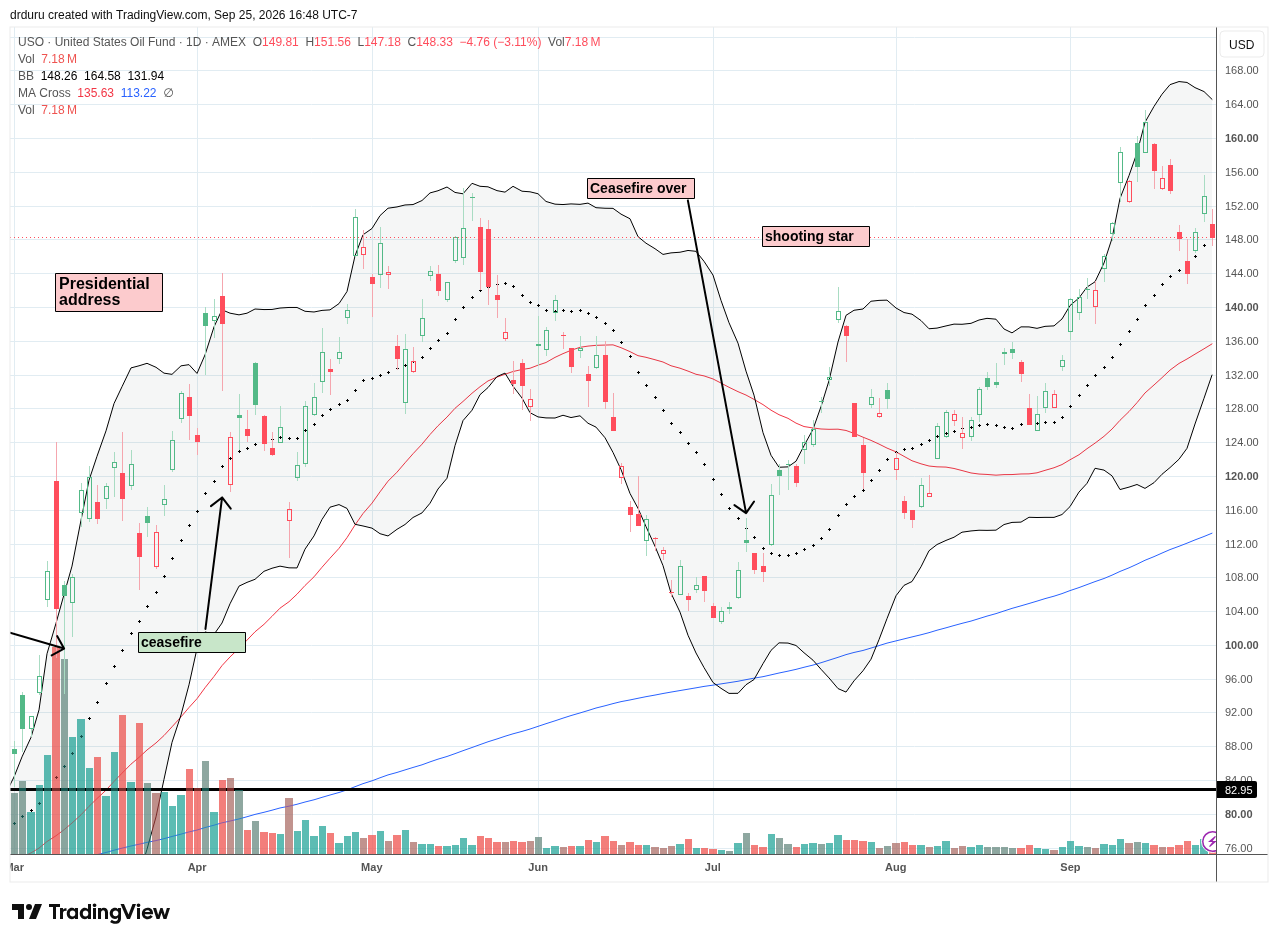
Technical Status: United States Oil Fund (USO) gave the stock market a boost by selling off to 20DMA support to start the week. After filling the gap, USO fell right back to its 20DMA.
Trade Commentary: Almost two weeks ago, I took a shot at fading USO on what looked like an over-extended surge above its upper Bollinger Band. Oil prices proceeded to rally for two more days before the fade began. USO quickly fell to 20DMA support, but I decided to keep holding my put spread. So far, USO is holding 20DMA support in picture-perfect form. I am looking for a fresh breakdown that takes USO to 50DMA support.
Goldman Sachs Access Inflation Protected USD Bond ETF (GTIP)
Description: GTIP is an exchange-traded fund designed to track an index of U.S. Treasury Inflation-Protected Securities.
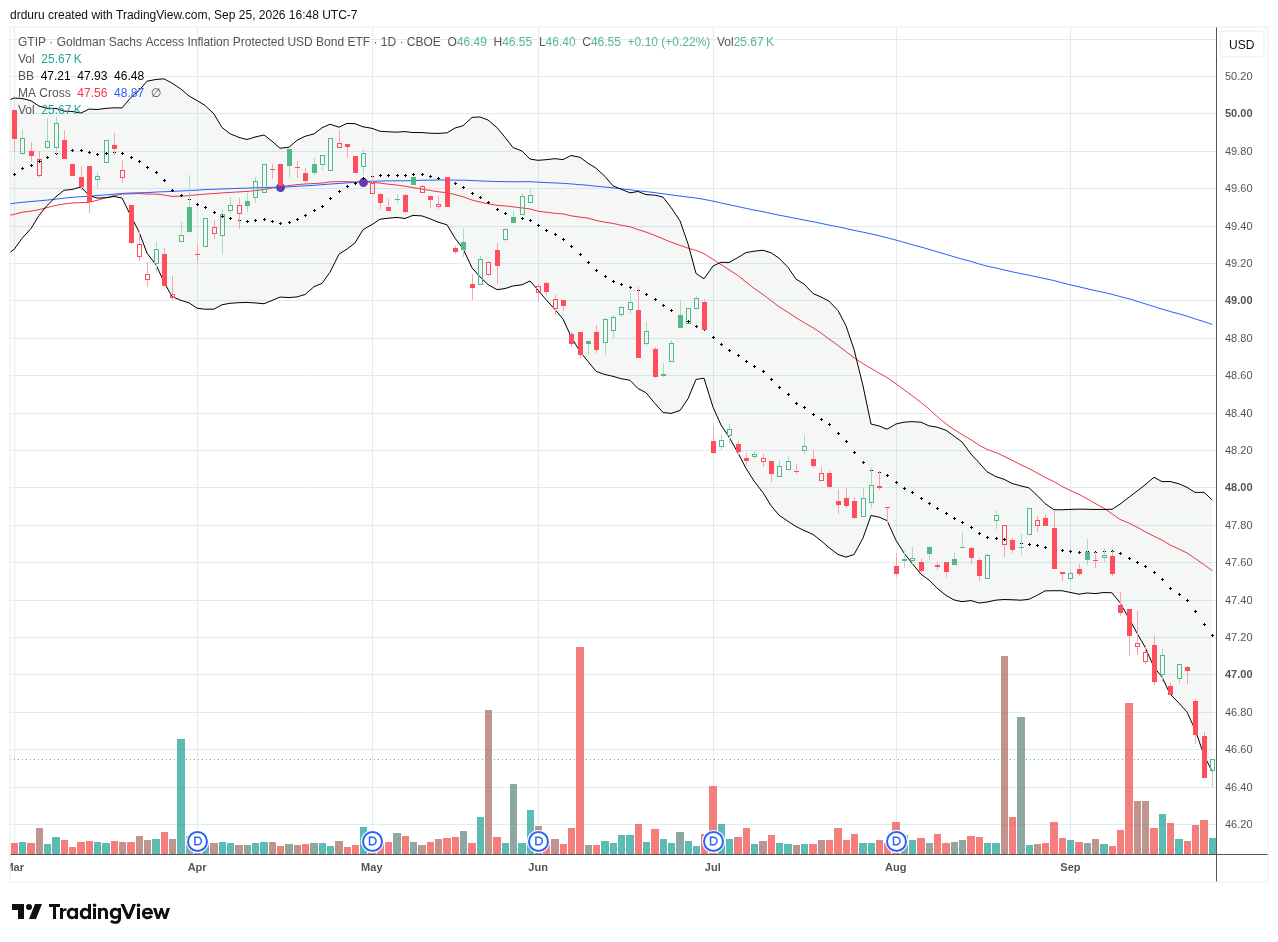
Technical Status: Goldman Sachs Access Inflation Protected USD Bond ETF (GTIP) has sold off most of the year and now trades near its all-time low.
Trade Commentary: Higher bond yields and a hawkish Federal Reserve are killing GTIP. I finally cried uncle last week and locked in my trickle of profit on my large position. I made the case for GTIP in March, 2025. The only reason why I had any profit left was from 18 months of reinvested dividends. Now, the same reason that made GTIP a disaster in 2022 is unfolding again. I have zero interest in GTIP until/unless the Fed steps back from its inflation-fighting posture.
MGM Resorts International (MGM)
Description: MGM Resorts International owns and operates casino resorts and hospitality properties in the United States and internationally while also participating in digital gaming through BetMGM.
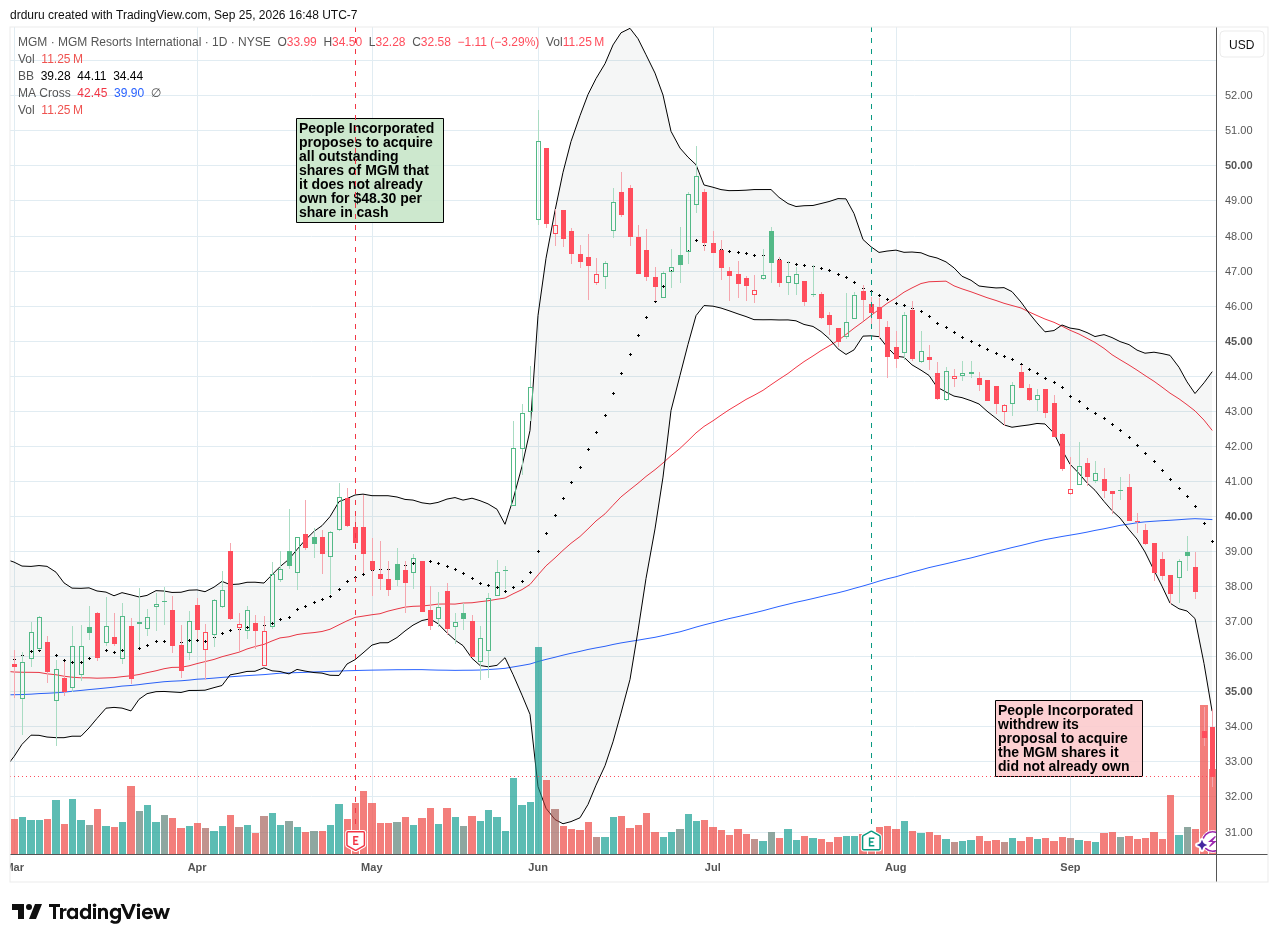
Technical Status: MGM Resorts International (MGM) fell 11.0% after People withdrew its acquisition offer. Selling continued the next day on reports that MGM is considering buying People!
Trade Commentary: On Thursday, People Incorporated (PPLI) withdrew its proposal to acquire the MGM shares it did not already own, completing a steady fade from May’s surge on the buyout offer at $48.30-per-share. This episode is a case where the market anticipated the failed deal. However, with the stock falling to a 10-month low and well below its pre-deal price, I speculated on buying shares. The story immediately took a bizarre twist with MGM reportedly considering an offer to buy PPLI! PPLI jumped 11.3%, and MGM fell another 3.3%. I do not know what to make of this turn in events, but I am holding my shares and may buy more around $30 where MGM found support in the summer of 2025.
CarMax (KMX)
Description: CarMax is a U.S. used-vehicle retailer and wholesaler that also provides auto financing and related automotive services.
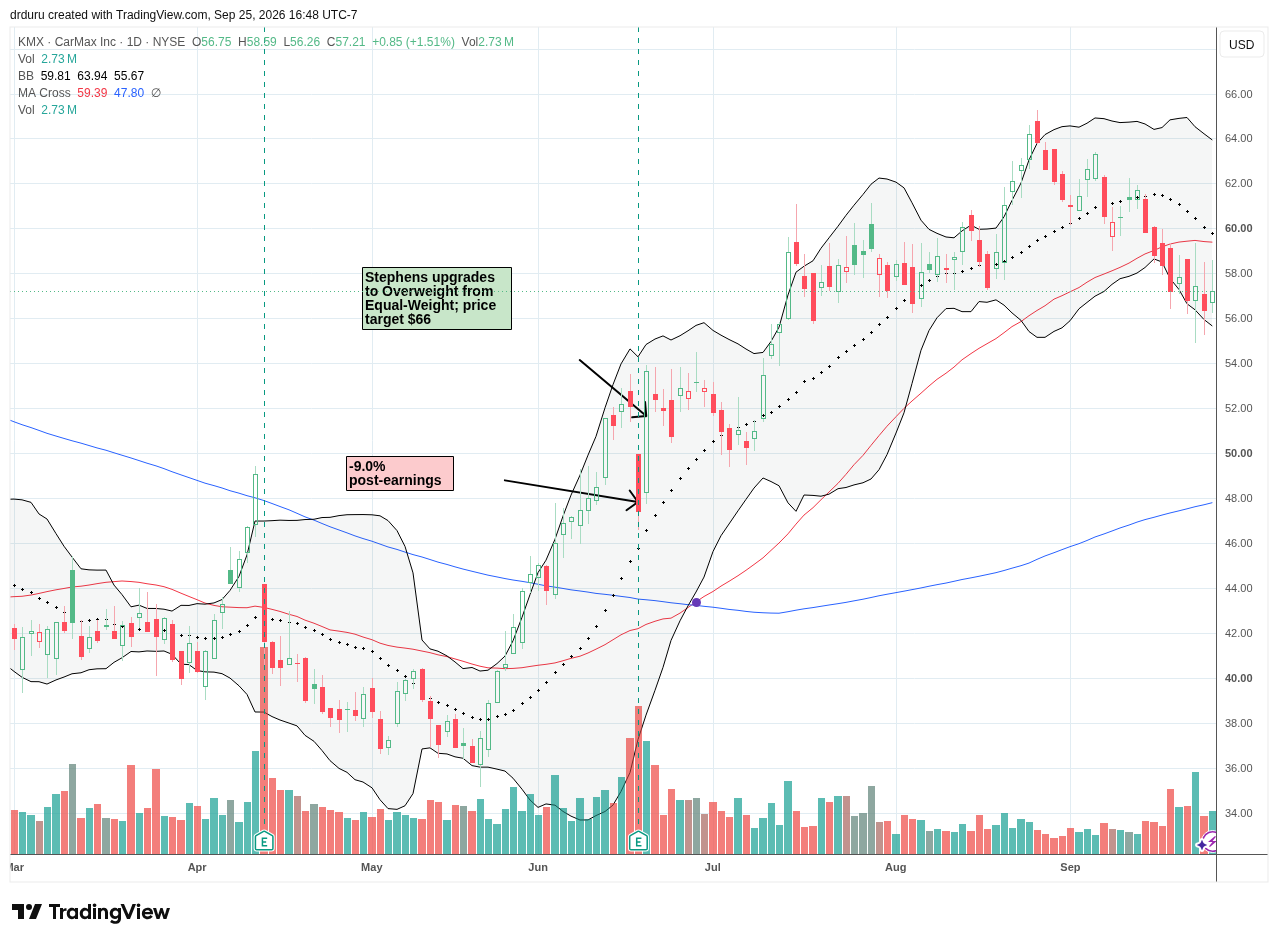
Technical Status: CarMax (KMX) confirmed a 50DMA breakdown and ended the week near a 2-month low.
Trade Commentary: I bought KMX shares in July after making the bullish case. The trade worked out decently, but last week’s confirmed 50DMA breakdown motivated me to lock in my remaining profits. CarMax cut 145 corporate jobs last week, its third round of layoffs in roughly a year, as the company responds to a soft used-auto market and pressure from high vehicle prices and financing costs. With interest rates rising and consumer-facing stocks and businesses under pressure, I am fine exiting KMX here.
Cracker Barrel Old Country Store (CBRL)
Description: Cracker Barrel Old Country Store operates a U.S. chain of restaurants combined with attached retail stores focused on homestyle food and country-themed merchandise.
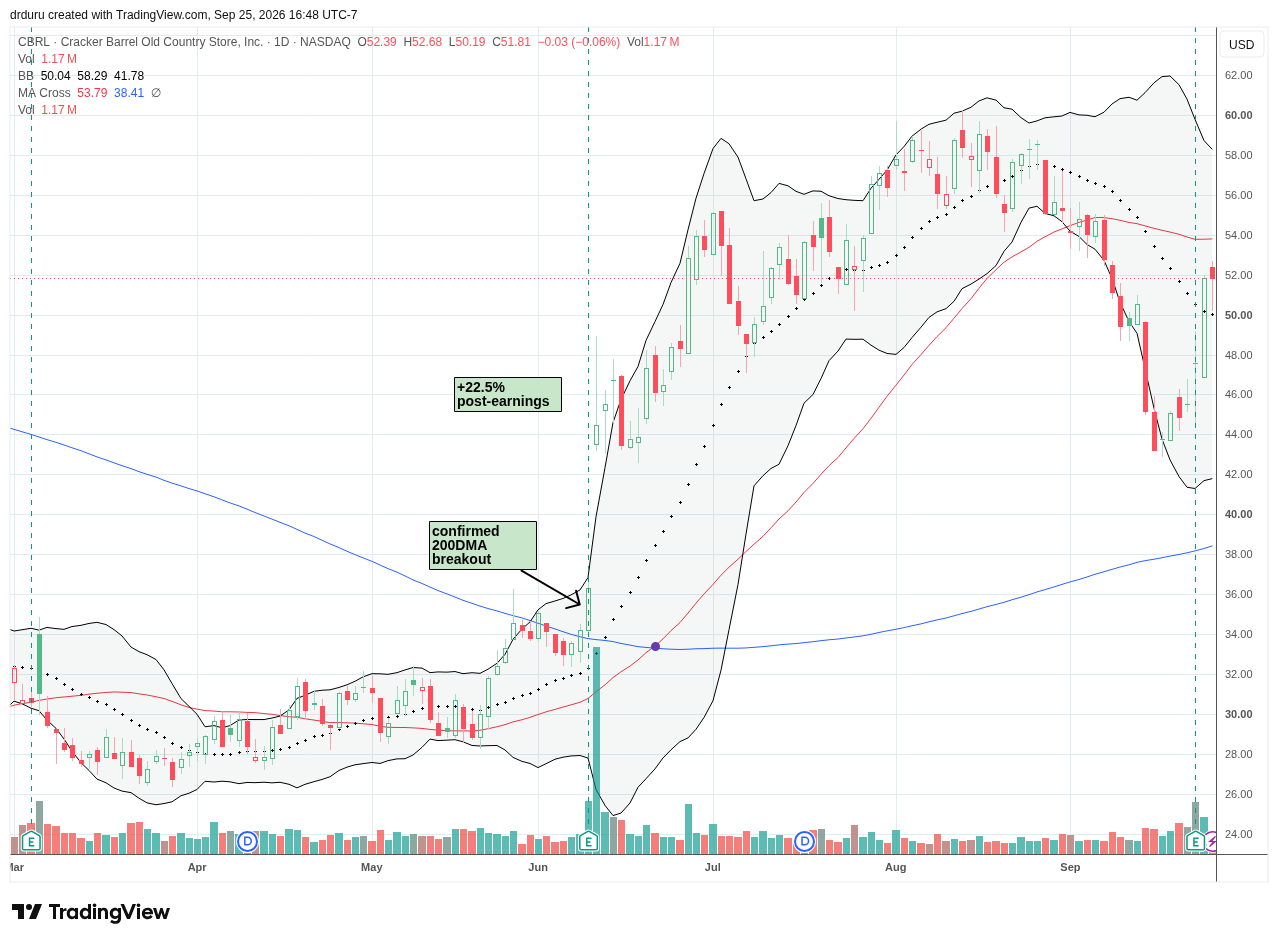
Technical Status: Cracker Barrel Old Country Store (CBRL) surged 9.1% post-earnings but stopped short of challenging its 50DMA resistance.
Trade Commentary: I ended my last trade in CBRL in late July and kept the stock on my radar for earnings. The stock’s 50DMA breakdown in sympathy with the pressure on consumer-facing stocks positioned trading for a test of 200DMA support. The sellers stopped far short of such a test. The stock’s post-earnings jump set up a potential test of 50DMA resistance. I wanted to buy CBRL on the cheap, and I am not interested in chasing a breakout.
Cracker Barrel reported fiscal fourth-quarter revenue of $849.3 million, down 2.2% from a year earlier, with comparable restaurant sales down 2.1% even as adjusted EBITDA improved. The company guided fiscal 2027 revenue to $3.325 billion to $3.4 billion and expects restaurant comparable sales growth of 3% to 5%. The decline in comps makes CBRL even less interesting as a breakout play. With short interest still a high 23.1%, I suspect the post-earnings rally was mainly short-covering.
GRAIL (GRAL)
Description: GRAIL is a healthcare diagnostics company developing blood-based cancer detection products, including its Galleri multi-cancer early detection test.
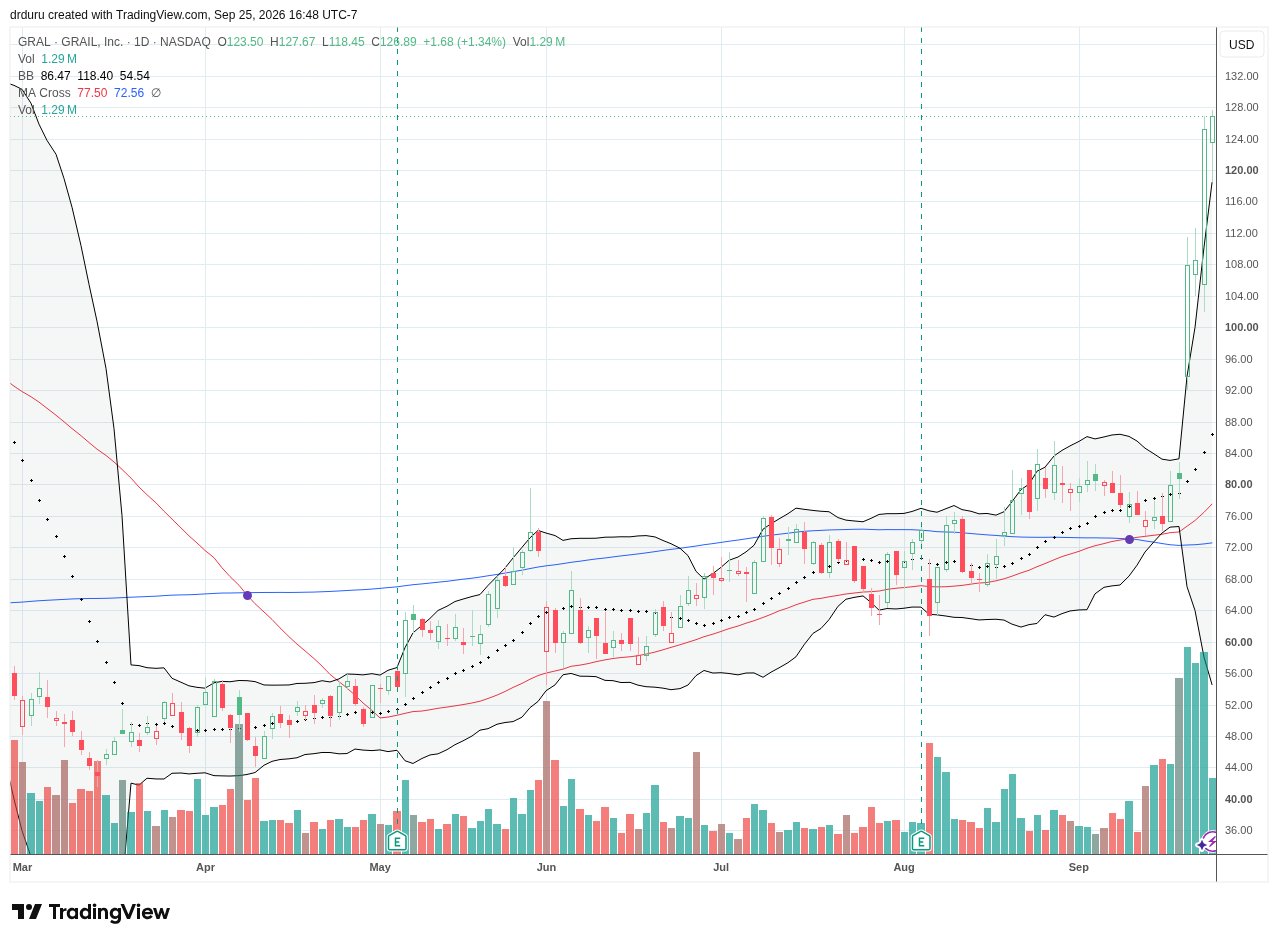
Technical Status: GRAIL (GRAL) surged 33.7% to start the week and gained every day of the week to an all-time high.
Trade Commentary: GRAL surged after FDA staff reviewers raised no major analytical or safety concerns with Galleri, and on Wednesday an FDA advisory committee voted 7-2 with one abstention that the test’s benefits outweigh its risks. The committee was unanimous on safety and voted 6-4 in favor of effectiveness, keeping the regulatory story moving forward. I bought GRAL after the stock collapsed 50% in February in a move that looked overdone given the promise of GRAL’s oncology products. Unfortunately, I let a 50DMA breakdown in July shake me from the stock and lock in profits prematurely. The all-time highs put the stock out of reach for me especially with the consecutive closes well above its upper Bollinger Band.
Moderna (MRNA)
Description: Moderna is a biotechnology company that develops vaccines and therapeutics using messenger RNA technology across infectious disease, oncology and rare diseases.
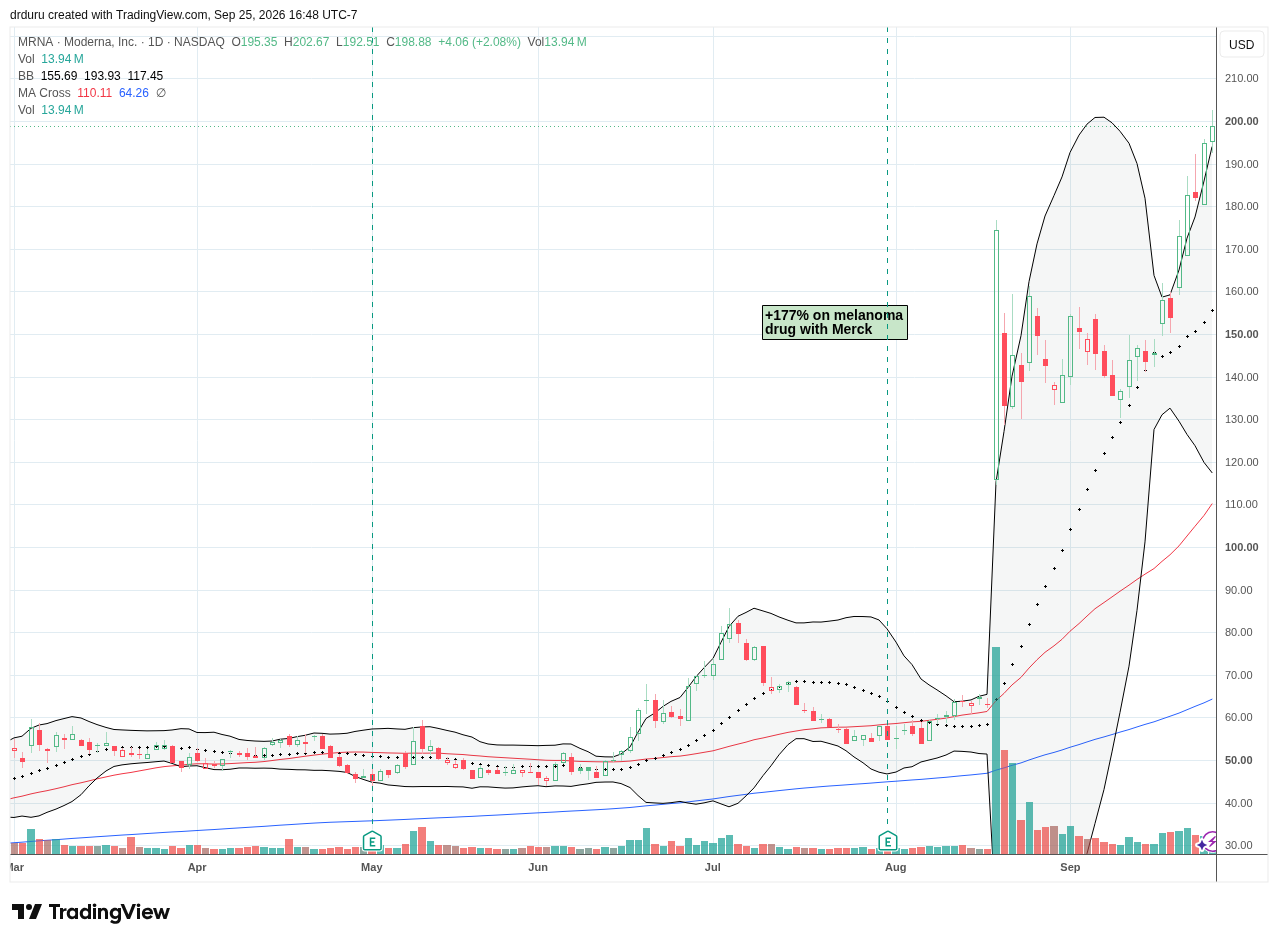
Technical Status: Moderna (MRNA) resolved a Bollinger Band squeeze to the upside and closed the week near a 4-year high.
Trade Commentary: Speaking of lamentations in the healthcare space, MRNA resumed its momentum last week without me. The stock resolved its Bollinger Band squeeze to the upside on Monday after announcing that late-breaking Phase 3 data for its personalized cancer vaccine program would be presented at the ESMO Congress. That announcement hardly seemed newsworthy, but it is very possible the rally was part of growing excitement ahead of Wednesday’s Bernstein Insights: Healthcare Leaders and Disruptors – 3rd Annual Healthcare Forum. The stock faded that day but promptly resumed the rally the last two days of the week.
BillionToOne (BLLN)
Description: BillionToOne is a precision-diagnostics company that uses molecular counting technology for prenatal screening and oncology liquid-biopsy testing.
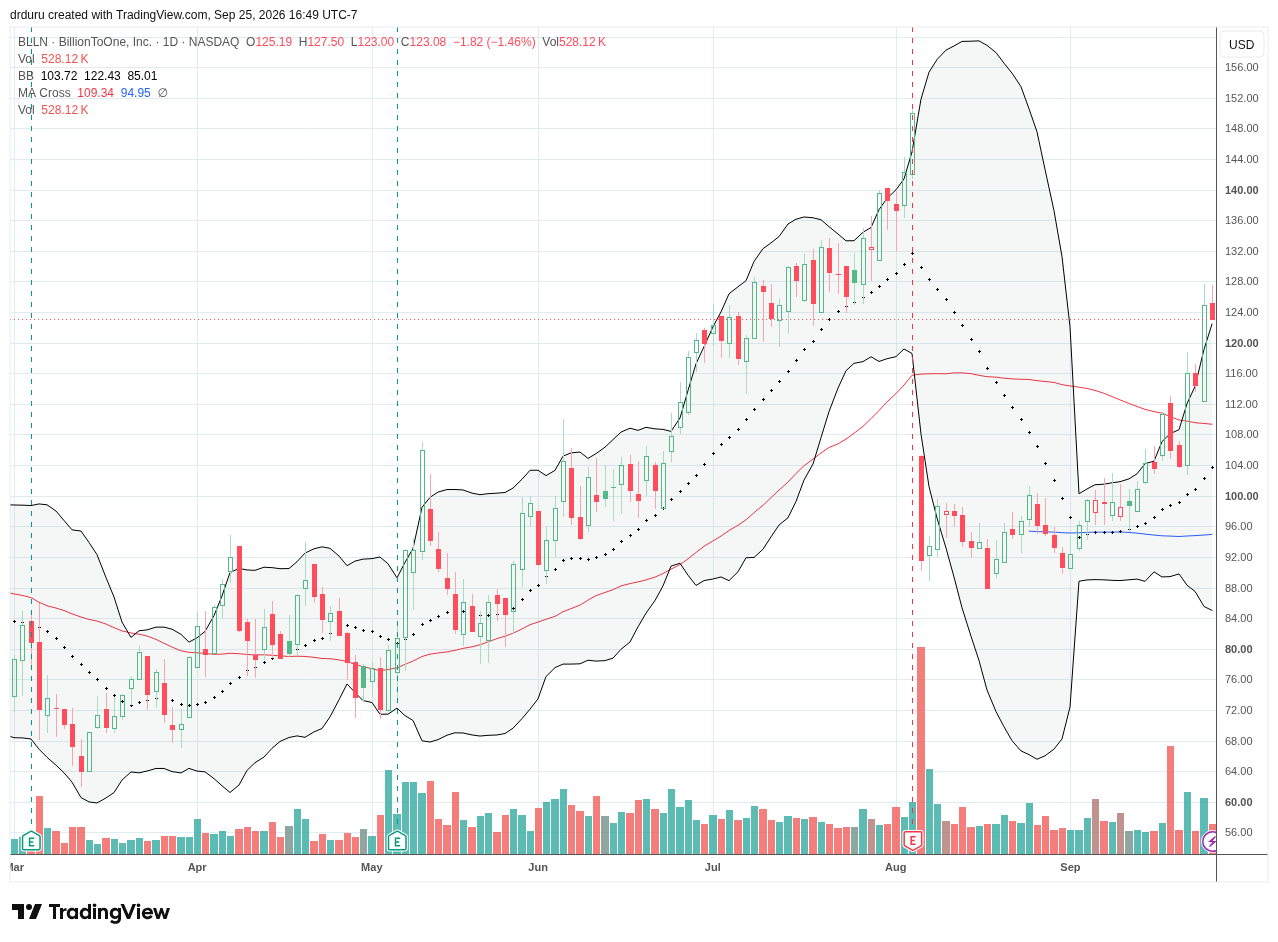
Technical Status: BillionToOne (BLLN) confirmed a fresh 50DMA breakout with a 9.2% surge on Thursday.
Trade Commentary: My trade on BLLN worked out just as I outlined. I took profits at 50DMA resistance, and then watched the stock surge last week. Tuesday’s 50DMA breakout was buyable for a speculative position, but I passed. I was ready to buy on a pullback to 50DMA support. BLLN once again looks like a buy on the dips.
Footnotes
Subscribe for free to get email notifications of future posts!
“Above the 50” (AT50) uses the percentage of stocks trading above their respective 50-day moving averages (DMAs) to measure breadth in the stock market. Breadth defines the distribution of participation in a rally or sell-off. As a result, AT50 identifies extremes in market sentiment that are likely to reverse. Above the 50 is my alternative name for “MMFI” which is a symbol TradingView.com and other chart vendors use for this breadth indicator. Learn more about AT50 on my Market Breadth Resource Page. AT200, or MMTH, measures the percentage of stocks trading above their respective 200DMAs.
Active AT50 (MMFI) periods: Day #296 over 20%, Day #123 over 30% (overperiod), Day #12 under 40% (underperiod), Day #13 under 50%, Day #29 under 60%, Day #269 under 70%
Source for charts unless otherwise noted: TradingView.com
Full disclosure: long USO put spread, long SPY, long IWM call option, long INTC calendar call spread, long ABNB, long MGM
FOLLOW Dr. Duru’s commentary on financial markets via StockTwits, BlueSky, and even Instagram!
*Charting notes: Stock prices are not adjusted for dividends. Candlestick charts use hollow bodies: open candles indicate a close higher than the open, filled candles indicate an open higher than the close.
* Blog notes: I use ChatGPT to help with editing and news discovery.