
The Market Breadth Summary
- Technology stocks cracked under pressure from rising AI capital expenditures, higher oil prices, increasing bond yields, tariffs, and escalating geopolitical risk.
- The S&P 500 broke below its 50-day moving average, while the Nasdaq sagged toward major support at its 200-day moving average.
- Small caps and market breadth remained comparatively resilient by holding critical support levels.
- Still, the market dynamics forced me to downgrade my short-term trading call from cautiously bullish to neutral.
The Stock Market Summary
Technology finally cracked under the weight of multiple pressure points. The biggest catalyst came from the AI spending race as companies such as Intel and Alphabet made it clear that they intend to continue increasing capital expenditures (capex) to remain competitive. Investors responded by focusing on the implications of lower to negative free cash flow, and that concern spread across most large-cap technology stocks. The lone exception was Apple (AAPL), which rallied sharply on Friday and nearly returned to its all-time high.
Technology was not the only source of pressure. The war against Iran escalated and broadened, helping send oil prices soaring before Thursday’s topping action. In turn, higher oil prices rekindled inflation fears and helped push long-term bond yields higher. Altogether, these catalysts placed pressure on stocks. The Federal Reserve’s coming announcement on monetary policy will carry high stakes in this high-pressure environment.
I remain skeptical that the Federal Reserve will raise interest rates. Federal Reserve Chair Kevin Warsh could even point to higher long-term bond yields as creating sufficient tightening in response to inflationary triggers.
Last week even delivered fresh tariff news. Given that these tariffs replace expiring ones, the economy is not getting hit with incrementally higher price pressures. Instead, the economy will suffer ongoing price pressure.
Taken together, increasing AI spending, a worsening war, higher oil prices, rising bond yields, and tariffs created a hostile market environment. Technology finally broke down under that pressure, but market breadth continued to hold critical support. I am not ready to flip bearish, but the breakdown in technology was enough to push my short-term trading call from cautiously bullish to neutral.
S&P 500 (SPY)
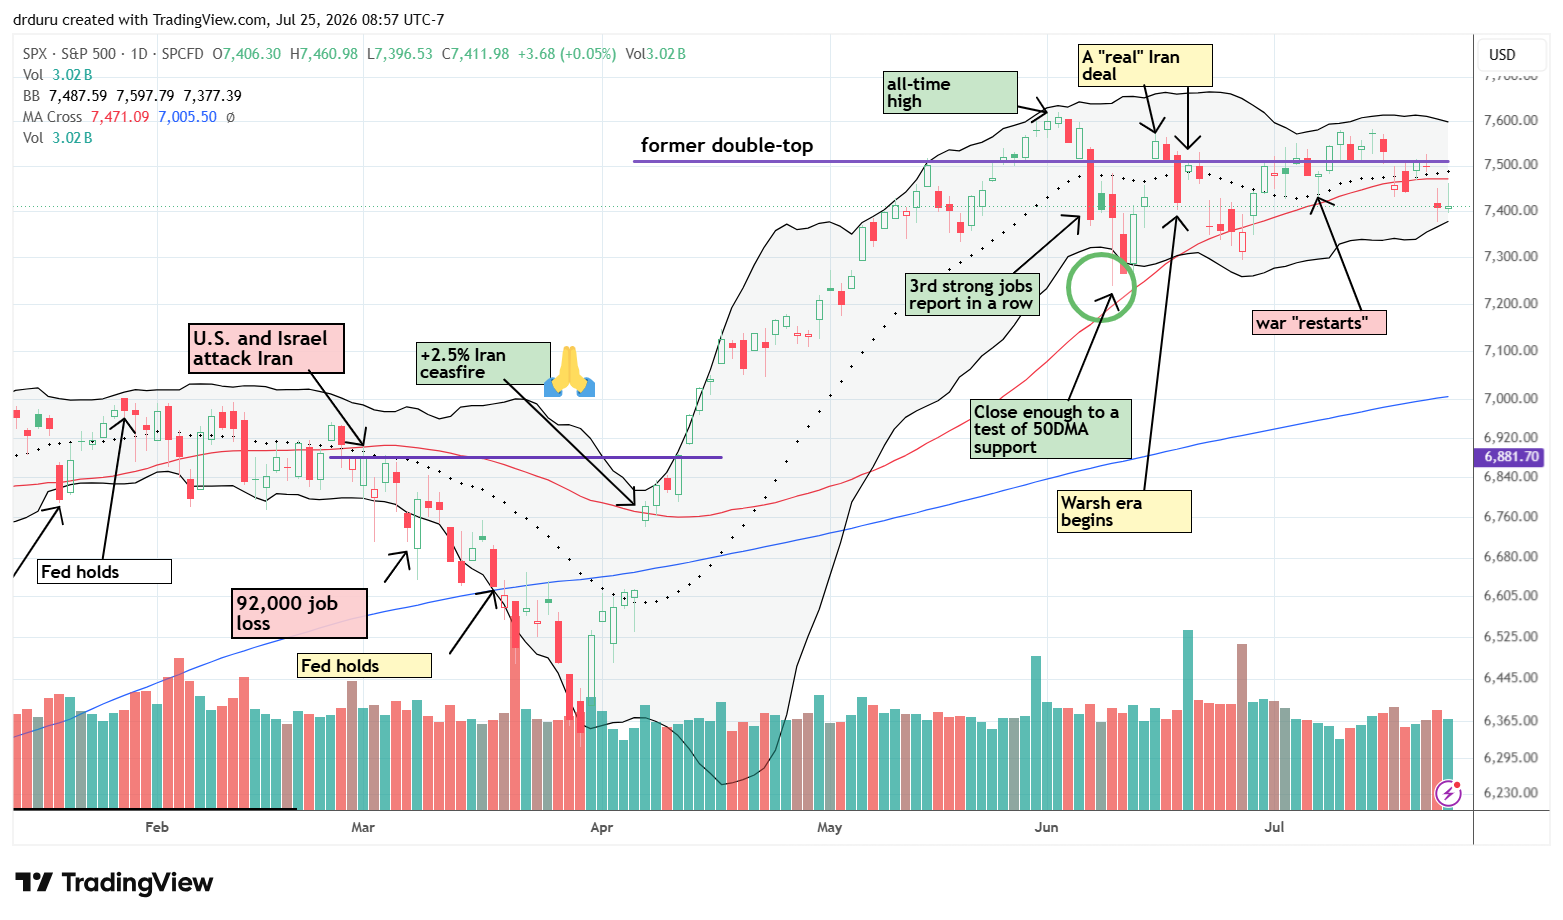
The S&P 500 confirmed a breakdown below its 50-day moving average (DMA) (the red line) after Thursday’s 1.2% decline was followed by a fade from 50DMA resistance. Even so, the index remained well above its June lows, where buyers previously defended support near the 50DMA. As long as that support continues to hold, I do not want to get bearish on the S&P 500, especially with market breadth remaining resilient. I also continue to watch the 7,500 area closely because the index continues to have trouble with that former double top.
NASDAQ (COMPQ)
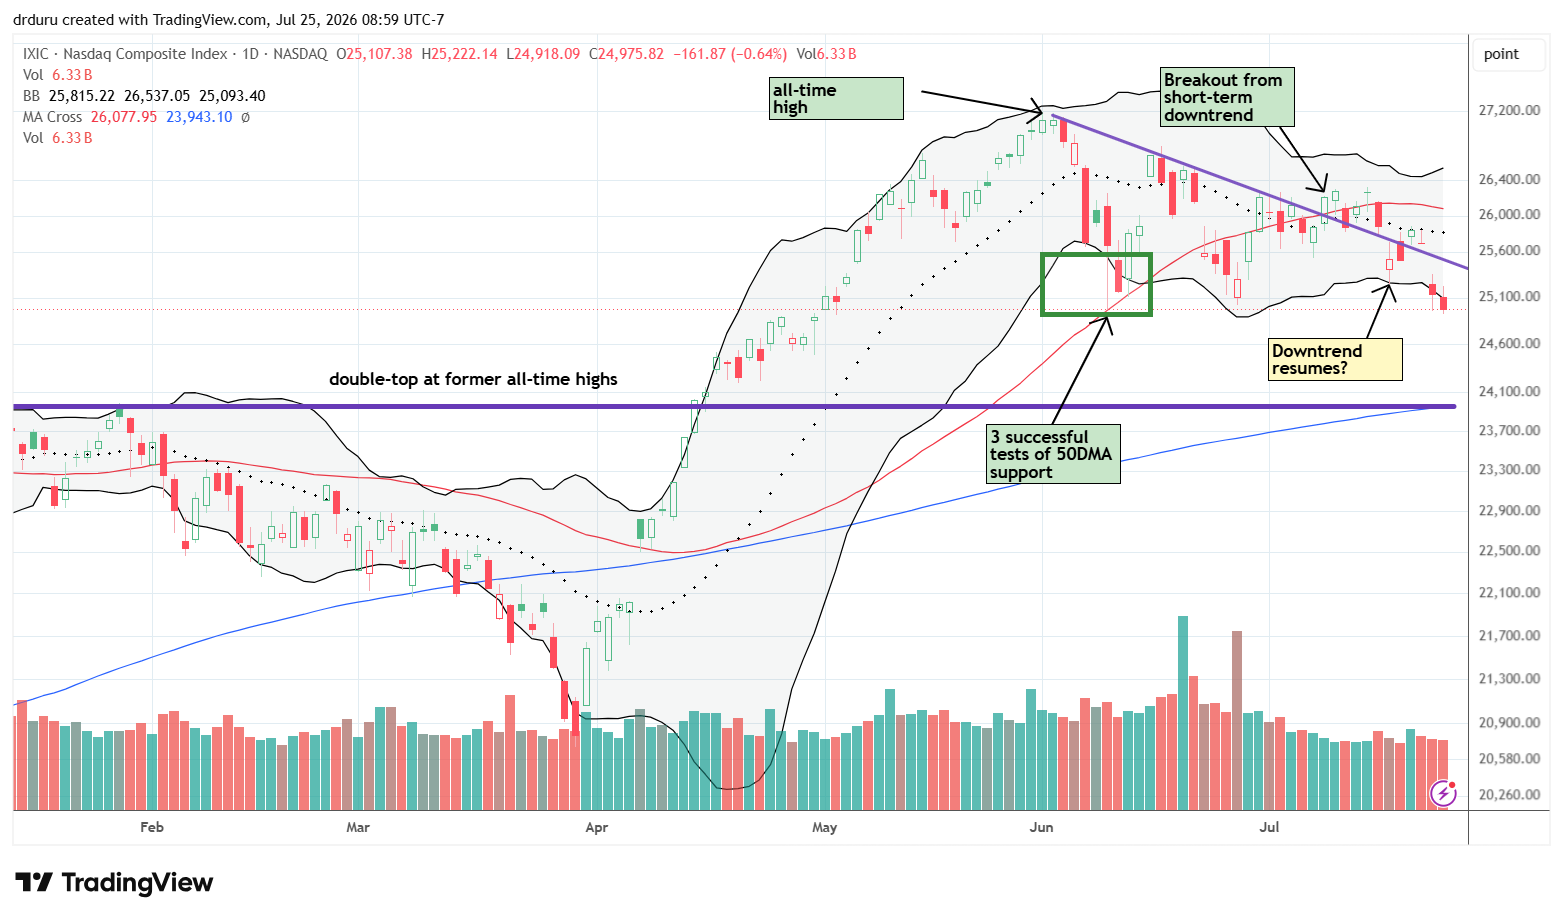
The NASDAQ (COMPQ) delivered the clearest sign of weakness during the week. The index fell back below its downtrend line with a 2.2% loss on Thursday, followed by another 0.6% decline on Friday. The tech-laden index closed at levels last seen in early May and is now approaching major support from a converging 200DMA (blue line) and a former double-top in the NASDAQ. Given the combination of weakening technical momentum and continued concerns over AI spending, I expect this support area to become the market’s next major battleground. In the meantime, I bought a weekly QQQ call spread to speculate on an immediate rebound after two consecutive days closing below the lower Bollinger Band (BB).
iShares Russell 2000 ETF (IWM)
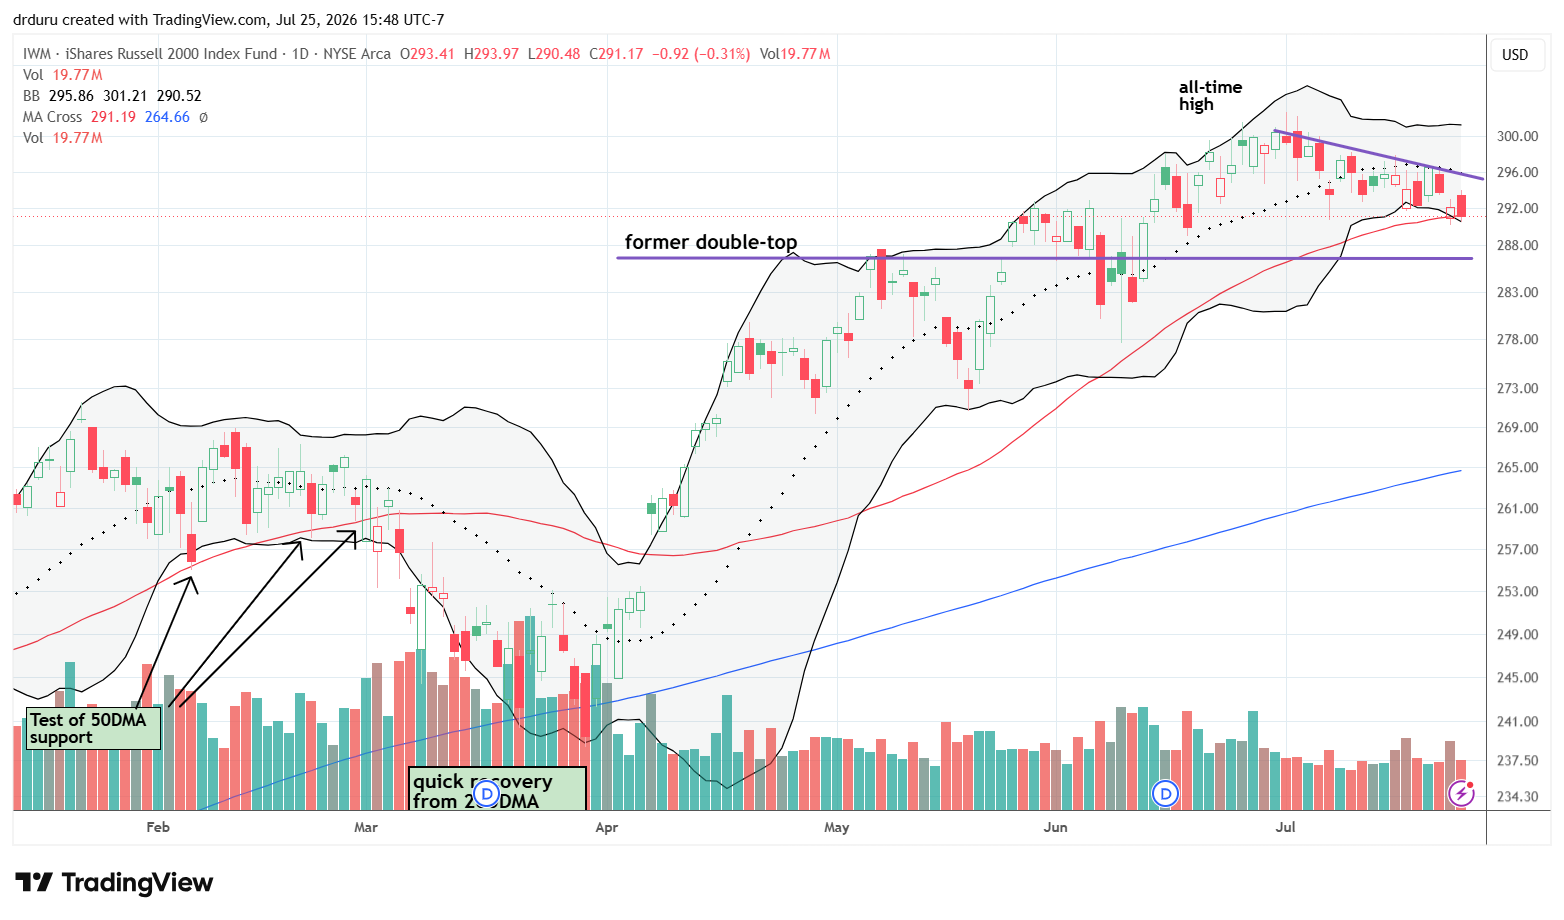
Small caps also weakened, but the iShares Russell 2000 ETF (IWM) held onto 50DMA support the last two trading days of the week. On Thursday, IWM briefly pushed below support before buyers stepped in, while Friday’s session faded back to close almost exactly on the 50DMA. This continued respect for technical support reinforced my view that technical levels still matter, even for broad market indices. I bought a fresh speculative position in IWM call options, expecting buyers could defend support once again.
The Short-Term Trading Call Under Pressure
- AT50 (MMFI) = 52.9% of stocks are trading above their respective 50-day moving averages
- AT200 (MMTH) = 55.8% of stocks are trading above their respective 200-day moving averages
- Short-term Trading Call: neutral
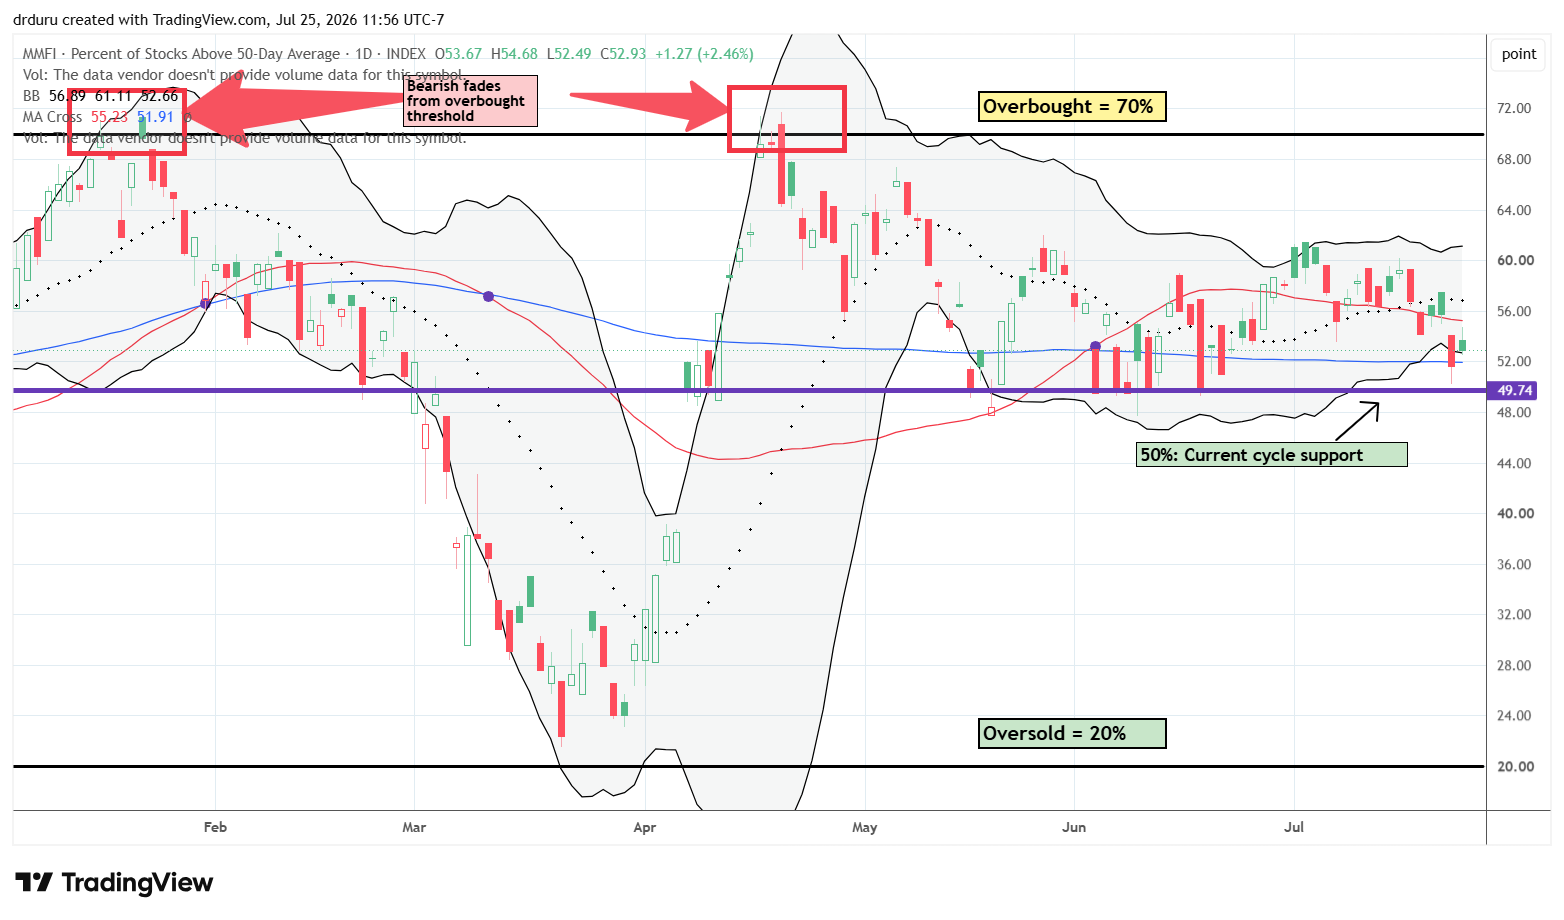
AT50 (MMFI), the percentage of stocks trading above their respective 50DMAs, closed the week at 52.9%.
Market breadth has trended lower through much of July, but AT50 has continued to hold the critical support level (around 50%) established after the April breakout. At Thursday’s intraday low, AT50 bounced directly from that support. In my experience, market breadth rarely respects levels other than the overbought threshold at 70% and the oversold threshold at 20%, so this behavior stood out.
The continued support allows me to avoid flipping bearish on the stock market. However, I did downgrade from cautiously bullish to neutral. I anticipate a lot of churn through the rest of the summer with a trading battle under topping indices and above critical support levels.
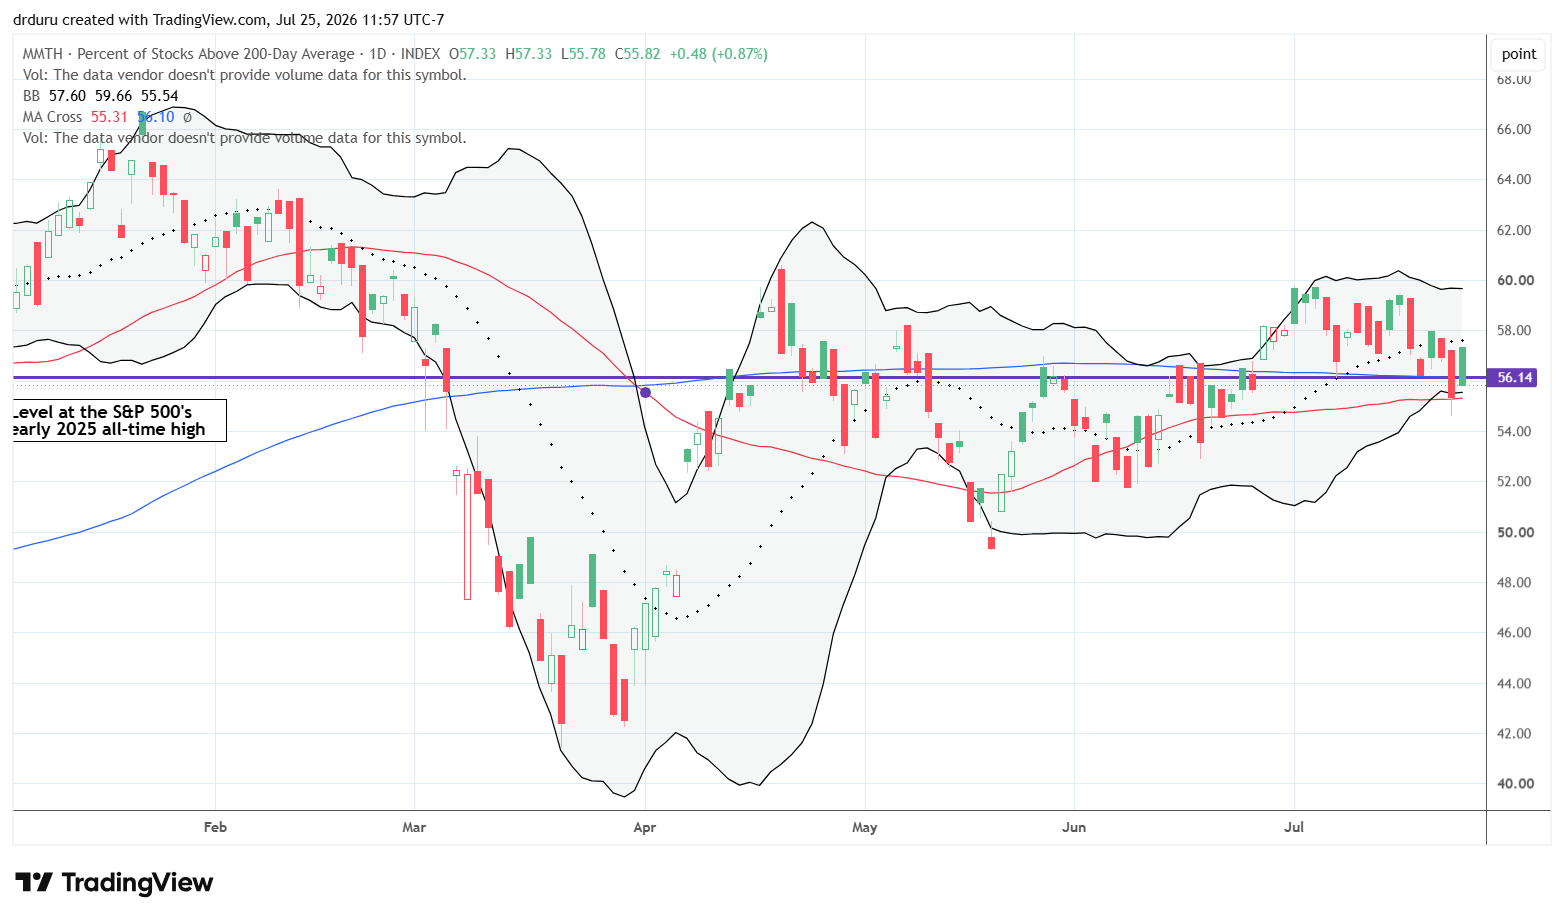
AT200, the percentage of stocks trading above their respective 200DMAs, closed the week at 55.8%. AT200 briefly breached the pivot near 56%, but it finished the week essentially on top of that level. Like AT50, AT200 continued to support a neutral market outlook rather than a bearish one.
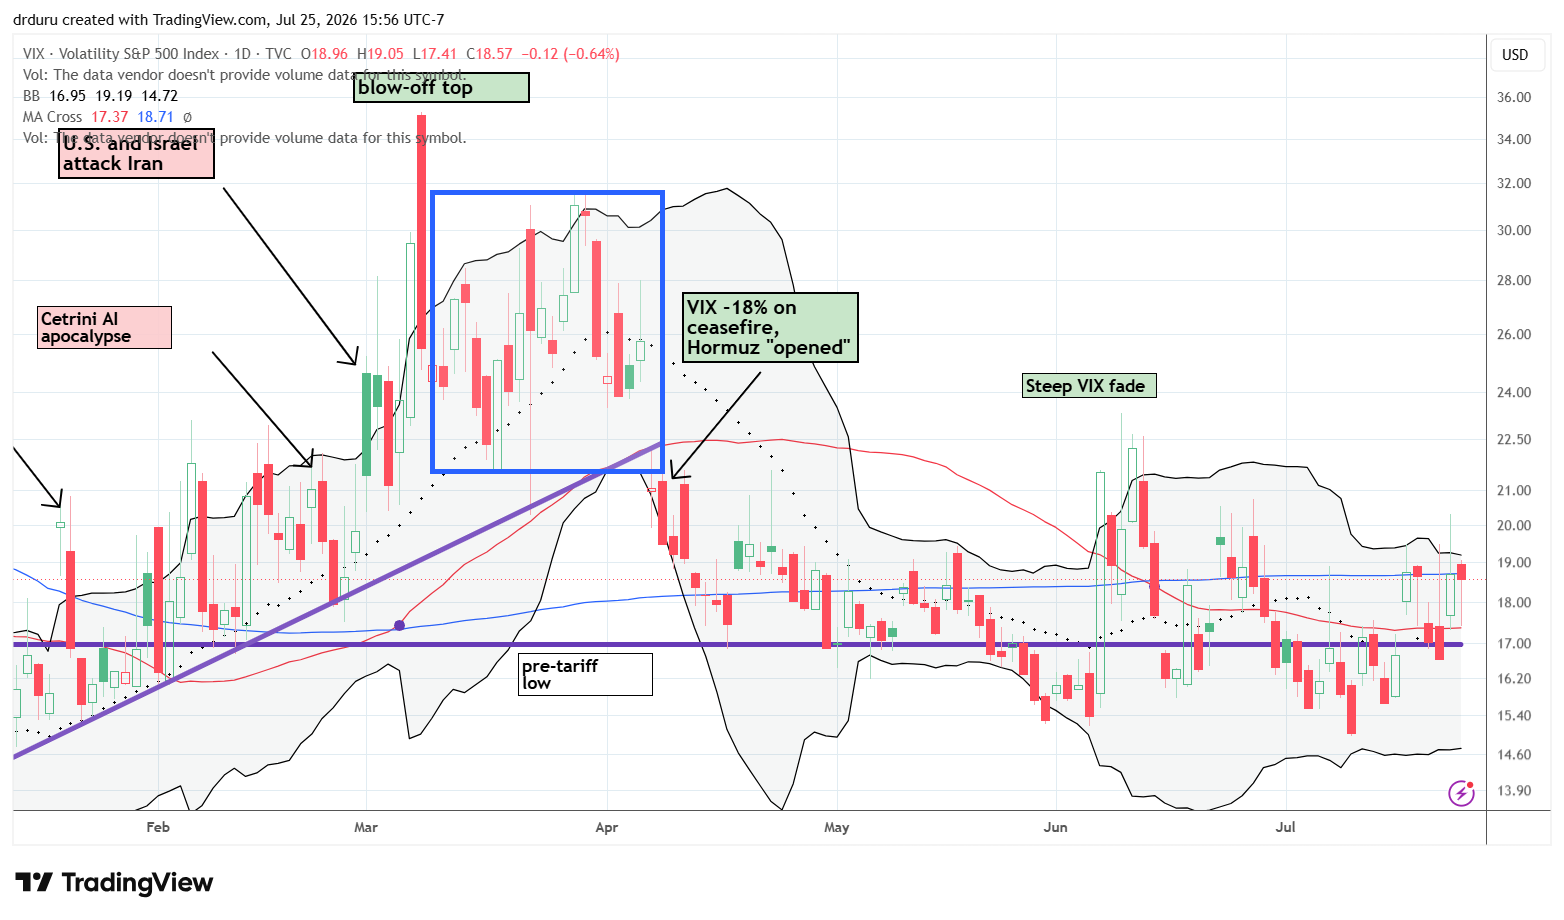
The volatility index fell on Tuesday and rebounded on Thursday. In between, support at the pre-tariff low held. Now the VIX looks ready to launch much higher at the first sign of (new) trouble.
In case you missed it…
Domo, Inc (DOMO) finally pulled the trigger on a deal that the company claims values the stock at $4.84/share. Yet, DOMO closed the week at $3.68/share and now looks cheap.
The Equities
United States Oil Fund (USO)
Description: The United States Oil Fund (USO) is an exchange-traded security designed to track the daily price movements of light, sweet crude oil.
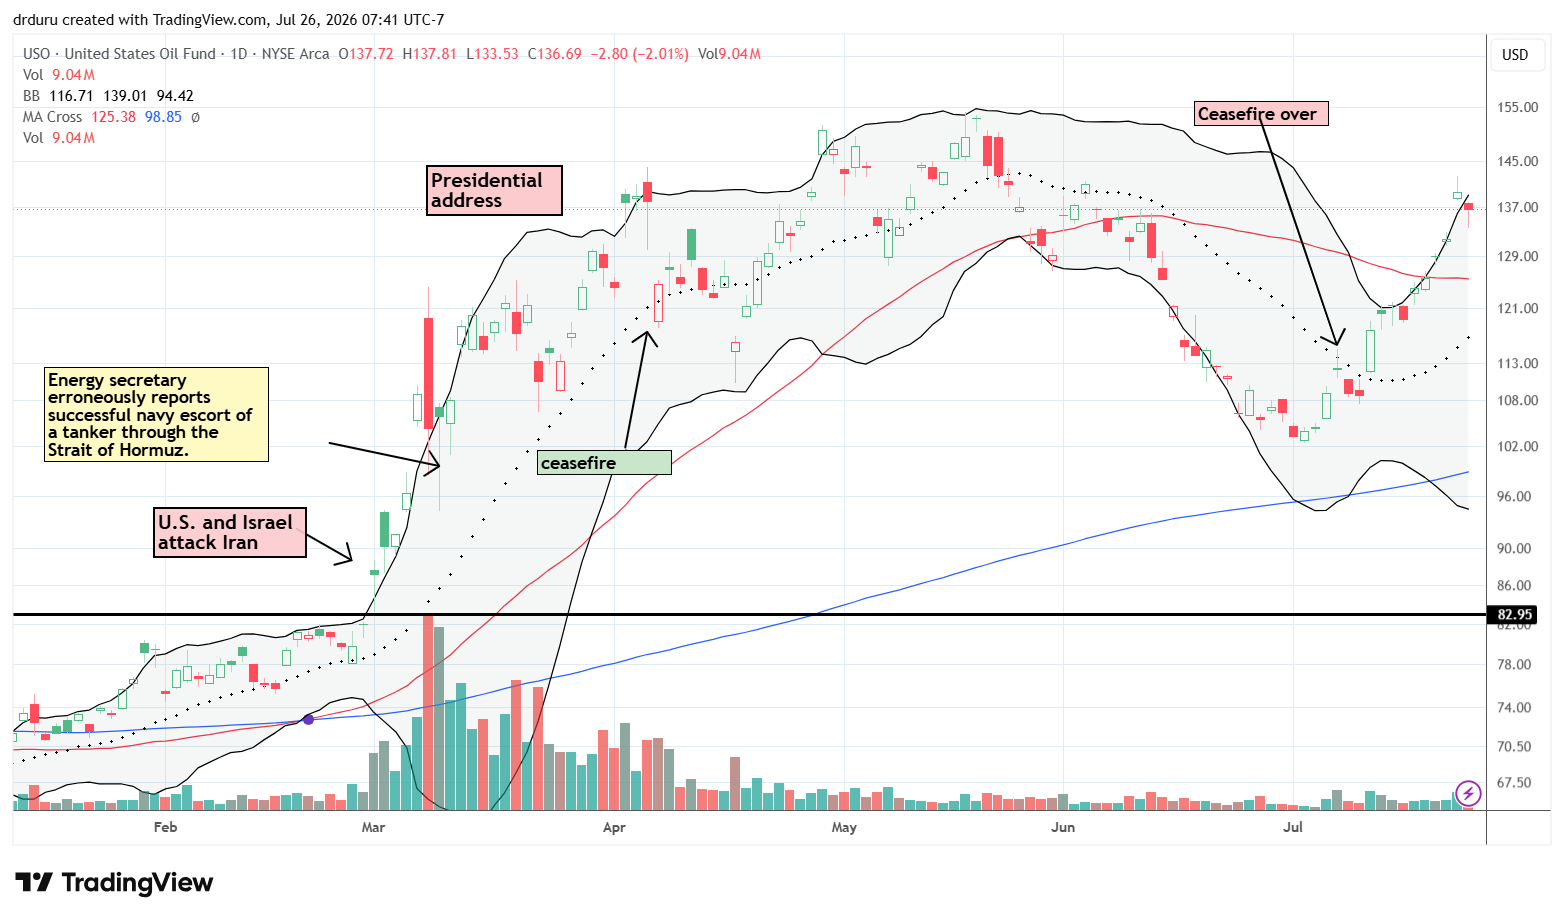
Technical status: The United States Oil Fund (USO) has rallied all month but finally looked exhausted after an intraday fade on Thursday.
Trade commentary: The fresh rally in oil added to my expectation that inflation pressures will persist this year and keep bond yields elevated. Even so, I suspect oil could be approaching a short-term peak given the extreme extension of this month’s rally in USO. I aggressively faded USO on Thursday by selling a 150/160 call spread to pay for a 120/130 put spread.
iShares 20+ Year Treasury Bond ETF (TLT)
Description: The iShares 20+ Year Treasury Bond ETF (TLT) tracks an index composed of U.S. Treasury bonds with remaining maturities greater than 20 years.
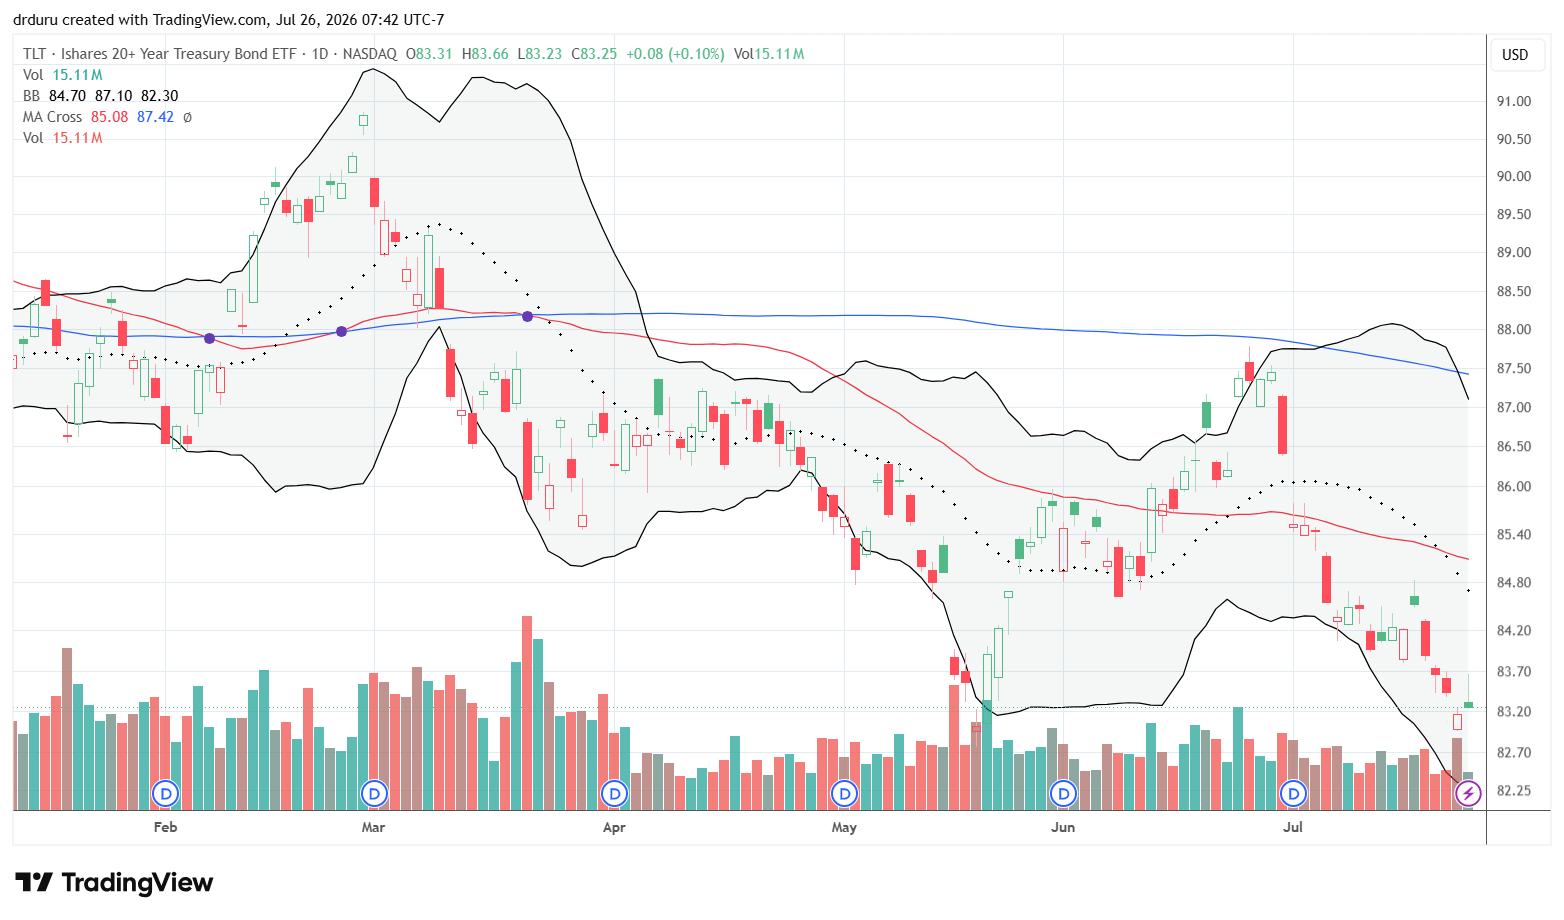
Technical status: The iShares 20+ Year Treasury Bond ETF (TLT) remained under pressure as long-term Treasury yields continued moving higher.
Trade commentary: TLT weakened as long-term bond yields climbed. Rising yields were one of the forces pressuring the market, particularly technology stocks. Given that stocks are not faring even worse, I suspect the equity market is looking for rate relief soon (can Fed Chair Kevin Warsh assuage markets during this week’s release on monetary policy?). Still, the combination of higher oil prices, inflation concerns, tariffs, and geopolitical risks continued working against long-term bonds.
VanEck Semiconductor ETF (SMH)
Description: The VanEck Semiconductor ETF (SMH) tracks the performance of companies involved in semiconductor production and semiconductor equipment.
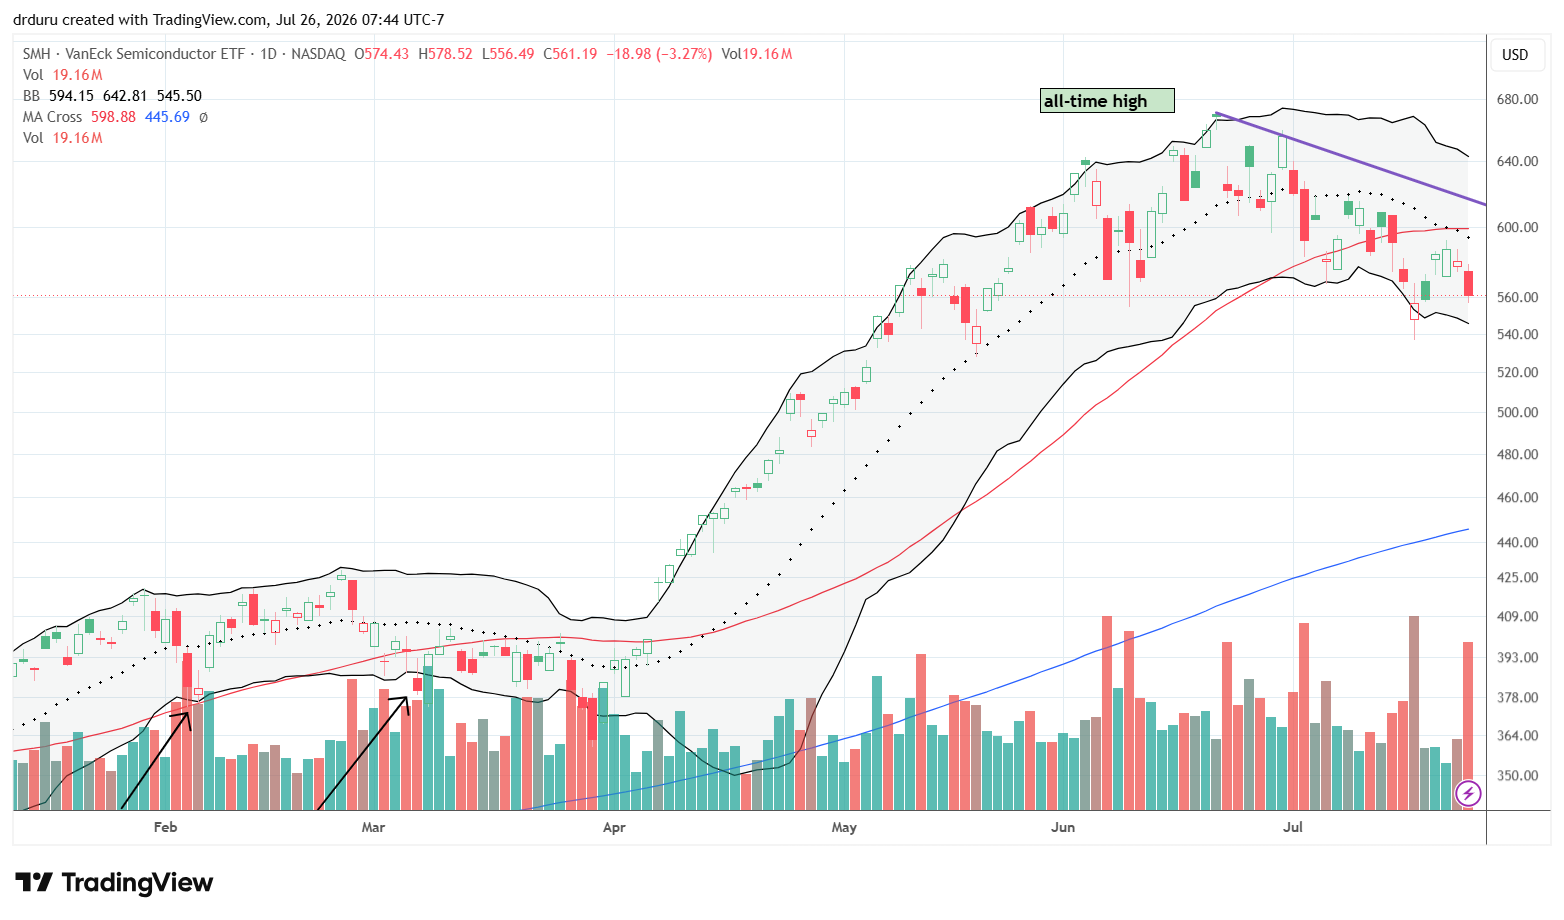
Technical status: The VanEck Semiconductor ETF (SMH) continued to churn under its 50DMA with a short-term downtrend underway.
Trade commentary: SMH is suffering its longest bout of weakness since the war against Iran started at the end of February. With a short-term downtrend unfolding, I am on alert for SMH to crack a new low in this churn under its 50DMA. Note that with a 56% year-to-date gain in place, SMH could sell off to 200DMA support, wipe out most of its rally from April to the all-time high in June, and still finish with a decent year.
Alphabet (GOOG)
Description: Alphabet Inc. is a technology company that provides internet search, digital advertising, cloud computing, software, and artificial intelligence services.
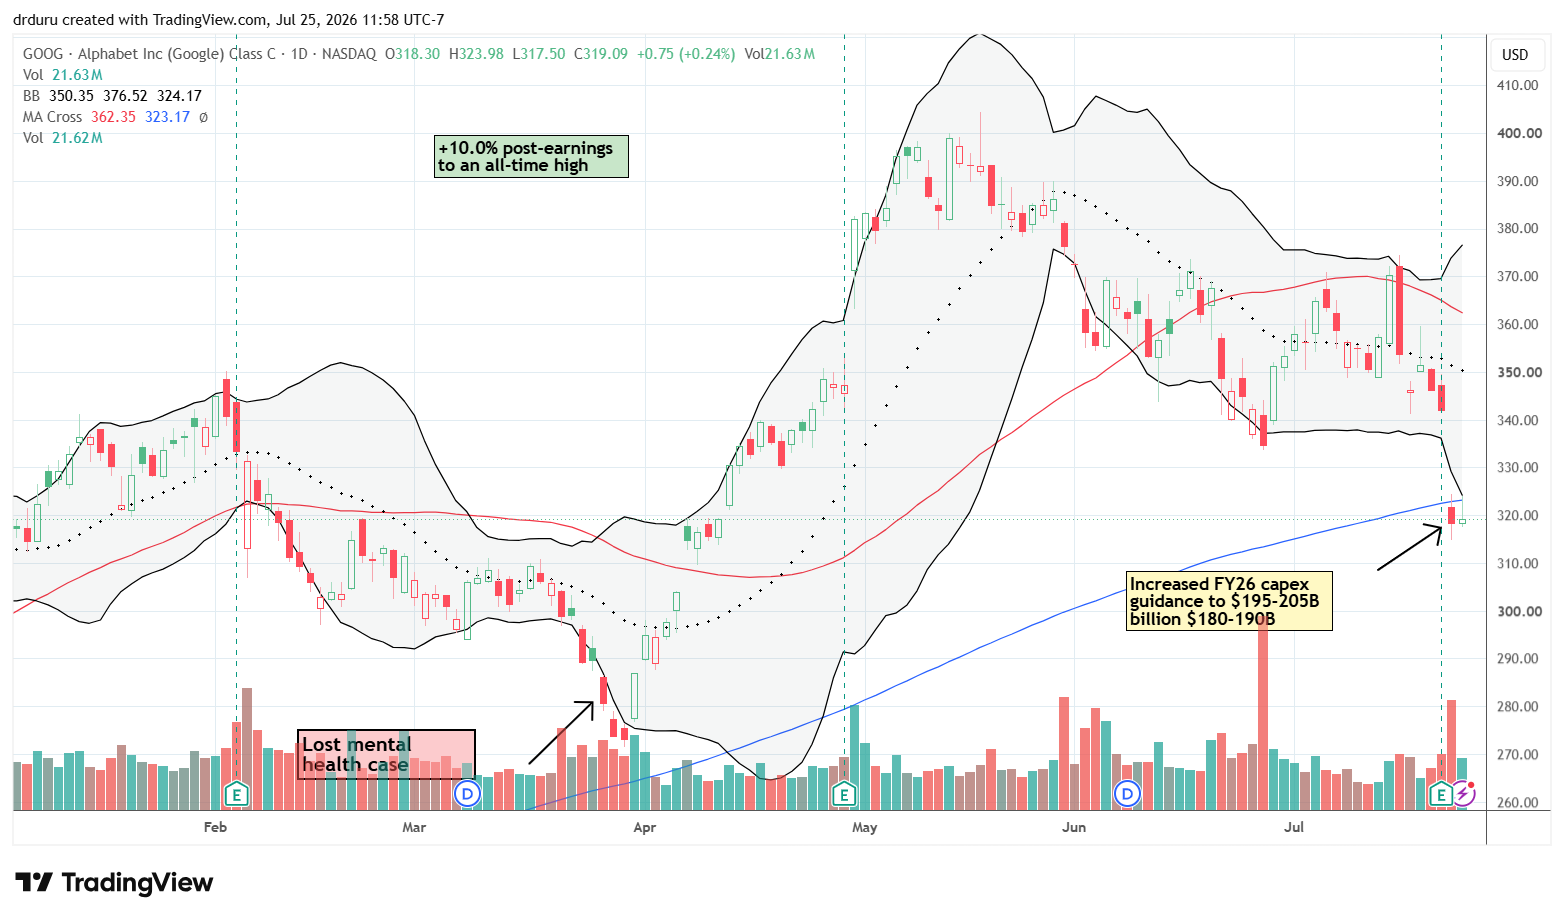
Technical status: Alphabet (GOOG) broke below its 200DMA and entered bearish territory.
Trade commentary: I thought GOOG would continue its earlier rally, but that momentum stalled after May’s all-time high. Investors focused on the company’s decision to increase capital expenditure guidance by approximately $15 billion. While that amount is relatively small for a company of this size, investors appear increasingly concerned that AI spending continues to rise with no clear end in sight…or a compelling return on investment. That concern pushed GOOG into bearish territory. I am continuing to hold my shares given that I finally committed to a long-term investment last March. Still, the reversal of most of the gains since my first purchase sure pains me.
Meta Platforms (META)
Description: Meta Platforms, Inc. develops social media platforms, messaging applications, and virtual reality products.
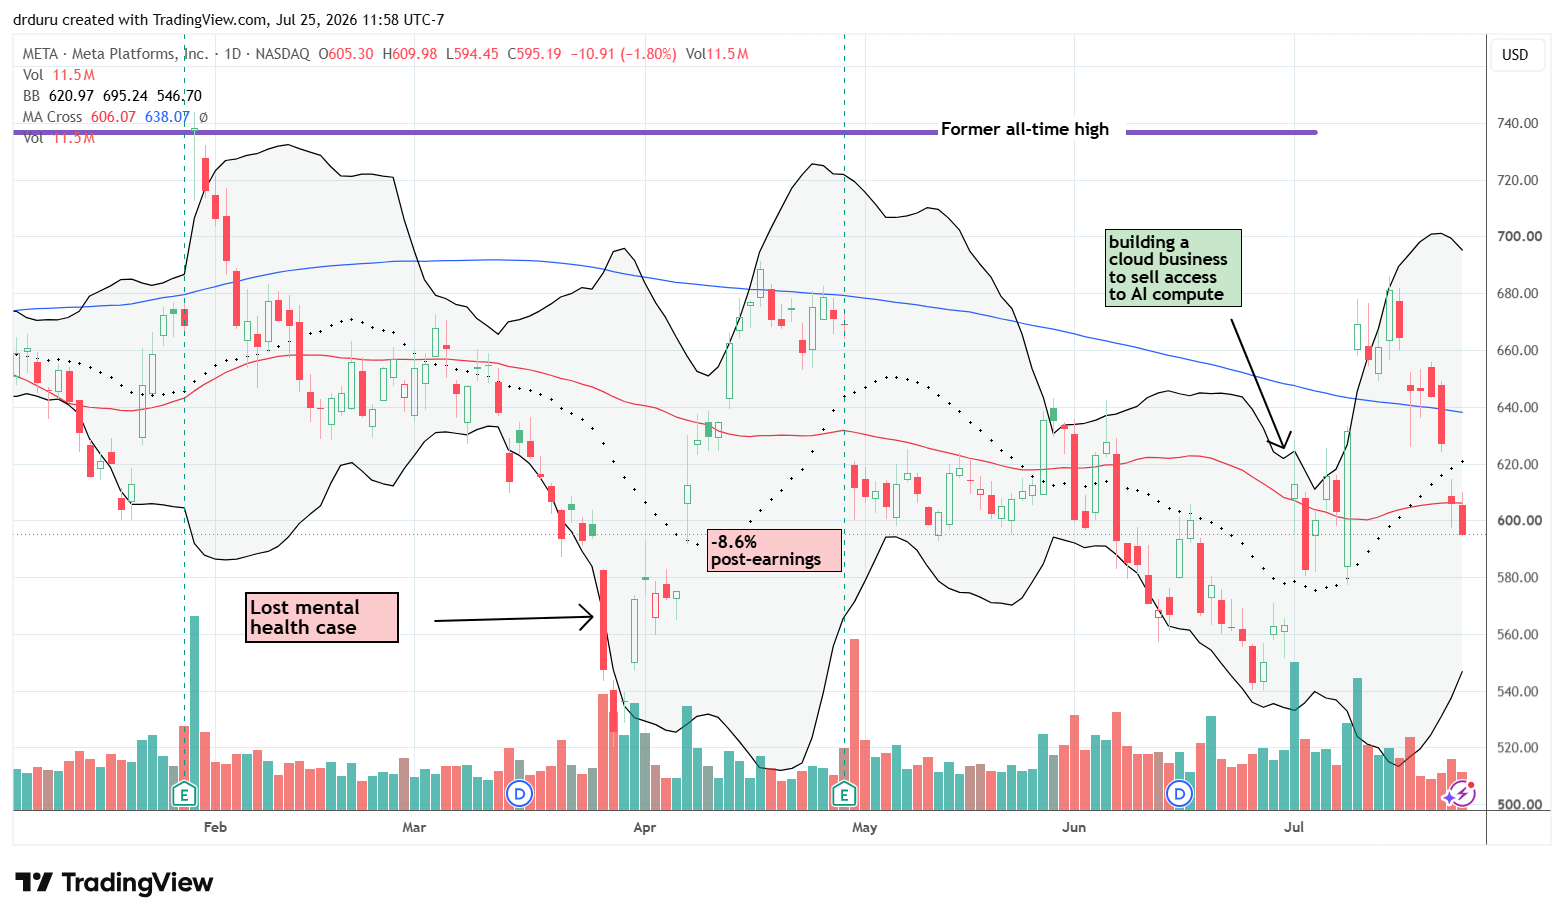
Technical status: Meta Platforms (META) pulled back with the rest of large-cap technology yet remained within its 2-year trading range.
Trade commentary: META sold off in sympathy with GOOG, losing 3.4%. Even so, I do not want to overreact because META has essentially traded sideways since 2024. The excitement that drove the rally earlier in July, fueled by AI announcements and new products, has now mostly faded.
Tesla (TSLA)
Description: Tesla, Inc. designs, manufactures, and sells electric vehicles, battery energy storage systems, and related energy products.
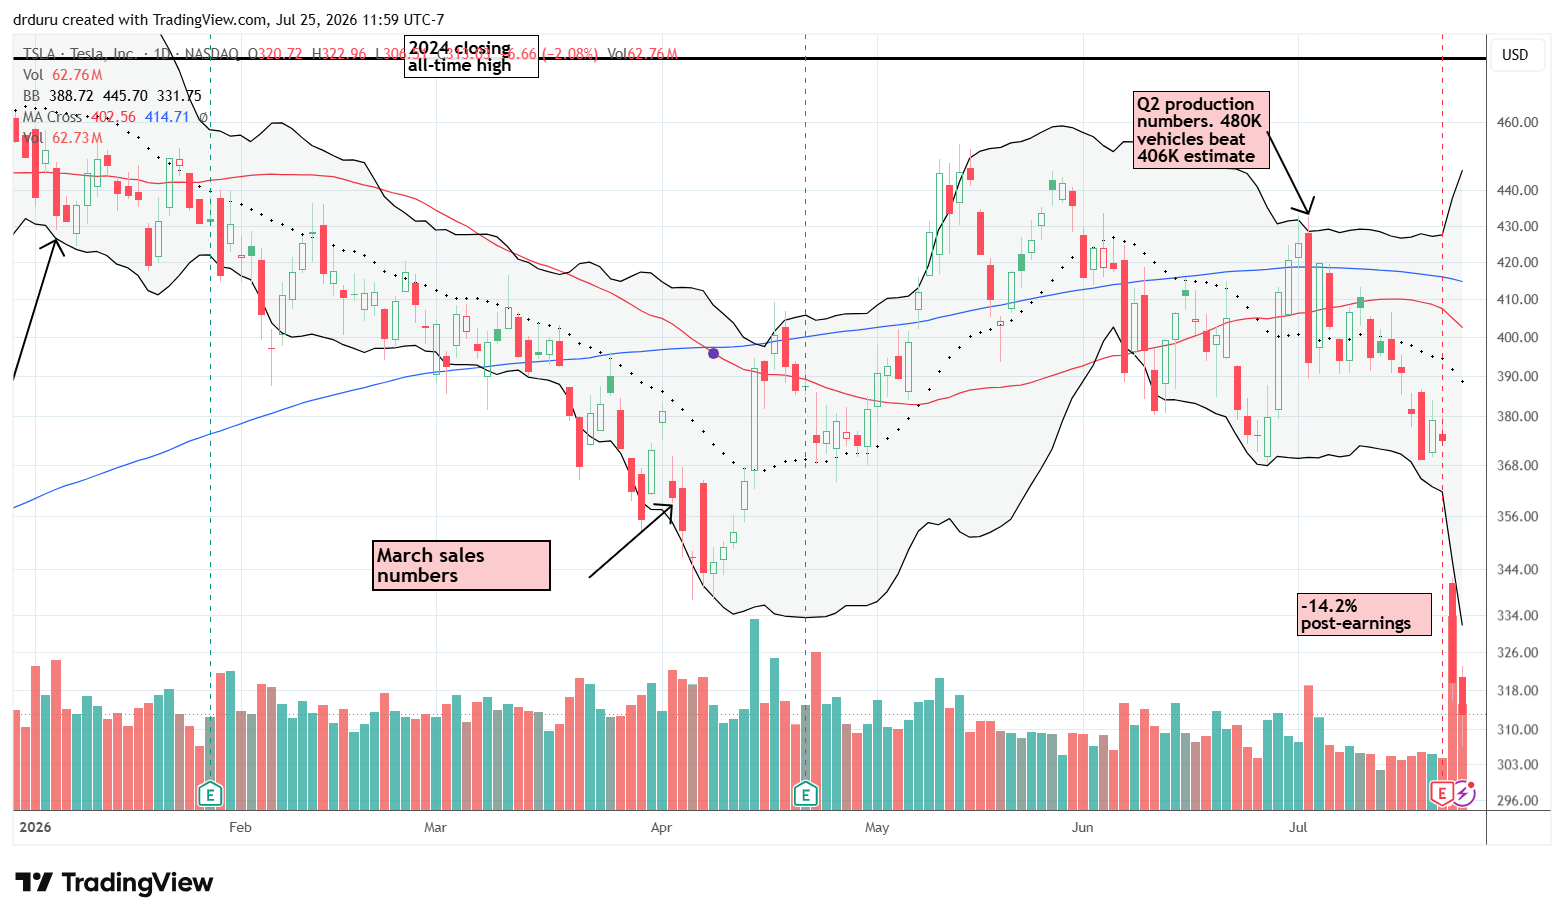
Technical status: Tesla (TSLA) suffered a 14.2% post-earnings breakdown on extremely heavy volume and remained under strong selling pressure after follow-through weakness.
Trade commentary: I have become accustomed to investors looking years into the future whenever TSLA reports earnings, so I was surprised to see such a negative reaction. TSLA dropped 14.2% after earnings and followed that decline with additional selling the next day. The accompanying volume confirmed the aggressiveness of the selling. Analyst commentary revealed a number of concerns with TSLA’s leaky report: falling margins, accelerated capex, and pushouts of Musk’s product release promises and milestones.
Thursday’s plunge allowed me to finally take profits on a TSLQ position. Next, assuming buyers will soon chase an over-extended move to the downside, I established an aggressive diagonal call spread. I am riding the long side of that position into the coming week. Friday’s continued weakness, however, left me less confident that TSLA will produce a meaningful short-term bounce.
Intel Corporation (INTC)
Description: Intel Corporation designs and manufactures semiconductor products, including processors, networking solutions, and related technologies.
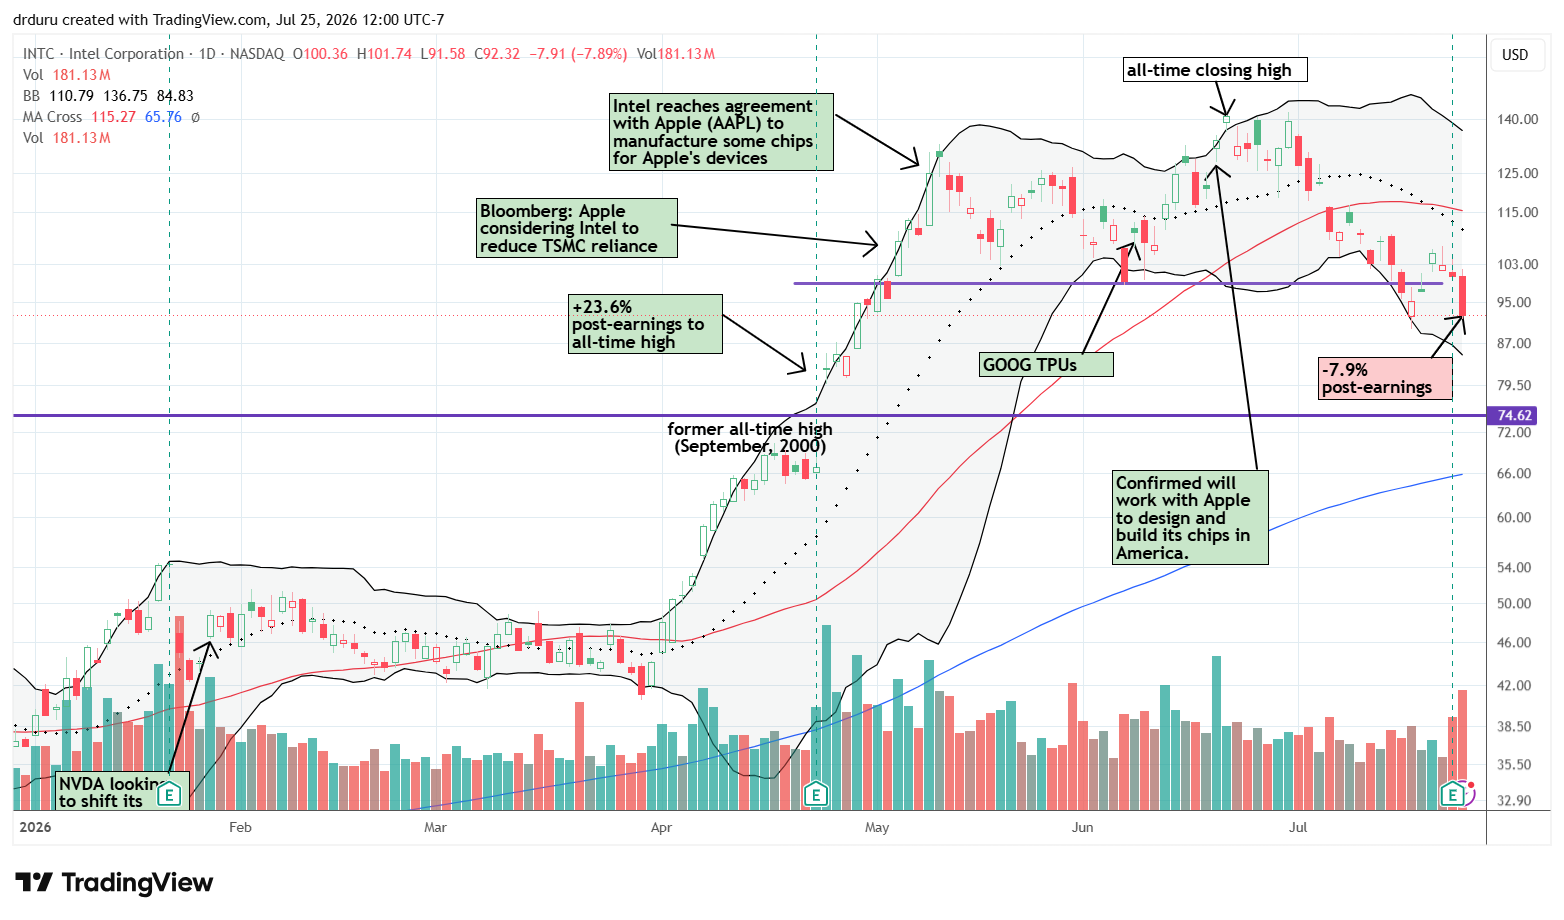
Technical status: Intel (INTC) completed a major technical reversal, closed at a new cycle low, and entered what appears to be a new downtrend.
Trade commentary: I have talked about INTC quite a bit this year because of its tremendous rally. Much of that advance depended on a steady stream of positive news flow.
I now believe INTC has topped out. In after-hours trading following its earnings report, INTC rallied a much as 5%. The next day, INTC barely opened positive before faders attacked the stock with force. The stock lost 7.9% and closed at its lowest level since late April. Moreover, INTC is in “free-fall” trading territory. I am not anticipating a swift collapse. Instead, I am noting how the nearly uninterrupted advance from April to May created little “natural” technical support. I am eyeing the former all-time high from the year 2000 and the 200DMA as the strongest candidates for upcoming support.
Micron Technology (MU)
Description: Micron Technology, Inc. develops and manufactures memory and storage semiconductor products.
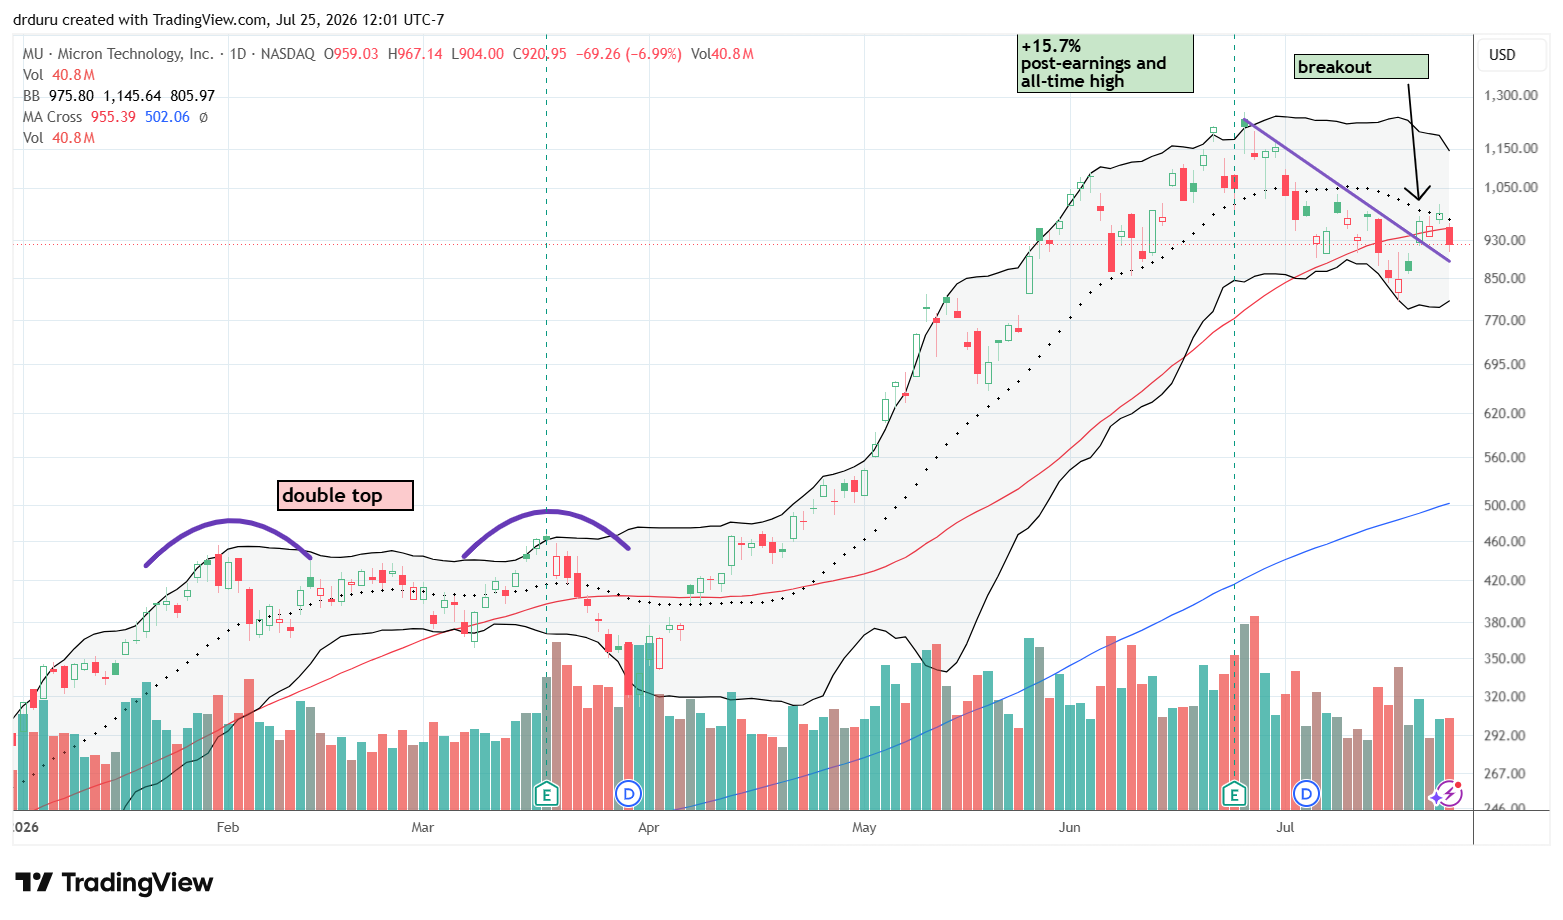
Technical status: Micron Technology (MU) failed at 20DMA resistance and ended the week with a 50DMA breakdown. The stock barely avoided a return to its previous short-term downtrend.
Trade commentary: Friday’s 7% decline shifted the technical picture from a potential fresh breakout to a near resumption of a short-term downtrend. Although MU remains a tremendous long-term winner, I think it will struggle to mount another sustained rally in the near term. My expectation is that MU and semiconductor stocks in general will continue chopping around, frustrating both bulls and bears.
Cerebras Systems (CBRS)
Description: Cerebras Systems develops AI computing systems built around wafer-scale processors for artificial intelligence training and inference.
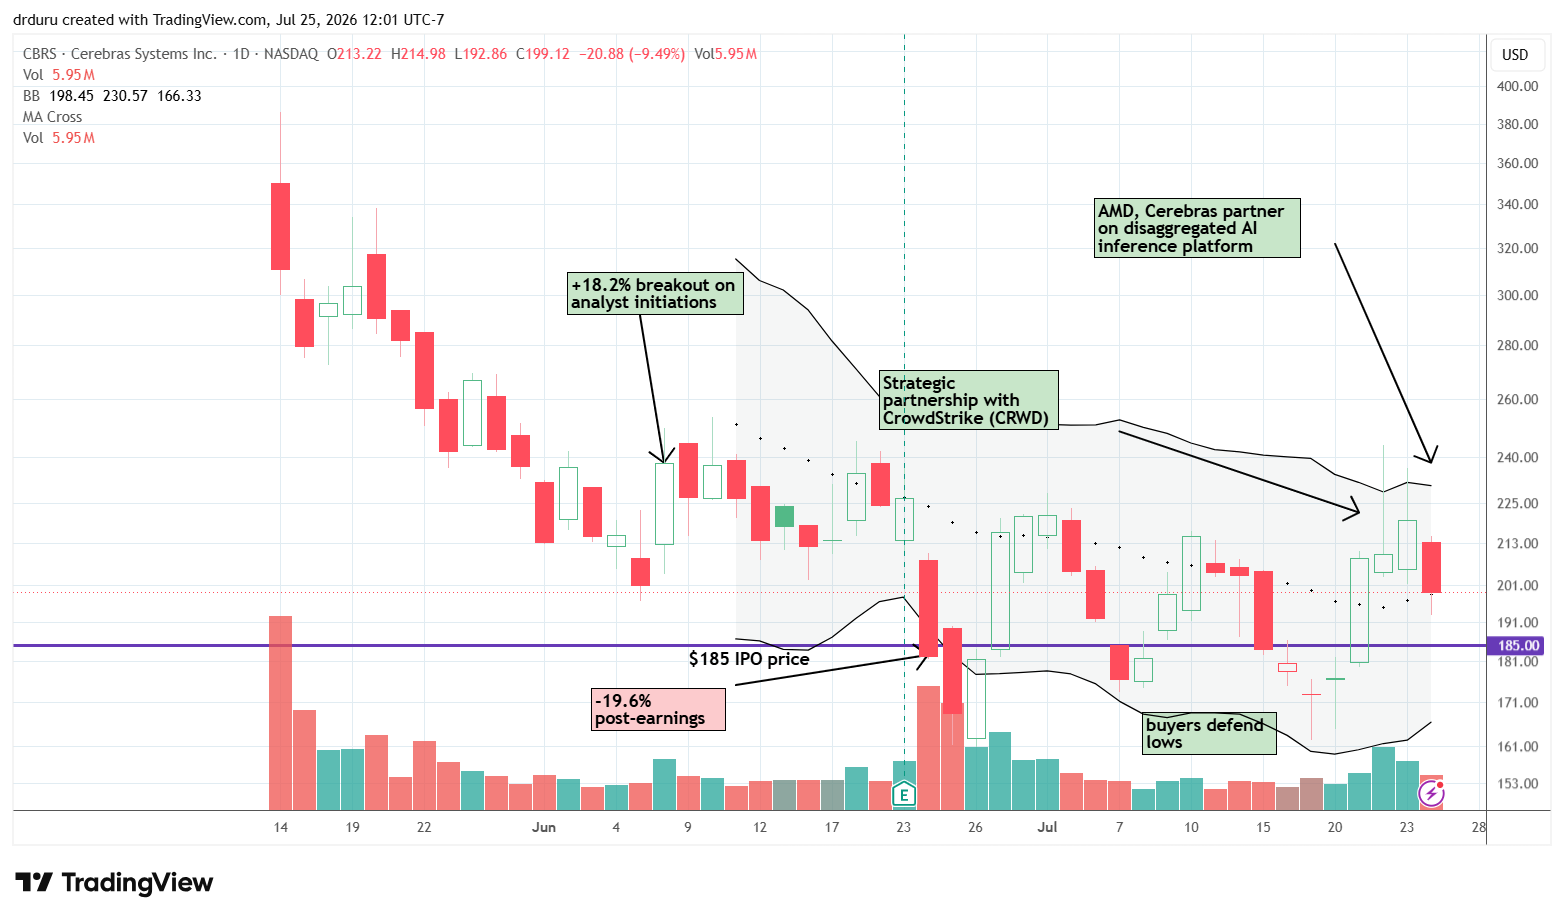
Technical status: Cerebras Systems (CBRS) appears to be bottoming with the IPO price at stake as a trading range develops.
Trade commentary: I finally managed to exit my CBRS position with a profit. My best opportunity came on Wednesday when the stock rallied as much as 17% before fading to a mere 0.6% gain. News of a strategic partnership with Crowdstrike (CRWD) seemed to get the market excited for a brief moment. I completely missed the move and would have definitely sold with the stock above its upper Bollinger Band. Lesson learned, I placed a limit sell order for $235. Buyers recharged and took CBRS above $236 the very next day. I breathed a sigh of relief because I could have easily abandoned ship at a loss after its big post-earnings loss and subsequent collapses below its IPO price.
Perhaps lessons NOT learned, I decided to jump right back into the fray on Friday. The stock tested 20DMA support (the dashed line) after losing over 9% despite more exciting news – this time a partnership with Advanced Micro Devices (AMD). I assume the deep selling in tech and AI plays overwhelmed the news cycle. However, I see a stock that could be bottoming even if it gets stuck in an extended trading range. The latest rally comes on the heels of two firm defenses of the all-time low as support.
ServiceNow (NOW)
Description: ServiceNow, Inc. provides cloud-based software that helps organizations automate digital workflows and enterprise operations.
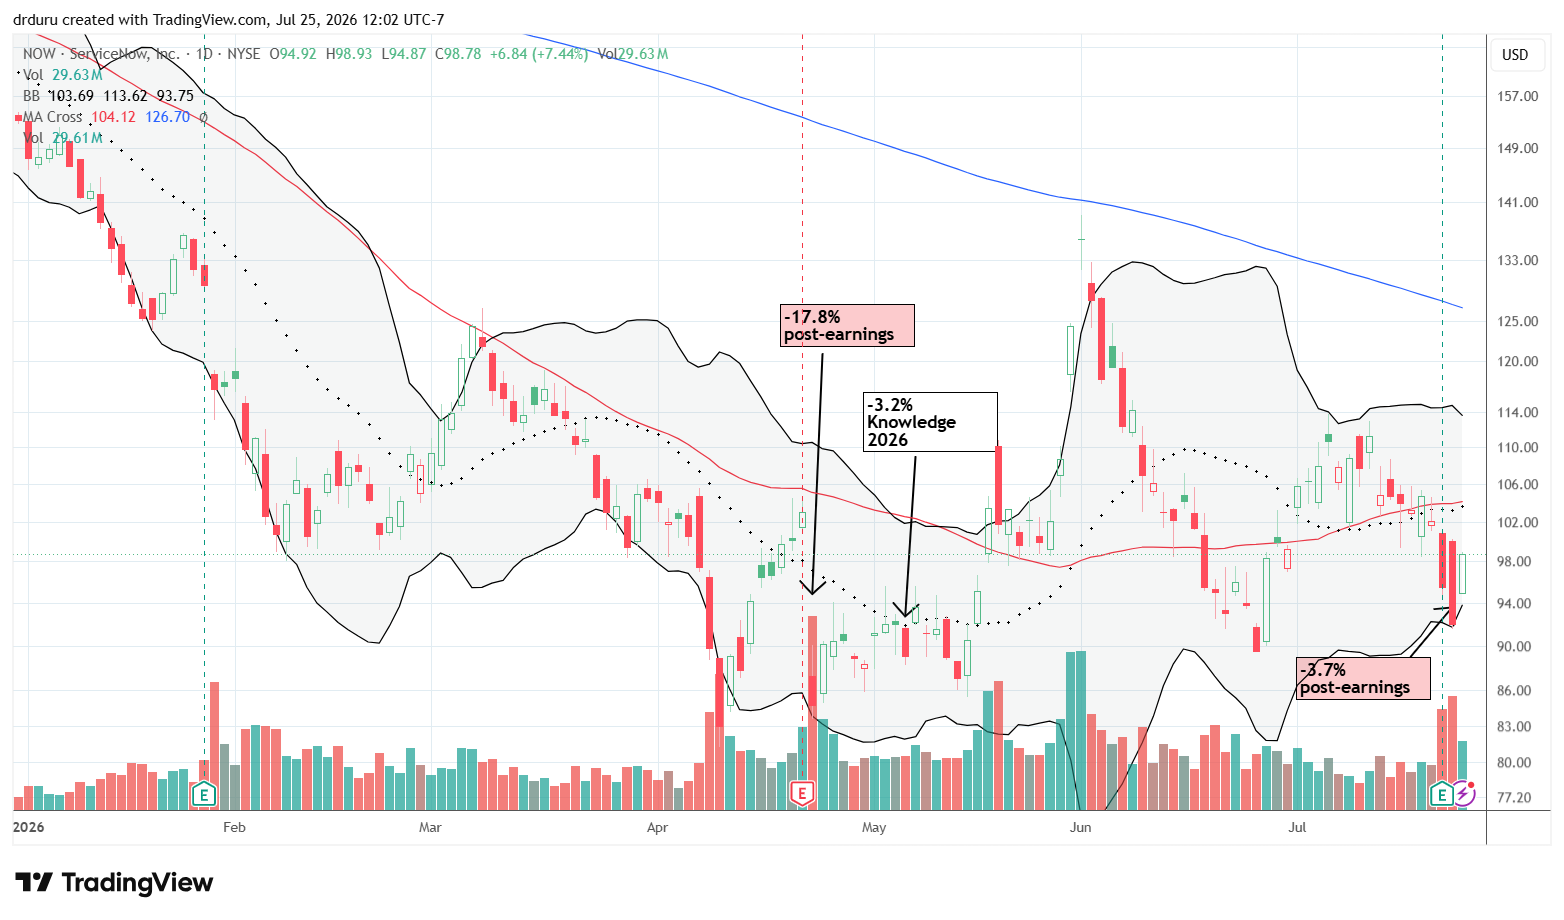
Technical status: ServiceNow (NOW) reversed sharply after earnings before rebounding the following session. All this churn below 50DMA resistance looms as a bearish development.
Trade commentary: The CEO of ServiceNow could not have been more bullish about the business, yet a skeptical market once again punished the stock. NOW initially responded well in after-hours trading. At one point, the stock completely erased Wednesday’s 6.5% decline. Unfortunately, sellers quickly took control, producing a 3.7% post-earnings loss. Friday delivered a strong 7.4% rebound, but it came too late for my pre-earnings trade. I continue to hold shares; NOW is a core position in my PAIROS trade.
Twilio (TWLO)
Description: Twilio Inc. provides cloud communications software and customer engagement platforms for businesses.
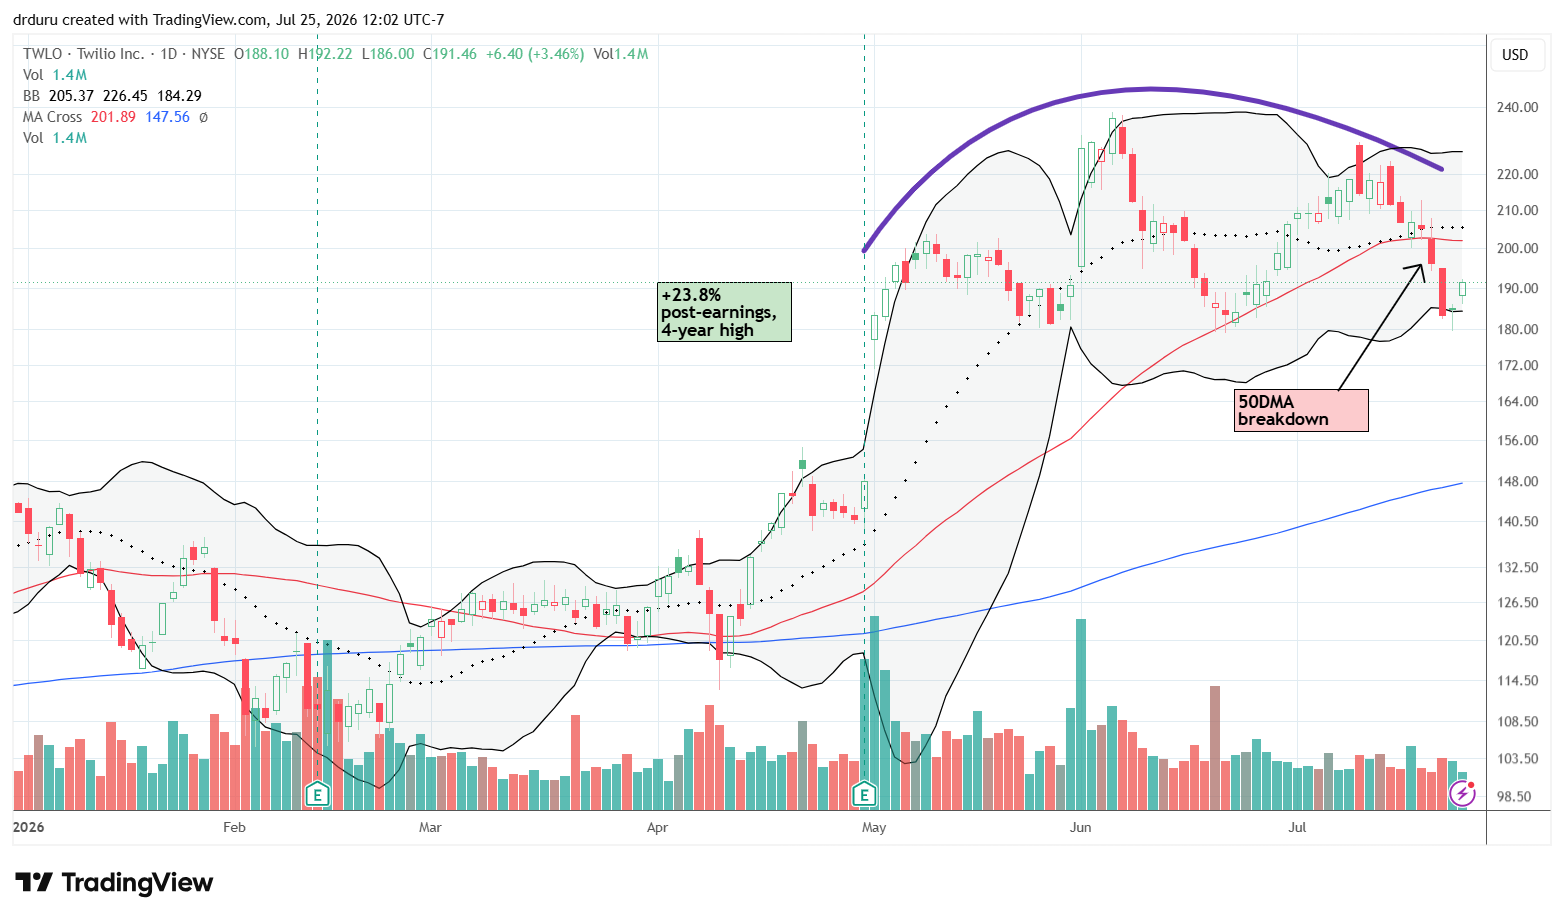
Technical status: Twilio (TWLO) confirmed a breakdown below its 50DMA in the middle of a topping pattern.
Trade commentary: TWLO managed to perfectly bounce off its June low for support, but the rebound looked weak to me. The stock appears to have topped, even though it held up better than many software names during the recent AI-driven selling. This stock is now no-touch for me until it successfully tests 200DMA support.
Rapid7 (RPD)
Description: Rapid7, Inc. develops cybersecurity software for vulnerability management, threat detection, and incident response.
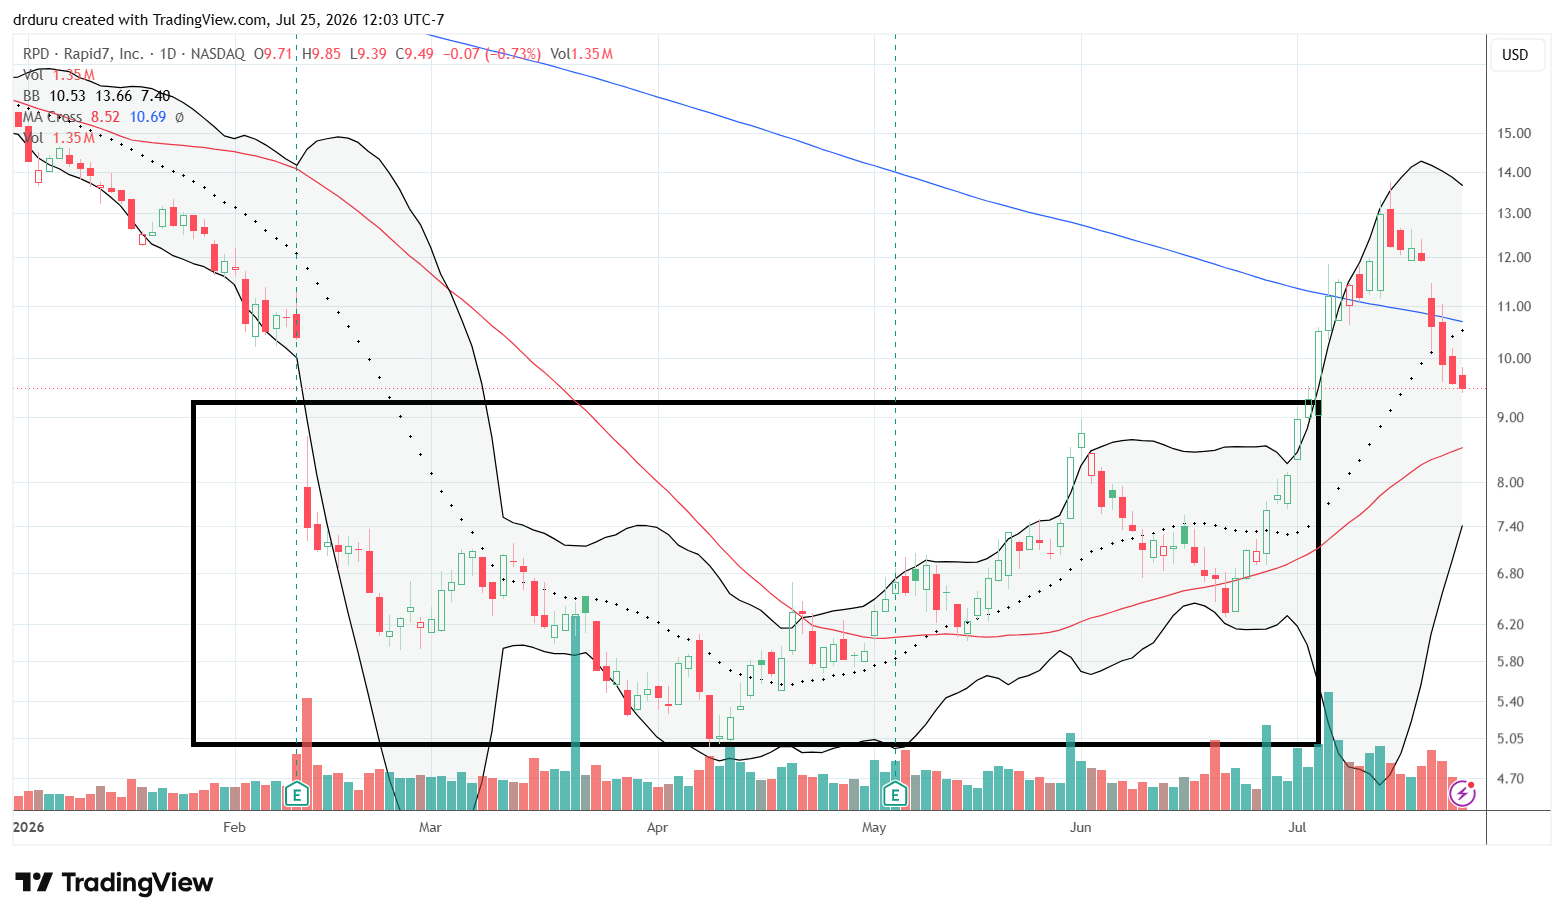
Technical status: Rapid7 (RPD) failed to hold above its 200DMA and reversed back toward its July breakout level.
Trade commentary: I had been waiting patiently for RPD to prove it could hold above its 200DMA. Instead, the stock sliced right through support, so I removed it from my buy list.
Reddit (RDDT)
Description: Reddit, Inc. operates an online platform where users create, share, and discuss content across communities.
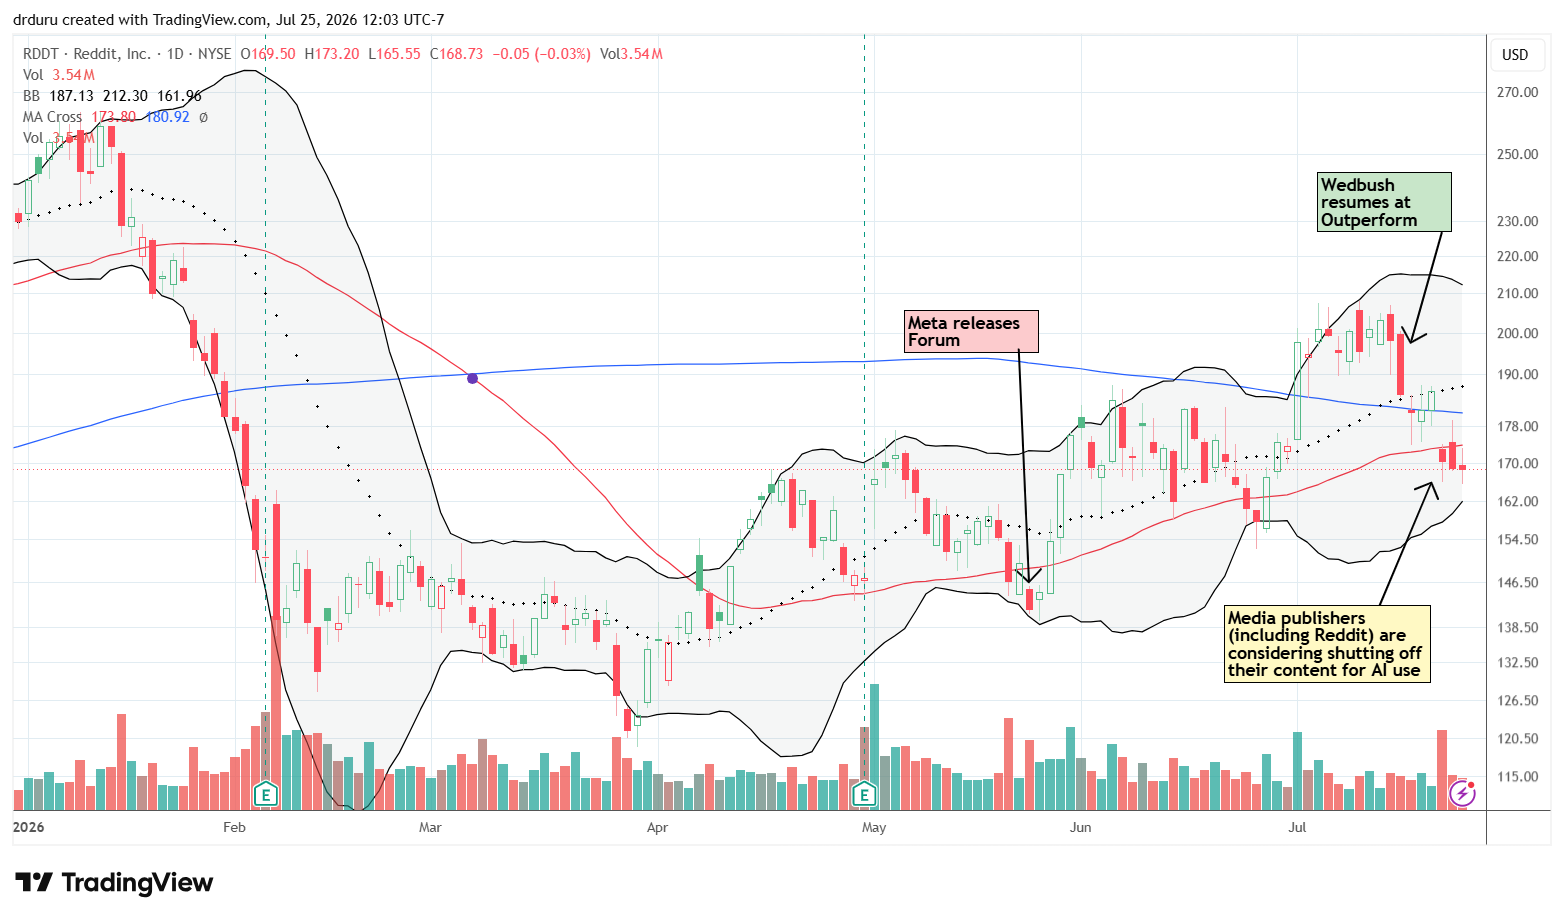
Technical status: Reddit (RDDT) suffered a news-driven 50DMA breakdown that put its series of higher lows and higher highs at risk.
Trade commentary: As planned, I bought a small number of RDDT shares after it seemed to confirm 200DMA support. Soon after investors reacted negatively to reports that publishers, including Reddit, were considering restricting AI access to their content because AI-generated summaries have reduced website traffic.
The situation is ironic because doing nothing also leaves publishers exposed to declining traffic and advertising revenue. As someone who also publishes content online, I sympathize with publishers who deserve fair compensation for the value they create. In the meantime, I am hanging on for dear life as earnings approach.
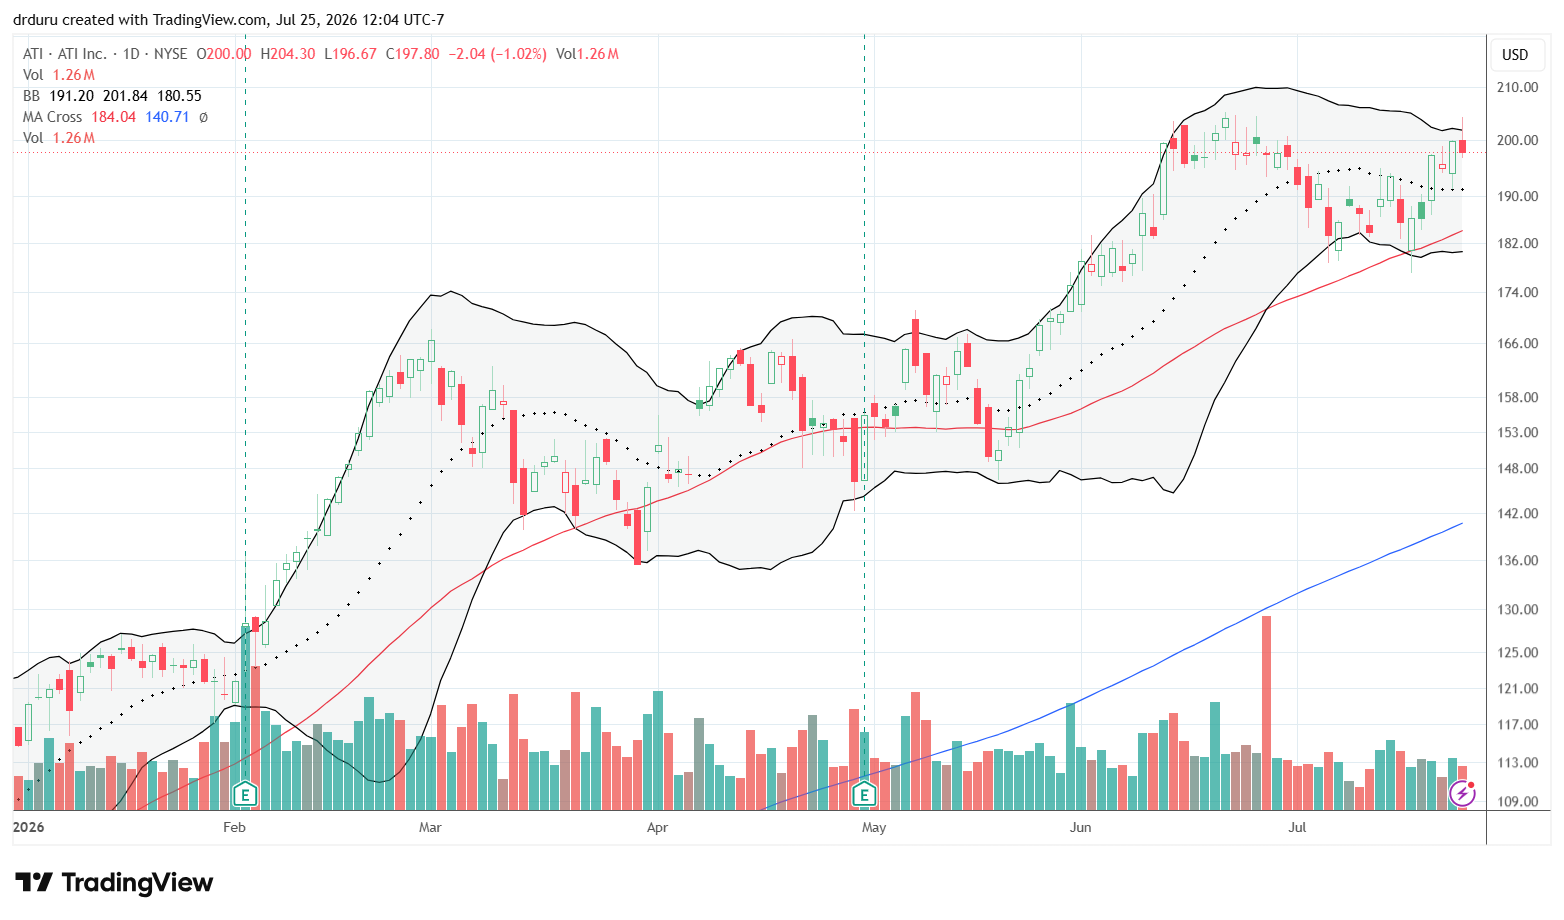
ATI Inc. (ATI)
Description: ATI Inc. manufactures specialty materials and advanced alloys for aerospace, defense, energy, and industrial markets.
Technical status: ATI (ATI) successfully held 50DMA support but stopped short of testing its all-time high.
Trade commentary: Back in March, I noted how I regretted missing buying opportunities in ATI. Well, I missed several other opportunities after that. In the previous week, I finally bought the stock on a rebound from 50DMA support. So far, so good.
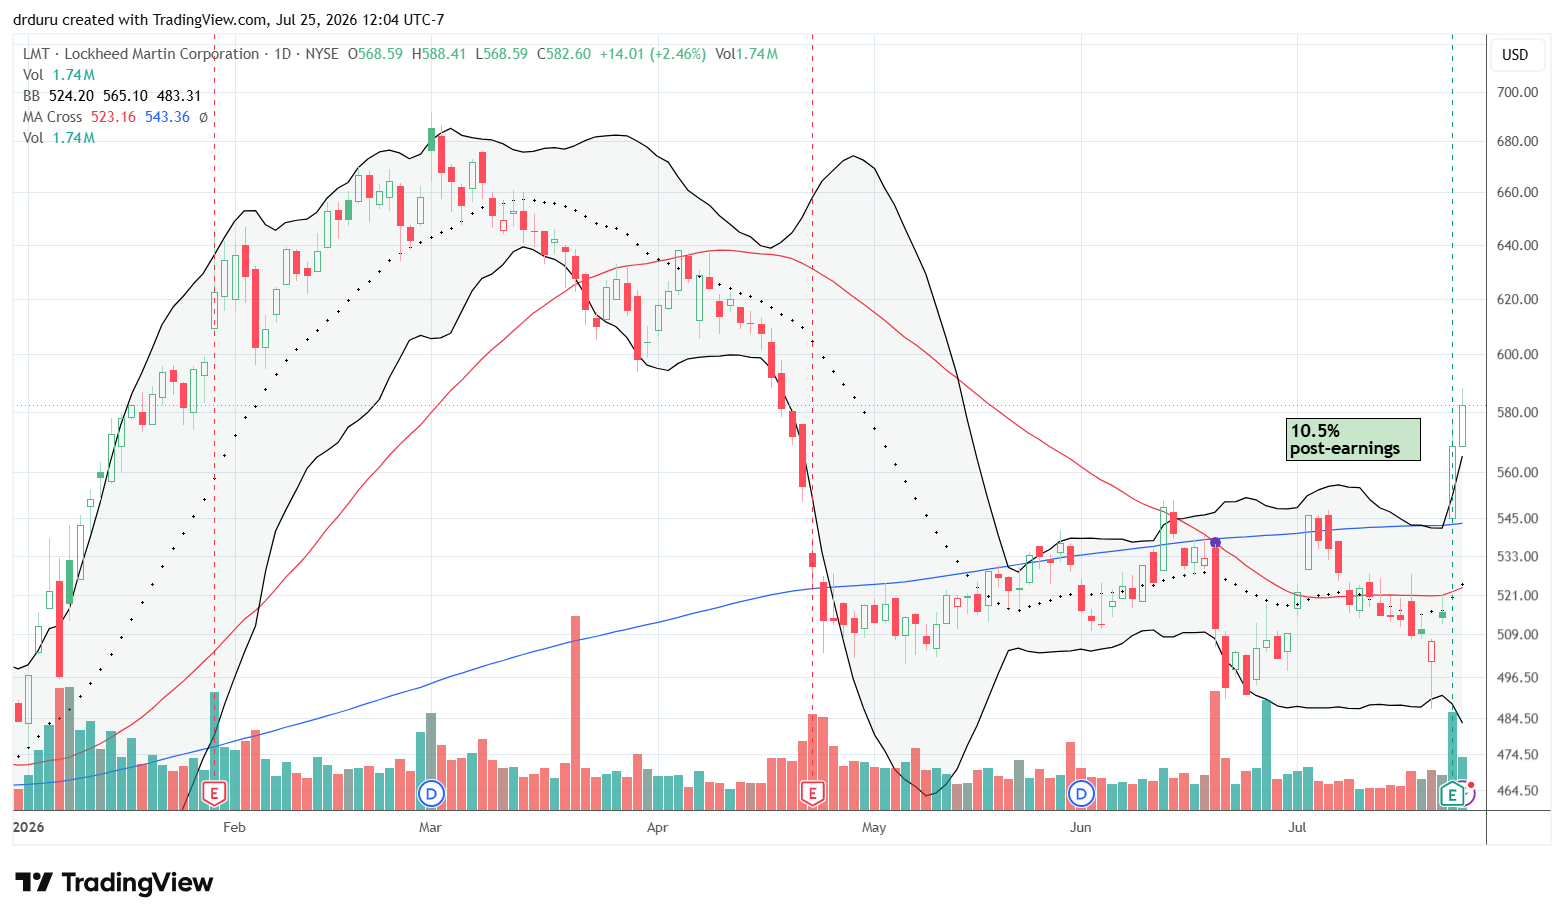
Lockheed Martin (LMT)
Description: Lockheed Martin Corporation designs, develops, and manufactures aerospace, defense, and security systems.
Technical status: Lockheed Martin (LMT) broke decisively above its 200DMA with a 10.5% post-earnings surge. The stock reinforced the bullish move with a further extension above its upper Bollinger Band.
Trade commentary: After shorting LMT based on poor technicals, I watched warily as the stock flopped around. Resistance at the 200DMA held multiple times, but sellers could not generate a resumption of downside pressure. I decided not to push my luck by holding through earnings and exited with a tiny profit. The post-earnings breakout now has me watching for a dip to buy.
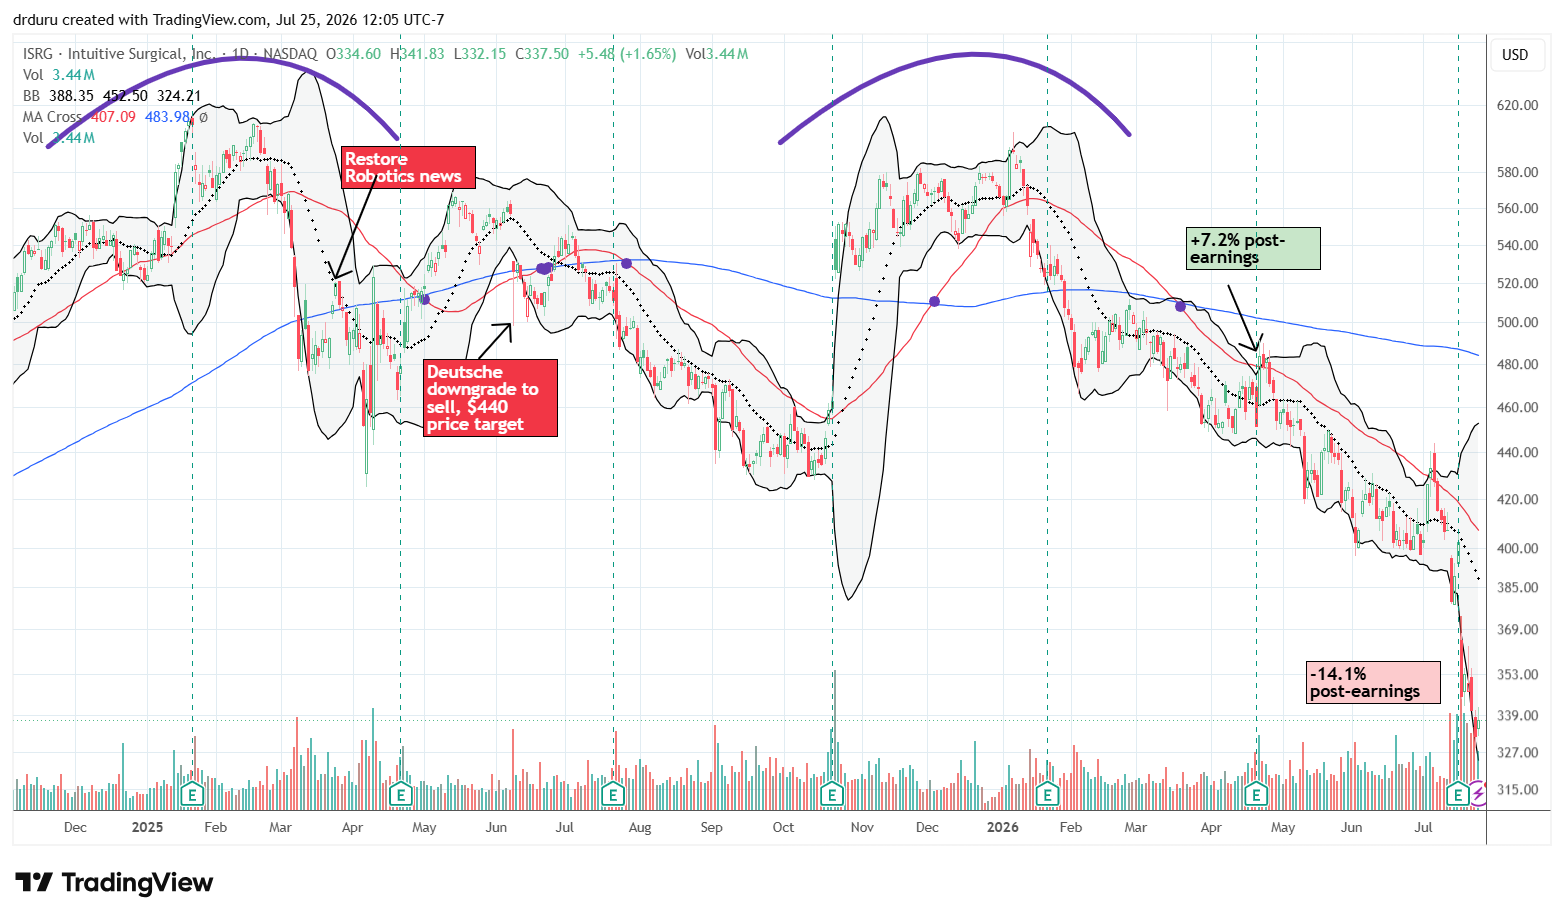
Intuitive Surgical (ISRG)
Description: Intuitive Surgical, Inc. develops robotic-assisted surgical systems and related medical technologies.
Technical status: Intuitive Surgical (ISRG) dropped to a 2 1/2-year low after a 14% post-earnings plunge.
Trade commentary: I finally admitted defeat on ISRG after the stock dropped to fresh multi-year lows. I tried holding despite a looming double-top. Now that same technical formation highlights ISRG as a broken stock. I still admire the company and its technology, but I no longer consider the stock investable given the poor trading action.
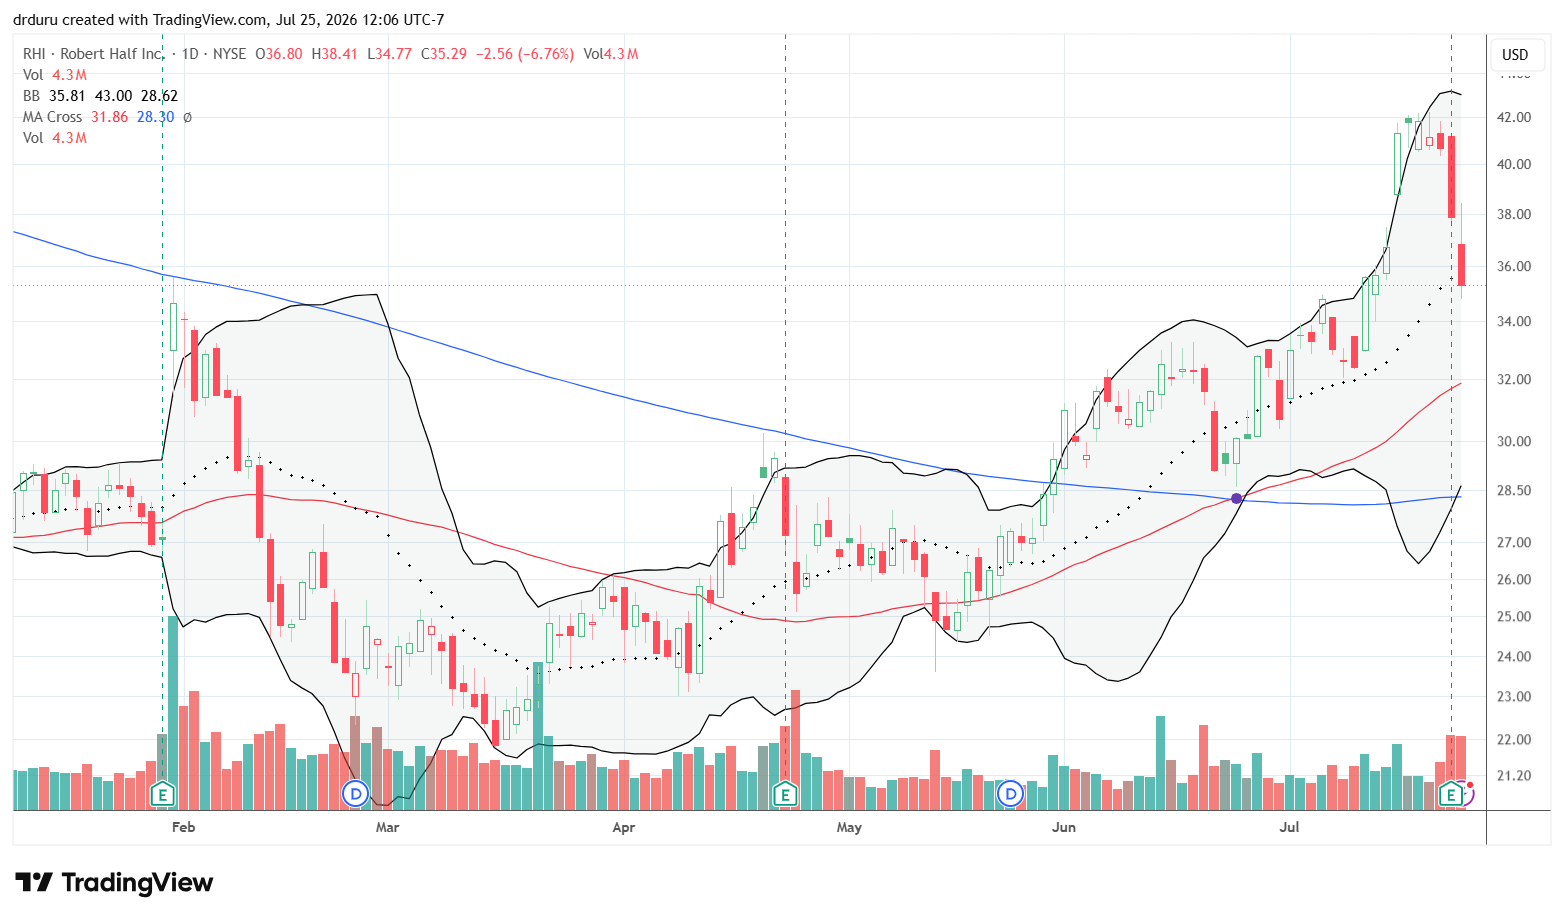
Robert Half Inc. (RHI)
Description: Robert Half Inc. provides specialized staffing and business consulting services.
Technical status: Robert Half (RHI) experienced heavy selling before and after earnings despite remaining above key moving averages.
Trade commentary: RHI looked as though it had finally turned the corner after a long decline from its 2021 peak. Instead, the stock sold off 7% before earnings and fell another 7% after reporting results. Although the longer-term technical picture has not completely broken down, I do not trust this kind of price action. If support eventually holds, there may be another buying opportunity.
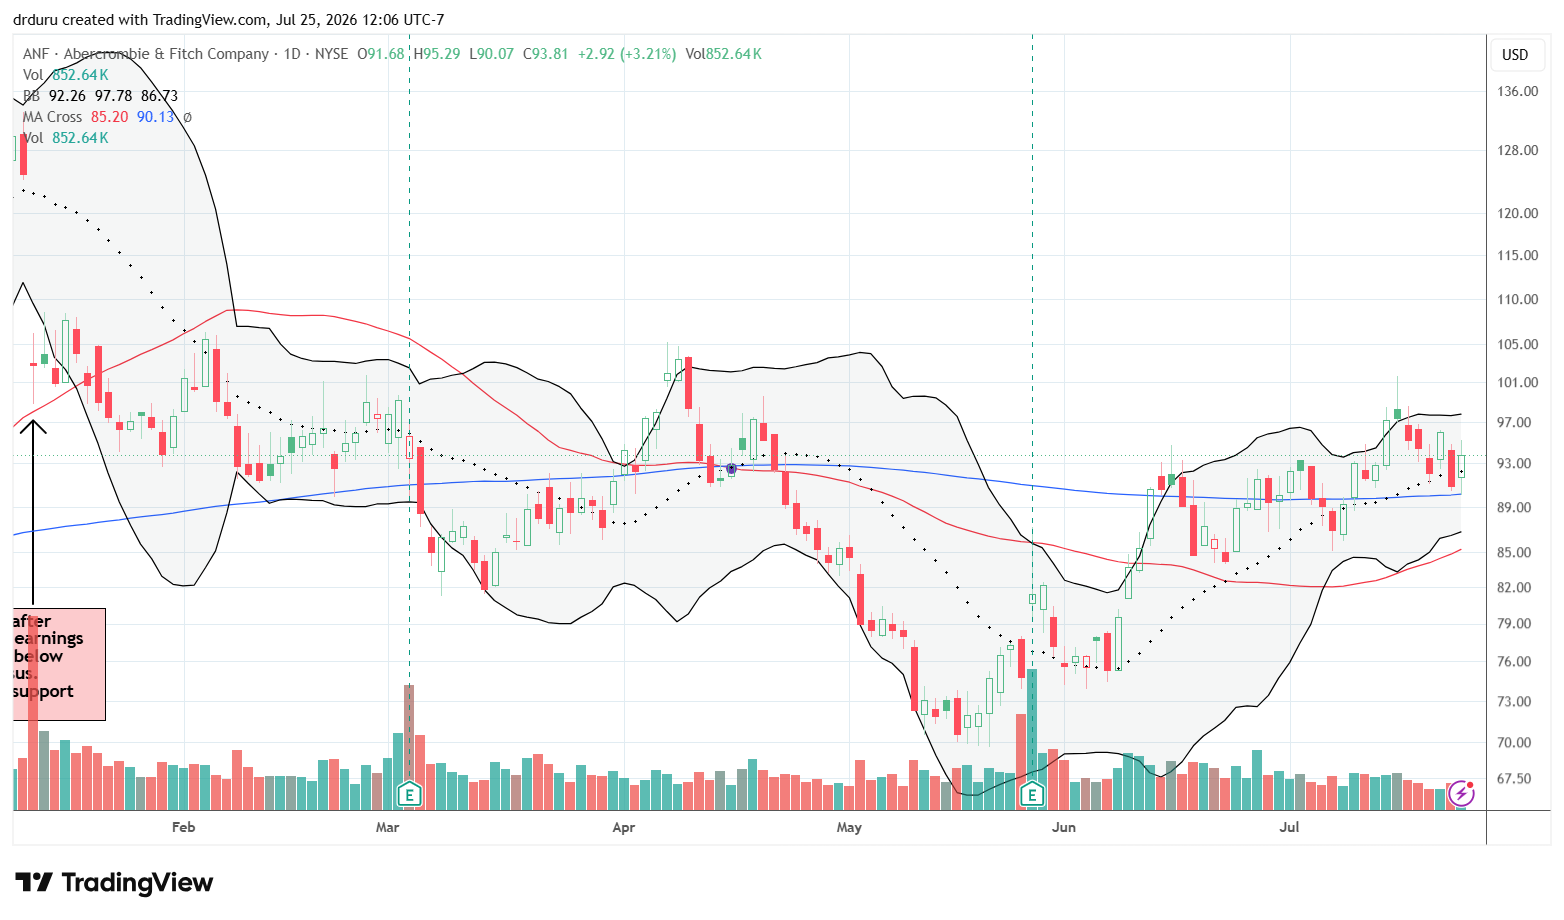
Abercrombie & Fitch Co. (ANF)
Description: Abercrombie & Fitch Co. is a specialty retailer that sells apparel, accessories, and personal care products.
Technical status: Abercrombie & Fitch (ANF) continued holding support at its 200DMA.
Trade commentary: Rising oil prices pushed retail stocks back onto my radar. Given I suspect oil could be peaking, I continue looking for buying opportunities in stocks like ANF. I bought shares near its 200DMA support. I intend to hold the position through earnings unless the technical picture significantly deteriorates beforehand.
Albertsons Companies (ACI)
Description: Albertsons Companies, Inc. operates supermarkets and grocery stores throughout the United States.
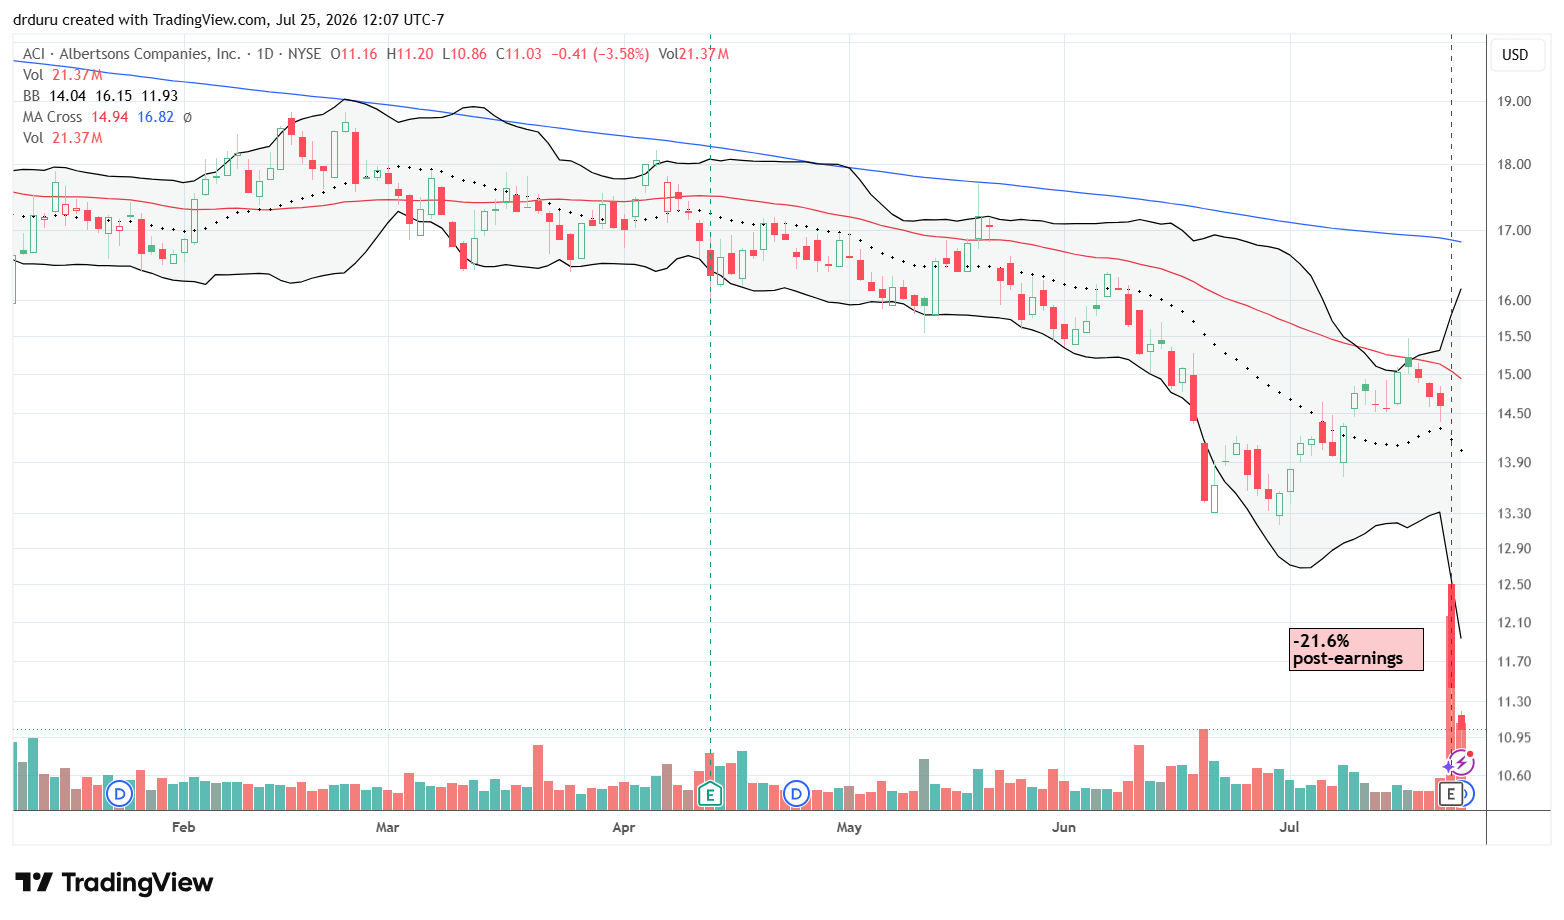
Technical status: Albertsons Companies (ACI) collapsed to a new all-time low on exceptionally heavy volume following a disastrous earnings report.
Trade commentary: ACI suffered one of the worst post-earnings reactions on my watch list. Management chose to absorb higher costs instead of passing them along to customers, resulting in lower margins. Investors responded by aggressively selling the stock.
Despite the panic, the unusually heavy volume caught my attention because it can accompany important turning points. Before I become constructive, however, I need to see a strong rally from these lows. A more convincing bottom would require ACI to close above its post-earnings opening level.
Footnotes
Subscribe for free to get email notifications of future posts!
“Above the 50” (AT50) uses the percentage of stocks trading above their respective 50-day moving averages (DMAs) to measure breadth in the stock market. Breadth defines the distribution of participation in a rally or sell-off. As a result, AT50 identifies extremes in market sentiment that are likely to reverse. Above the 50 is my alternative name for “MMFI” which is a symbol TradingView.com and other chart vendors use for this breadth indicator. Learn more about AT50 on my Market Breadth Resource Page. AT200, or MMTH, measures the percentage of stocks trading above their respective 200DMAs.
Active AT50 (MMFI) periods: Day #252 over 20%, Day #79 over 30%, Day #75 over 40%, Day #30 over 50% (overperiod), Day #52 under 60%, Day #225 under 75%
Source for charts unless otherwise noted: TradingView.com
Full disclosure: long IWM calls, long QQQ call spread, long USO put spreads and short a call spread, long TSLA call, lopng CBRS, long NOW, long RDDT, long ANF, long ATI, long TLT
FOLLOW Dr. Duru’s commentary on financial markets via StockTwits, BlueSky, and even Instagram!
*Charting notes: Stock prices are not adjusted for dividends. Candlestick charts use hollow bodies: open candles indicate a close higher than the open, filled candles indicate an open higher than the close.
* Blog notes: this blog was partially written based on the heavily edited transcript of the following video that includes a live review of the stock charts featured in this post. I used ChatGPT to process the transcript.