
{revised August, 2024}
The Most Dangerous Months
The stock market’s most dangerous months are August, September, and October. Since 1951, the S&P 500 (SPY) has suffered its three highest average maximum drawdowns in these months. A drawdown occurs when sellers put downward pressure on prices. The maximum drawdown is the largest (most negative) such loss over a given time period based on closing prices. Traders and investors should care about drawdowns because drawdowns define risk of loss. However, drawdowns also reveal opportunity for buy-low, sell-high trading. Traders and investors should embrace the stock market’s most dangerous months rather than fear them especially when combined with oversold trading conditions.
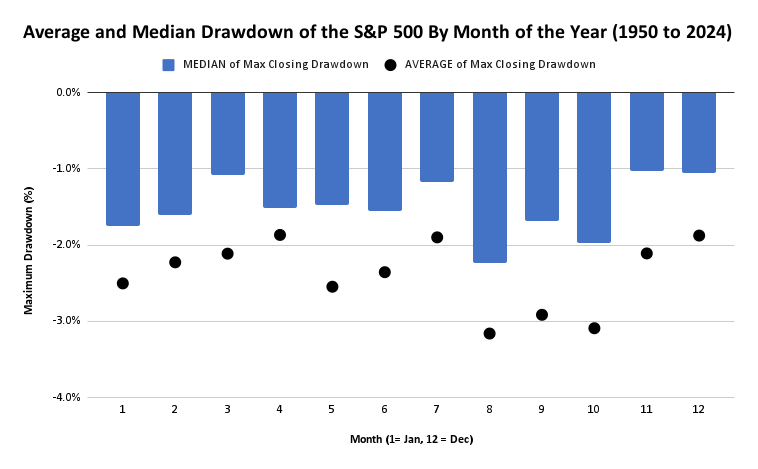
The above chart (updated August 27, 2024, spreadsheet here) shows the average maximum drawdown for each month from 1951 to 2024 as black dots. The averages for August, September, and October are -3.2%, -2.9%, and -3.1% respectively. May is a close fourth at -2.5% (for reasons to avoid fearing May, see “Sell In May and Go Away: Now A Throwaway Adage“).
Average vs Median Drawdowns
The blue bars in the chart represent the median maximum drawdown for a given month. The median defines the halfway point in a set of data. For example, August has the largest median maximum drawdown at -2.2%. Half of the drawdowns for August occurred below -2.2%; the other half occurred above -2.2%. The median eliminates the skew caused by extreme outliers. If 2024 delivers a -25% maximum drawdown for September, and 2025 delivers a -1% maximum drawdown for September, then the resulting September median remains exactly the same at the current -1.7%.
The difference between the average and the median is significant. The most dangerous months based on the median are January, August, and October. September falls behind January and is essentially the same as February. In other words, September is a month when outliers are more common. Thus, September is more risky than January and February. The median provides an anchor for assessments with outlier scenarios removed from the equation. That is, if outliers are somehow not a concern for a given month, the median provides the number for guiding trading decisions.
How To Trade Dangerous Months
The stock market swings between cycles of greed and fear. When the stock market is in greedy mode going into the most dangerous months, traders and investors should tread with extreme caution. Put options with September and October expirations make sense, especially if the volatility index (VIX) is low (options tend to be cheaper with a low VIX). Bears can stay patient with short positions.
The trading rules are trickier if the stock market stumbles into the most dangerous months. Big drawdowns in August and/or September may serve to confirm a bearish period for the stock market. I use indicators of market breadth to identify oversold conditions for buying.
In almost any scenario, traders and investors should have a bias toward buying big October drawdowns. The risks in the stock market tend to decline from there. Short-term traders can take profits in the next rally. Longer-term investors can hopefully enjoy a cushion to buttress smaller drawdowns in subsequent months.
How to Trade After A Mild August
Year-after-year pundits who are already aware of the data raise warnings about the most dangerous months. So what happens if August fails to live up to bearish expectations? In 2021, the maximum drawdown for August was a mere -0.2%. In 2020, not a single day in August closed below the last trading day of July; such a run-up creates the rare positive maximum drawdown. Does this kind of complacency about the most dangerous months create pent-up energy for selling? The data says “yes.”
The charts below show what happens to the median and average maximum drawdowns in years when August’s maximum drawdown is anywhere below the median value. In both scenarios, selling pressure increases for October and November. Interestingly, September is no more dangerous for drawdowns. This month is actually milder (less risky) for the average maximum drawdown. The year 2020 was an instructive exception, as September’s maximum drawdown was -7.5% while October’s was -2.8%. November and December returned positive maximum drawdowns. Of course, 2020 was an exceptional election year as well.
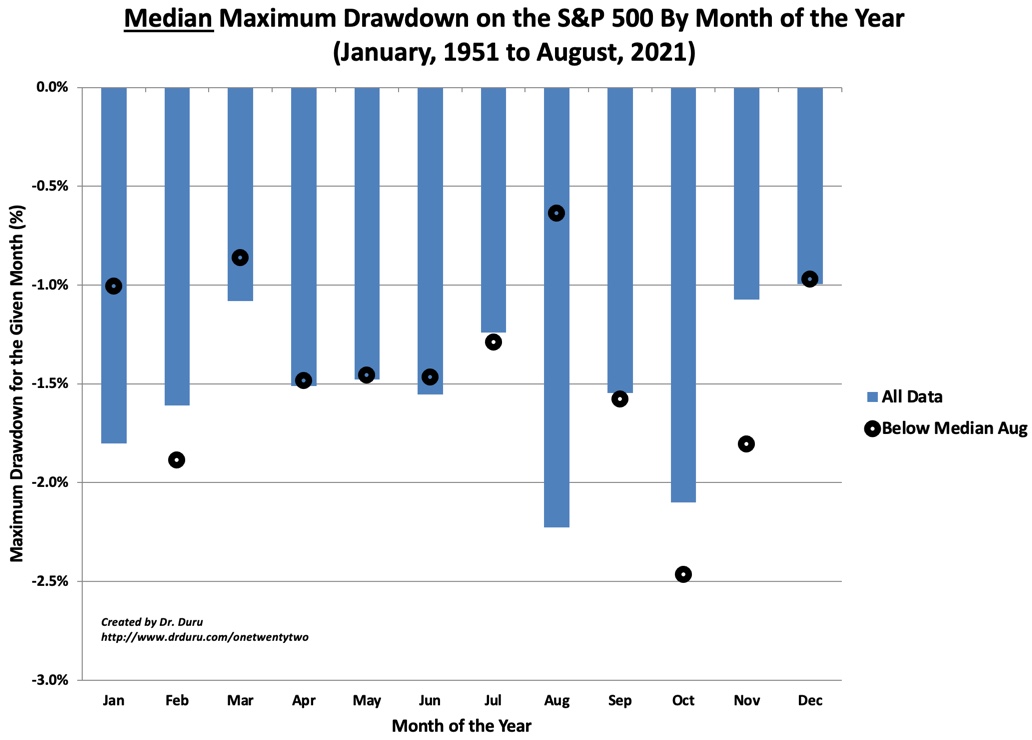
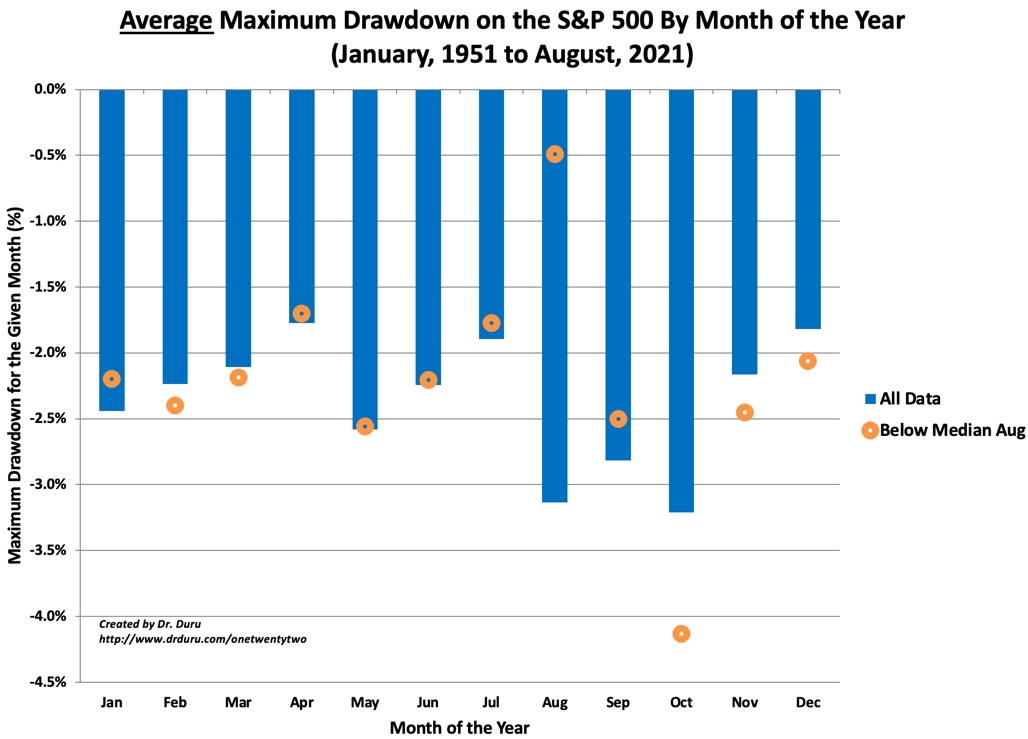
In other words, do not fall deeper into complacency after a mild August and then a mild to normal September. Given October and November become significantly more dangerous after a mild August, the imperative increases for protective put options. Bearish traders will likely find ample profit opportunities in fading rallies ahead of October and/or November. Long-term investors should consider selling call options against existing positions.
Conclusion
Remember that historical patterns do not guarantee future outcomes. However absent more compelling evidence, strong historical patterns provide important guidance. The most dangerous months represent a well-established seasonal patterns of drawdowns. They deserve close attention from every trader and investor. See TradingView for a further discussion on seasonal patterns in financial markets.
Be careful out there!
Full disclosure: no positions
4 thoughts on “How to Trade During the Stock Market’s Most Dangerous Months”