
AT40 = 7.9% of stocks are trading above their respective 40-day moving averages (DMAs) (28th oversold day)
AT200 = 6.7% of stocks are trading above their respective 200DMAs (new low for the oversold period)
VIX = 45.2
Short-term Trading Call: cautiously bullish
Stock Market Commentary
Today’s dose of hope comes in the form of definitive breakouts.
No sooner did I grumble about green shoots failing at the stiff resistance of 20-day moving averages (DMAs), stocks came alive in a major display of buying force. Not only did the major indices punch through resistance, but also they closed at new highs for the rebound move off March’s bottom. The green shoots were everywhere again as 688 stocks popped through their 20DMAs.
Oversold
I call the stock market oversold when AT40 (T2108), the percentage of stocks trading above their 40DMAs, closes below 20%. The current historic oversold period has lasted an incredible 29 days. This oversold period is the second longest on record (since 1986). Monday’s rally gives me fresh hope that this oversold period will end before setting a new record.
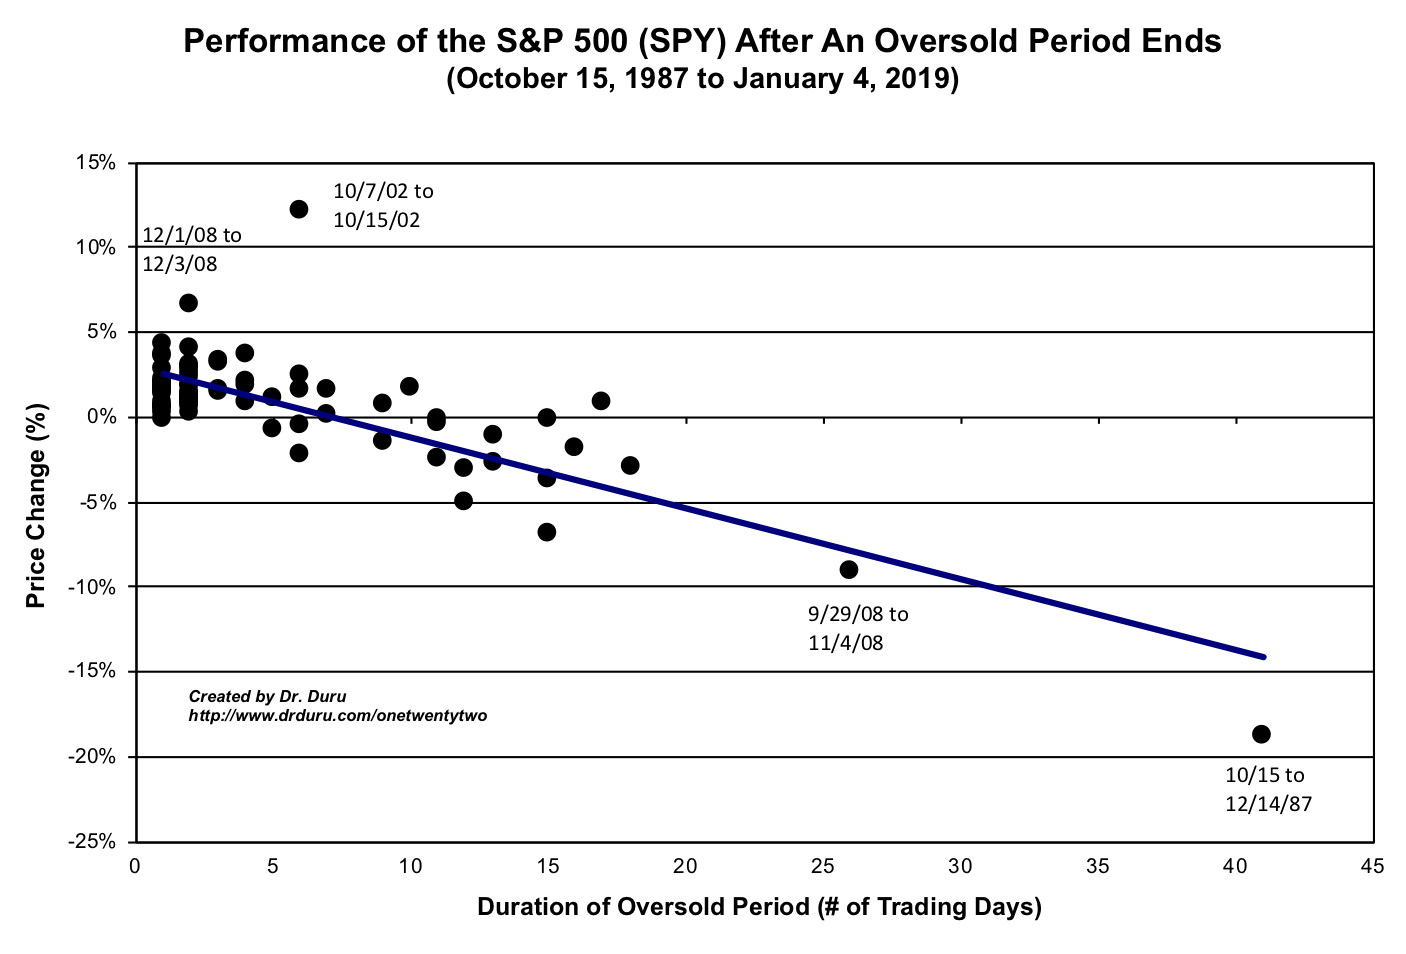
Since the first oversold day, the S&P 500 (SPY) has lost 14.5%. Per the chart below, the index still has theoretical upside potential if it can end in the next 4 to 5 trading days. With Friday looming as a trading holiday for Easter, this race will be a close call!
The Stock Market Indices
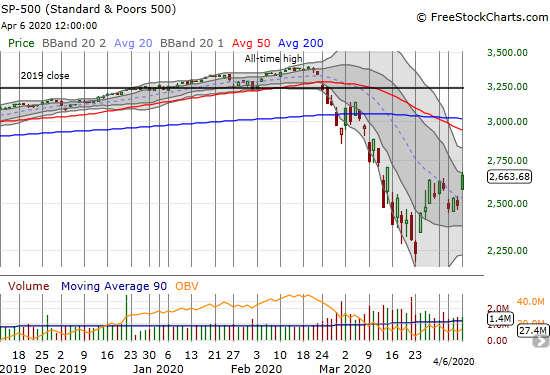
The S&P 500 (SPY) soared 7.0% and closed at its highest point since March 13th. The index gapped over 20DMA resistance and never looked back. This move puts overhead resistance from the 50DMA into play. Per my last technical observations, the index is now in a bullish clearing (above 2600). At the time of writing currency markets and stock futures are supporting another gap open for Tuesday morning. Such a move and a positive close would seal a confirmation of the breakout.
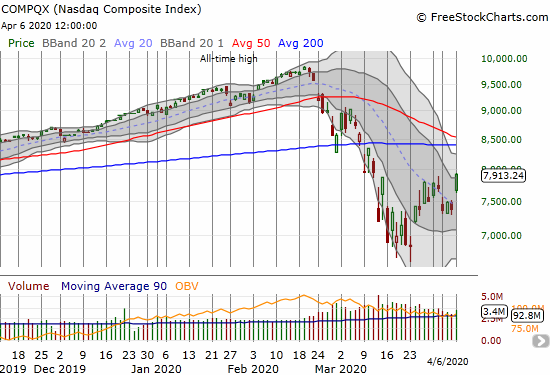
The NASDAQ (COMPQX) raced higher to a 7.3% gain and pulled off the same tricks as the S&P 500. Converging overhead resistance from the 50 and 200DMAs are now in play for the tech-laden index.
Volatility
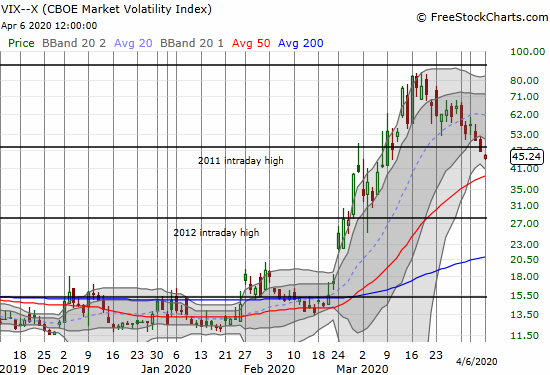
The volatility index (VIX) made a mild bullish divergence last Friday, and Monday confirmed the signal. The VIX fell another 3.3%. This was of course a very mild move for such a bullish day. The VIX is still bracing us for daily big down AND up moves.
The Short-Term Trading Call
I find it very ironic that the stock market finally pulled off the kind of day that puts true fear into the hearts and minds of bears and sellers. A gap up Monday with no look back is about the most powerful move possible during a comeback rally. Before this breakout, it was easy for observers to assume the rally off the bottom was a simple dead-cat bounce. I am guessing so many people (like me!) were staring so hard at the failed resistance at the 20DMA that they forgot to think about the possibilities of a breakout.
Now that the market is here, I am still maintaining my trading call at “cautiously bullish.” If not for the macro-economic outlook in the wake of the coronavirus pandemic, I would dare to declare a confirmed bottom in the stock market. Instead, I still have low expectations for the market after the oversold period finally ends. A simultaneous test of overhead 50 and/or 200DMA resistance would really dampen my expectations. Of course, a breakout above those levels would be a fresh bullish sign, but one step at a time.
Stock Chart Reviews – Below the 50DMA
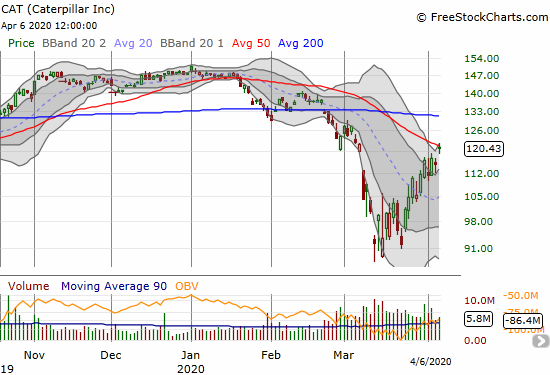
Caterpillar (CAT)
A lot of things amazed me during Monday’s move. Caterpillar (CAT) is one of many. CAT popped 5.0% and perfectly tested 50DMA resistance. Looking back, CAT has gradually churned nearly straight up from its March lows. No need for me the refresh my CAT put backstop unless CAT fails at resistance here.
Stock Chart Reviews – Above the 50DMA
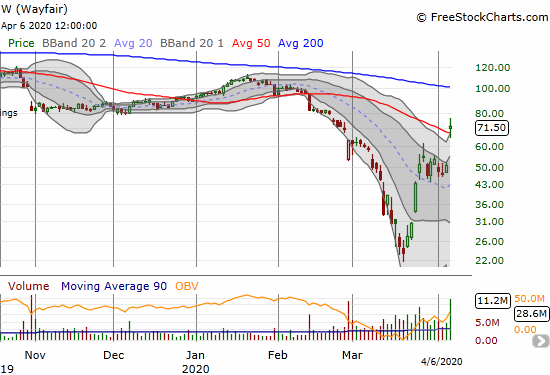
Wayfair (W)
Wayfair (W) pulled off a startling 41.2% gain. Wayfair gapped up over its 50DMA and surely left a LOT of sellers and shorts stranded at lower prices. The key tell here, and one I wish I noticed earlier, was that Wayfair was comfortably consolidating ABOVE its 20DMA waiting for an excuse to continue it upward move.
— – —
FOLLOW Dr. Duru’s commentary on financial markets via email, StockTwits, Twitter, and even Instagram!
“Above the 40” uses the percentage of stocks trading above their respective 40-day moving averages (DMAs) to assess the technical health of the stock market and to identify extremes in market sentiment that are likely to reverse. Abbreviated as AT40, Above the 40 is an alternative label for “T2108” which was created by Worden. Learn more about T2108 on my T2108 Resource Page. AT200, or T2107, measures the percentage of stocks trading above their respective 200DMAs.
Active AT40 (T2108) periods: Day #29 under 20% (oversold day #29), Day #30 under 30%, Day #41 under 40%, Day #32 under 50%, Day #51 under 60%, Day #55 under 70%
Daily AT40 (T2108)
")
Black line: AT40 (T2108) (% measured on the right)
Red line: Overbought threshold (70%); Blue line: Oversold threshold (20%)
Weekly AT40 (T2108)

*All charts created using FreeStockCharts unless otherwise stated
The T2108 charts above are my LATEST updates independent of the date of this given AT40 post. For my latest AT40 post click here.
Be careful out there!
Full disclosure: long QQQ shares, long SSO, short UVXY shares, long CAT puts
*Charting notes: FreeStockCharts stock prices are not adjusted for dividends. TradingView.com charts for currencies use Tokyo time as the start of the forex trading day. FreeStockCharts currency charts are based on Eastern U.S. time to define the trading day.