
(Updated on January 3, 2023 in “How Home Builder Stocks Trade In A Seasonal Pattern“)
The Spring selling season is a critical period for the housing market and usually delivers peak activity for the year. This seasonal pattern forms a notable pivot for the stocks of home builders. These stocks typically rally on the wings of optimism going into Spring. This rally is often strong enough to outpace the S&P 500 (SPY) from November to March/April. Once all the potentially good news is priced in, the stocks next run out of gas and at best drift through the summer and early Fall (relative to the S&P 500).
If the news coming out of Spring comes short of expectations and/or fails to provide fresh catalysts for go-forward optimism, home builder stocks become vulnerable to sell-offs. These dynamics form the seasonal patterns for trading the stocks of home builders. I call it “the seasonal trade on home builders.”
These patterns are well understood by those who follow the housing market and the stock market. Years ago, I took one analyst study to form my own assessment of the trade. I confirmed that the time to buy home builders is in October or November almost no matter what has happened in the market in the prior months. The selling decision is more important than the buying decision. Last year, the time to sell was just ahead of the official end of the seasonal trade. Other years, the trade lasts all the way through April. Over the years since the Great Recession, the bulk of the profits on the trade occur from November to January. The following visualizations display the seasonal patterns.
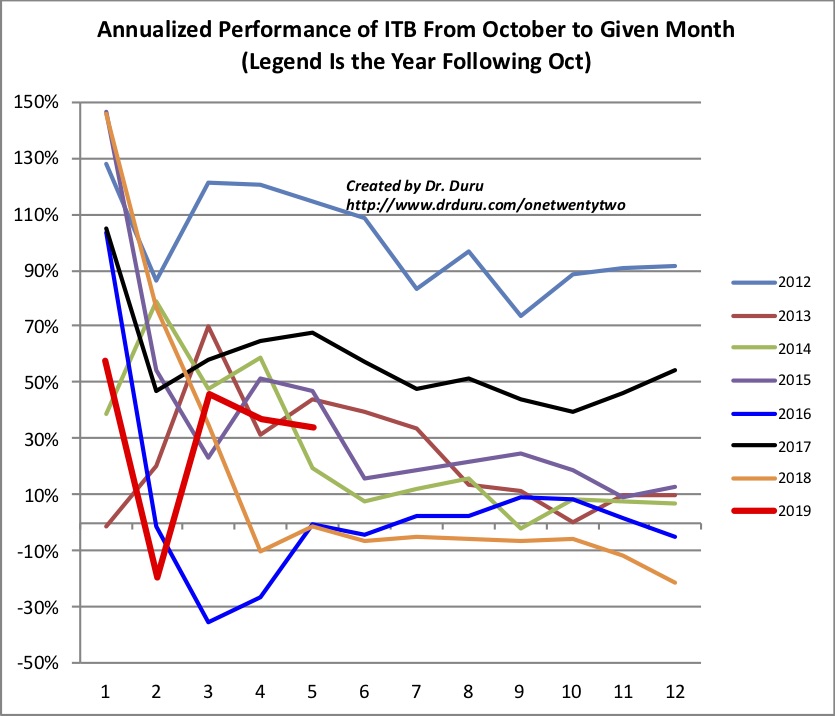
The x-axes in the charts show an index counting the months in the seasonal trade. November is month number 1. The y-axis is the difference in annualized performance(percentages) between ITB and SPY. The first point is the difference in performance from October to November of a given year. Each colored line is a different year starting from November. For example, the line for 2018 measures from November, 2017 to October, 2018. I break out the charts into two time periods for more clarity; the 2019 year is still active and has a bolder (and bright red) line than the other years.
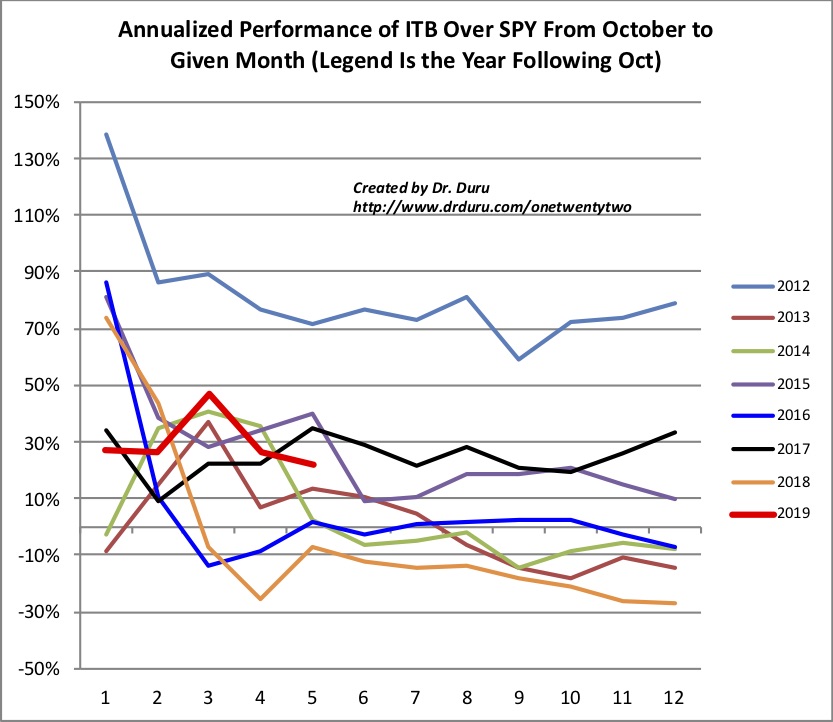
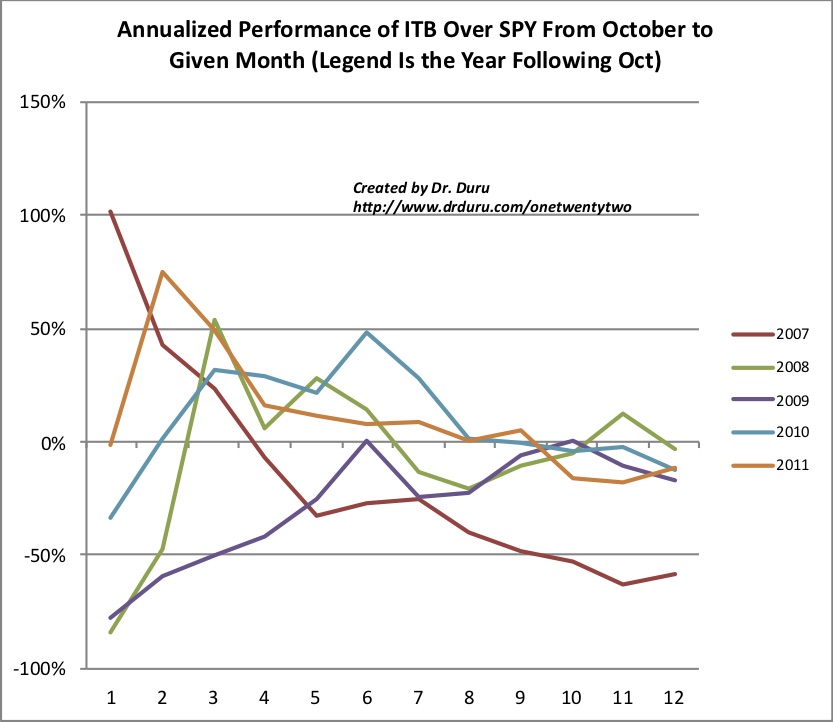
Note well that in EVERY year since 2007 (the first full year of trading for ITB), the performance of ITB relative to the SPY peaked by April (index 6). This behavior means that traders can move money from ITB to SPY after April to improve trade performance. In several years, ITB was the better trade just from October to November. For years when the trade works past one month, selling ITB in January provides a sufficient share of the gains for the seasonal trade. In EVERY year except 2017, a drop in relative performance from November to December was an early sign that ITB would continue to lose relative performance to SPY. This year’s seasonal trade was a close call from November to December, but it very likely peaked in January.
In my last Housing Market Review, I called an end to the seasonal trade as I took profits on my ITB call options. ITB has since continued to rally. The index closed last week at an 8-month high. The thick black horizontal line marks the beginning of the big October, 2018 sell-off.
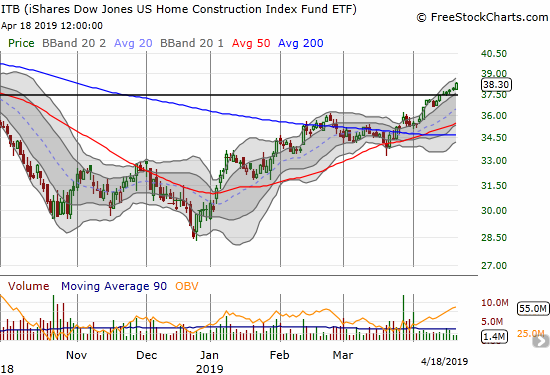
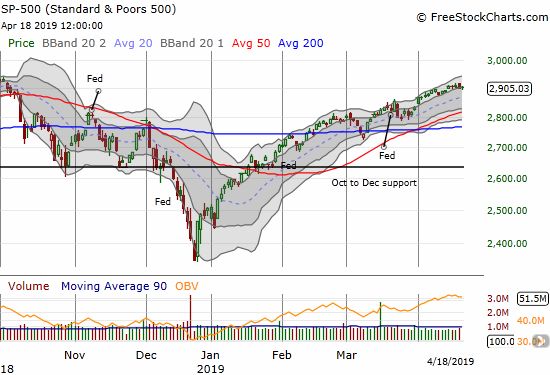
Source for charts: FreeStockCharts
At the same time of the ITB rally, the S&P 500 has slowly drifted toward its all-time high. The net result has produced new life to the relative ITB vs SPY performance. ITB is up 8.7% in April month-to-date. SPY is up 2.7% month-to-date.
Last year, I called an end to the seasonal trade on the stocks of home builders in March after it was clear the iShares US Home Construction ETF (ITB) could not make up all the ground it had lost to the S&P 500 (SPY). My call for the 2019 season may turn out to be a bit pre-mature, but my April ITB calls expired last week, so the clock was working against me. At least one analyst agrees that the seasonal trade has come to an end.
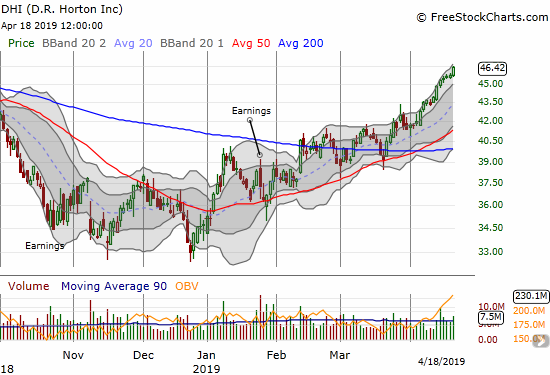
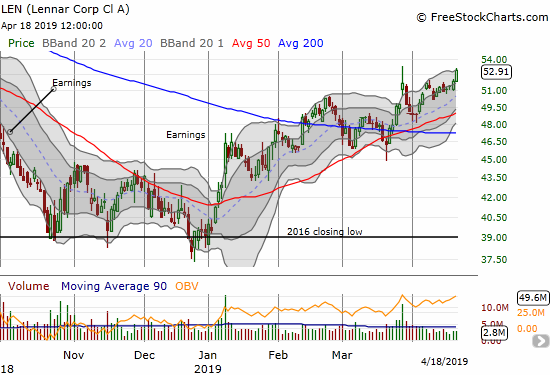
On Wednesday (April 17th), Susquehanna downgraded Lennar (LEN) and D.R. Horton (DHI) from positive to neutral citing an end to the seasonal trade in home builders:
“…historically, we see the November 15th to April 15th window as the bulk of the spring trade, and historically the spring trade is worth ~20% to the group on average…
Susquehanna concluded that this year’s Spring selling season has turned into a “typical” season. The housing market has seemingly stabilized and all the recovery priced into the stocks. This downgrade had no impact on DHR or LEN as both stocks gained on the day and tacked on strong gains on Thursday.
I will of course be watching closely to understand any potential implications for a continued rally in the home builders. Needless to say, an on-going rally for ITB is a bullish sign for the rest of the stock market and the economy in general. However, given the current housing data and economic prospects, I am skeptical that this rally can last much longer. I will post my developing assessments here.
The following charts show the performance of ITB by itself using the same format as the above ITB vs SPY charts. Note how the historical seasonal patterns suggest ITB should peak this month. The years 2009 and 2016 are the ONLY years since 2007 where ITB managed to generate additional gains past April.
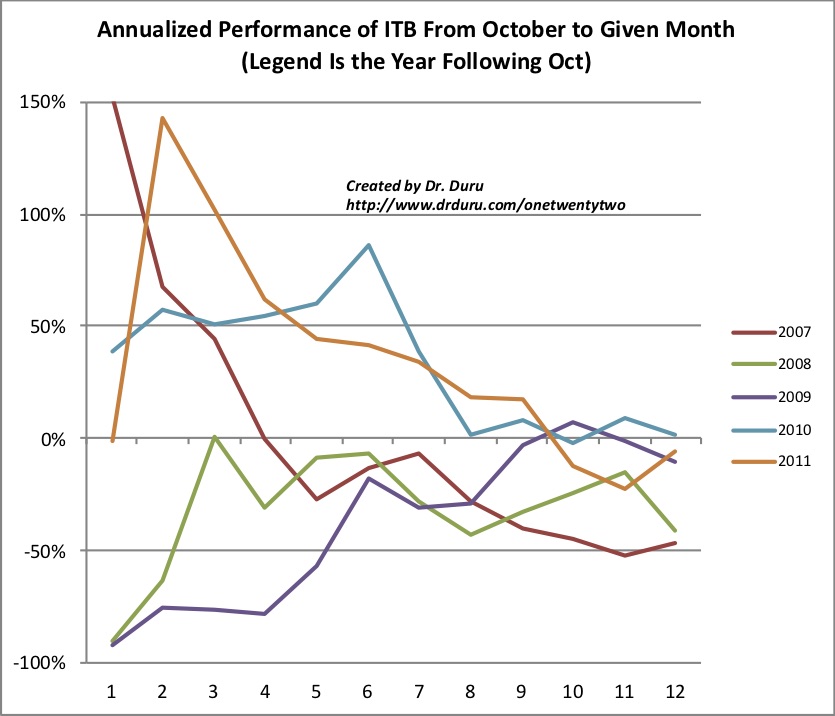
Source of price data: Yahoo Finance
Be careful out there!
Full disclosure: no positions