AT40 = 18.5% of stocks are trading above their respective 40-day moving averages (DMAs) (oversold day #1)
AT200 = 36.6% of stocks are trading above their respective 200DMAs (near 13-month low)
VIX = 27.6
Short-term Trading Call: cautiously bullish
Stock Market Commentary
Oversold
The action in the stock market continues to move fast. On Tuesday, I declared the stock market “close enough” to oversold because AT40 (T2108), the percentage of stocks trading above their respective 40-day moving averages (DMAs) bounced perfectly off the 20% oversold threshold. Buyers tried to push the market higher Wednesday (February 26th), and I followed suit by nibbling a little. In due time, the selling pressure returned. This time the 20% threshold was no match. AT40 closed in oversold territory for the first time since early January, 2019. These oversold conditions serve as final confirmation that the stock market finally cares about risk again.
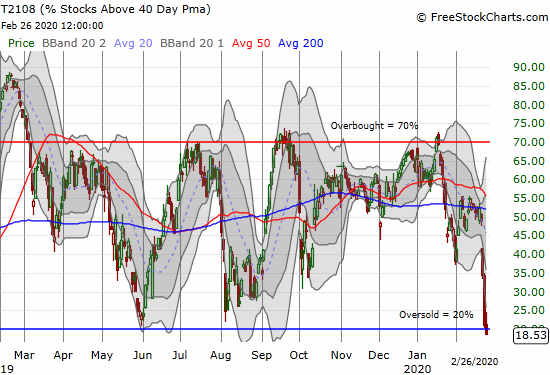
By rule, I switch my short-term trading call to some flavor of bullish once AT40 flips oversold. I am cautiously bullish because I see so many risks and serious breakdowns that I am bracing for an extended stay in oversold conditions. Moreover, I cannot get fully bullish until the volatility index experiences a significant down day during or coming out of the oversold period. Regardless, I cannot help looking back almost a year ago to the inversion in the yield curve which conventionally signals a recession 12-18 months later.
The Indices
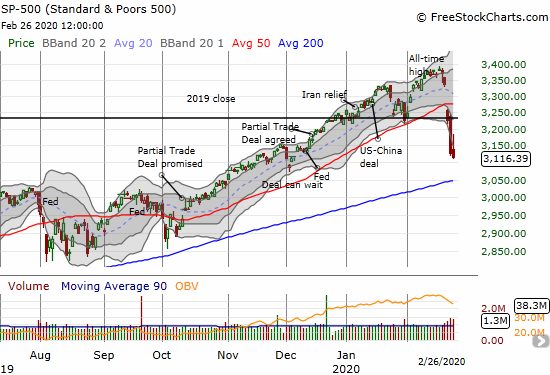
The S&P 500 (SPY) faded from an initial rally to close with a 0.4% loss. The index looks primed to test its 200DMA support, an event that incredibly last occurred in the late 2018 sell-off.
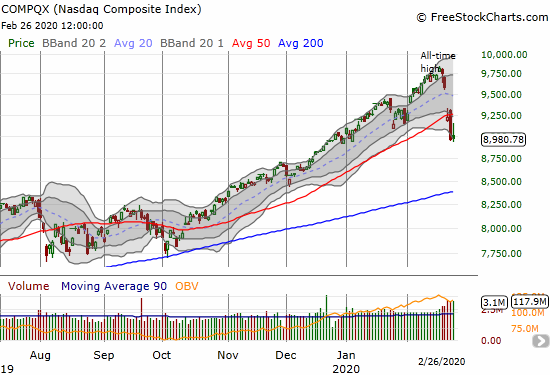
The NASDAQ (COMPQX) managed to avoid a loss on the day in an early and very tentative sign that buyers are trying to turn the tide. The steep fade from the intraday high still puts a great burden of proof on the bulls and buyers.
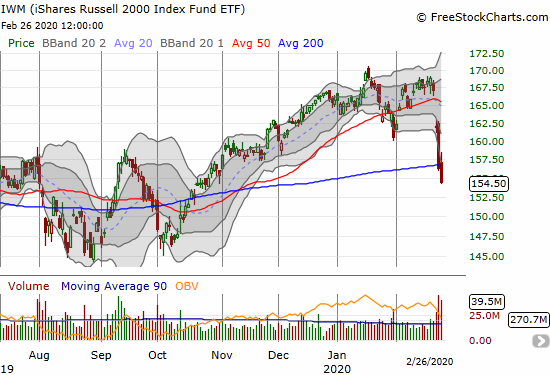
The iShares Russell 2000 Index Fund ETF (IWM) cratered to and through its 200DMA support with a 3.6% loss. I accumulated two tranches of March $160 IWM call options.
The SPDRS Select Sector Financial ETF (XLF) put an exclamation on its topping pattern with a break of 200DMA support.
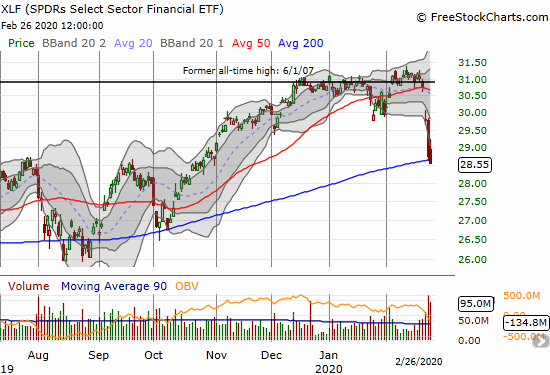
In total, these major indices present a dim picture of near-term prospects even with the tech-laden NASDAQ trying to put a good face on the day. Only the technically oversold conditions make me look forward to a rebound at some point.
Volatility
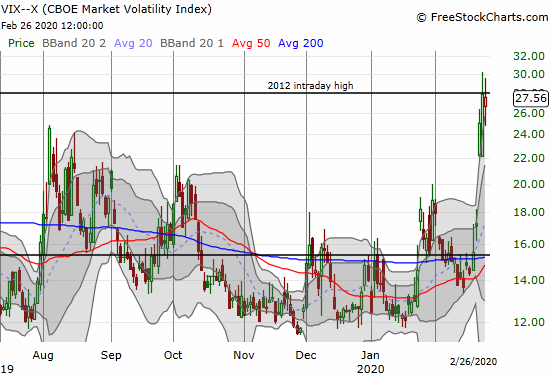
The volatility index (VIX) somehow lost 1.0% on the day after getting as high as 29.5. This stalemate is another small glimmer that sentiment is trying to turn. However, the drop is not nearly enough to make me fully bullish. I need to see the VIX drop below the previous day’s low. That 22 level also happens to be the low from Monday, making this threshold doubly important.
The Short-Term Trading Call
I was only able to hold onto my neutral trading call for a day. I am not truly ready to flip to any flavor of bullish, but I am staying disciplined in following my AT40 trading rules. I started nibbling on Wednesday including buying a calendar call spread on Alphabet (GOOG), a Disney (DIS) call option, a single QQQ call option (which I was very tempted to close out in the day’s rally), and even a calendar call spread on Workday (WDAY) ahead of earnings. I tried to add to my SPY put options on the rally but my limit order did not fill. I will be looking to close out my SPY put spread very soon. I might also take profits on my latest tranche of Caterpillar (CAT) put options. However, until AT40 exits oversold conditions, I want to keep some kind of put options (mainly spreads) on my hip.
If the current malaise in the stock market represents a reluctant acceptance of economic risks, then last year’s yield curve inversion arrived right on time. Most scoffed at last year’s inversion and provided plenty of “it’s different this time” narratives. It is starting to look like this famous indicator remains golden. That inversion also cautions me to remember that my short-term (cautiously) bullish trading call is…short-term.
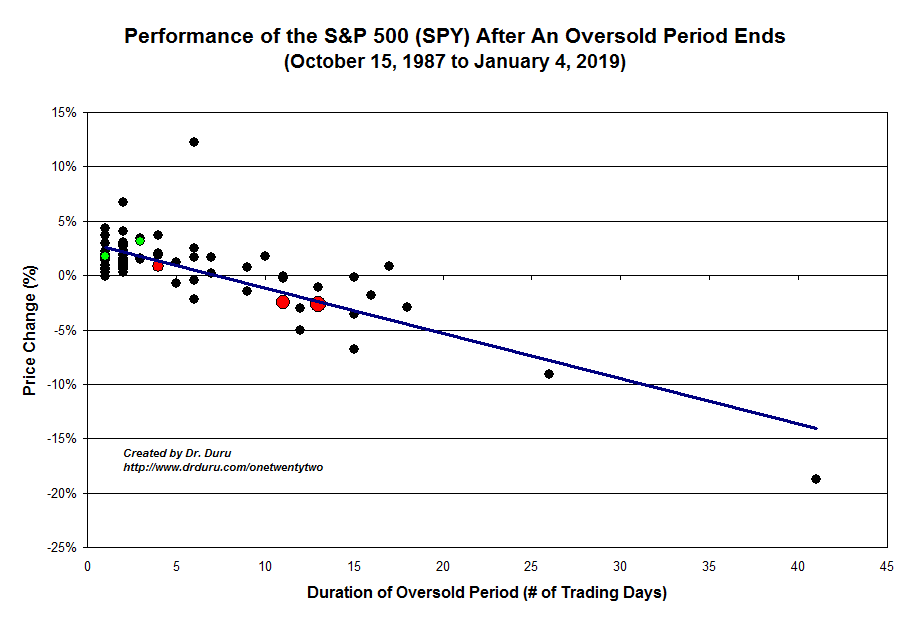
Here is a reminder on the durations of oversold periods and associated performances on the S&P 500.
Stock Chart Reviews – Below the 50DMA
Acuity Brands (AYI)
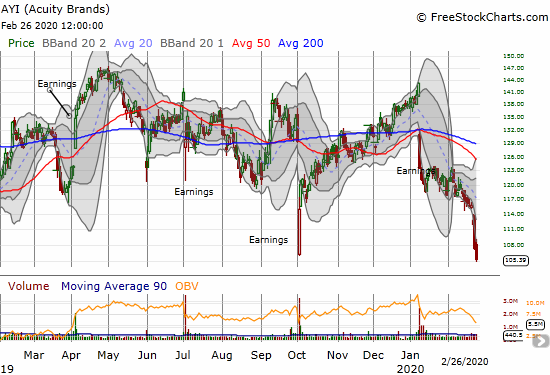
Acuity Brands (AYI) has been worrying me for a while. Today, it closed at a 6-month low. This maker of industrial lighting solutions can be a signal for the overall health of the commercial real estate market.
U.S. Concrete (USCR)
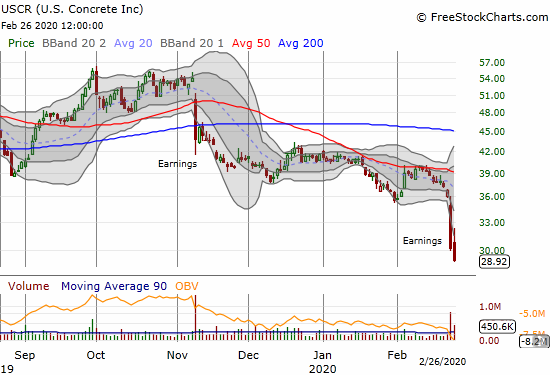
U.S. Concrete (USCR) is one of those stocks I buy when things look ugliest. The stock is once again quite ugly. However, I am not in a rush to accumulate more shares. In particular, I want to read through the latest earnings report to understand prime drivers for the worsening sentiment in the stock.
Toll Brothers (TOL)
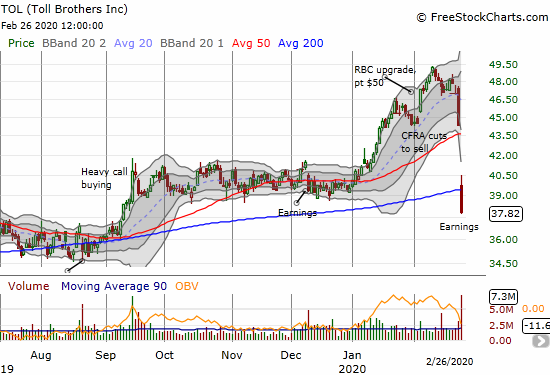
Speaking of ugly, Toll Brothers (TOL) finished wiping out its entire year of heady gains and closed at a 5-month low and a 200DMA breakdown. This awful post-earnings response put TOL in one of the worst relative positions in the universe of home builder stocks that I follow. I am eager to review the earnings conference call to understand the scope of opportunity in buying TOL as part of the seasonal trade in home builders. Given the current plunge, I am not in a rush and prefer to wait for an even bigger discount. A confirmed close above 200DMA resistance would of course be bullish.
iShares Dow Jones US Home Construction Index Fund ETF (ITB)
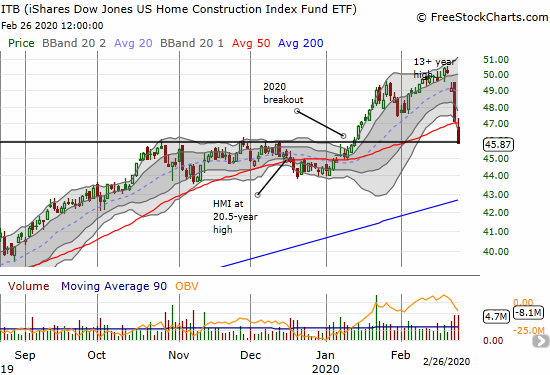
The iShares Dow Jones US Home Construction Index Fund ETF (ITB) finished erasing its entire 2020 breakout with a 2.7% loss. The accompanying 50DMA breakdown looks very bearish, but I went ahead and executed on the seasonal trade on home builders by buying April $48 call options. Over the coming week or more, I will be closely examining my universe of home builders for additional trading opportunities. If ITB manages to plunge as far as its 200DMA, I will get aggressive on buying shares of home builders for potentially longer-term holds.
Stock Chart Reviews – Above the 50DMA
iShares Silver Trust (SLV)
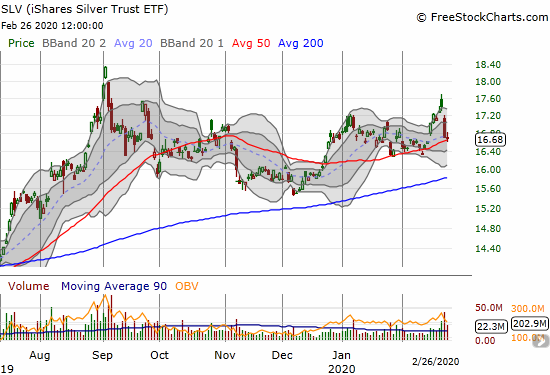
The iShares Silver Trust (SLV) slowed its descent with a light tap of 50DMA support. This looks like my next opportunity to buy call options to supplement my long-term SLV shares. I do not want to miss this opportunity this time. I am a buyer to 200DMA support.
— – —
FOLLOW Dr. Duru’s commentary on financial markets via email, StockTwits, Twitter, and even Instagram!
“Above the 40” uses the percentage of stocks trading above their respective 40-day moving averages (DMAs) to assess the technical health of the stock market and to identify extremes in market sentiment that are likely to reverse. Abbreviated as AT40, Above the 40 is an alternative label for “T2108” which was created by Worden. Learn more about T2108 on my T2108 Resource Page. AT200, or T2107, measures the percentage of stocks trading above their respective 200DMAs.
Active AT40 (T2108) periods: Day #1 under 20% (oversold day #1 ending 275 days over 20%), Day #2 under 30%, Day #13 under 40%, Day #4 under 50%, Day #23 under 60%, Day #27 under 70%
Daily AT40 (T2108)

Black line: AT40 (T2108) (% measured on the right)
Red line: Overbought threshold (70%); Blue line: Oversold threshold (20%)
Weekly AT40 (T2108)

*All charts created using FreeStockCharts unless otherwise stated
The T2108 charts above are my LATEST updates independent of the date of this given AT40 post. For my latest AT40 post click here.
Be careful out there!
Full disclosure: long VIXY calls, long UVXY puts, long SLV, long SPY put spread, long USCR, long ITB calls and call spread, long IWM calls
*Charting notes: FreeStockCharts stock prices are not adjusted for dividends. TradingView.com charts for currencies use Tokyo time as the start of the forex trading day. FreeStockCharts currency charts are based on Eastern U.S. time to define the trading day.

Waiting for T2108 to hit single digits. This has been a great entry point in the past, but of course, nothing is guaranteed. Regardless, I will not be buying ‘hand over fist’, but more likely small handfuls at a time.
Perception aside, the real wildcard here is how much economic damage the virus will inflict on corporate profits, and how long that will go on. Probably the virus will not wipe out half the world’s population (in that case, the stock market won’t matter), but it will do some serious intermediate term financial damage until it’s under control, one way or another.
The VIX hit 36 today, and it hasn’t been in that region since the 2018 selloff. After that, things got better, as we know. But with the virus still in its early stages, the news of more cases could certainly push the VIX higher, and the market lower.
As in the past, nobody knows where the bottom will be…..
Whew! You’re short-term bearish then! 🙂
I am definitely not trying to predict THE bottom. I am just making sure i have some positions in place for A bottom.
Never under-estimate the market’s ability to look past all sorts of short-term risks…especially when the parameters of the risk become identified and known.
My wildcard is the potential recession that the bond market predicted almost a year ago that should thus be starting sometime this year. Global central banks have been furiously trying to fight the looming global slowdown and recessionary forces. If we still descend into a recession, it could take a lot longer to heal this time around.
Good luck!