
AT40 = 4.6% of stocks are trading above their respective 40-day moving averages (DMAs) (28th oversold day)
AT200 = 5.1% of stocks are trading above their respective 200DMAs (new low for the oversold period)
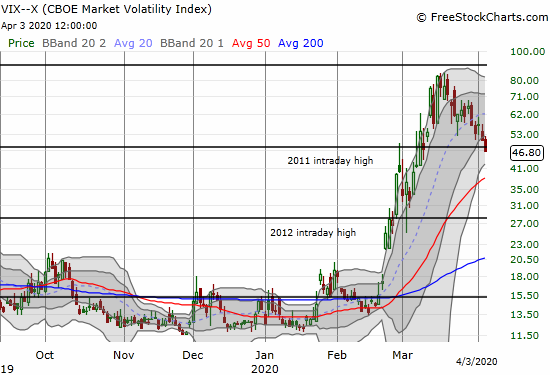
VIX = 46.8
Short-term Trading Call: cautiously bullish
Stock Market Commentary
First, another dose of hope and a light reminder of the seriousness of following coronavirus safety guidelines.
Just as I feared a week ago, the downtrending 20-day moving averages (DMAs) in the stock market proved too tough for the green shoots to push through. The collective failures make the stock market look like it is hunkering down for an even more extended stay in oversold territory. Trading ranges are starting to develop, and my trading strategy is morphing to accommodate the changing outlook. Friday’s trading was colored by an awful jobs report that would have looked a lot worse if the surveying excluded the first half of March:
“Total nonfarm payroll employment fell by 701,000 in March, and the unemployment rate rose to 4.4 percent, the U.S. Bureau of Labor Statistics reported today. The changes in these measures reflect the effects of the coronavirus (COVID-19) and efforts to contain it. Employment in leisure and hospitality fell by 459,000, mainly in food services and drinking places. Notable declines also occurred in health care and social assistance, professional and business services, retail trade, and construction.
Employment Situation News Release, April 4, 2020, U.S. Bureau of Labor Statistics
Oversold
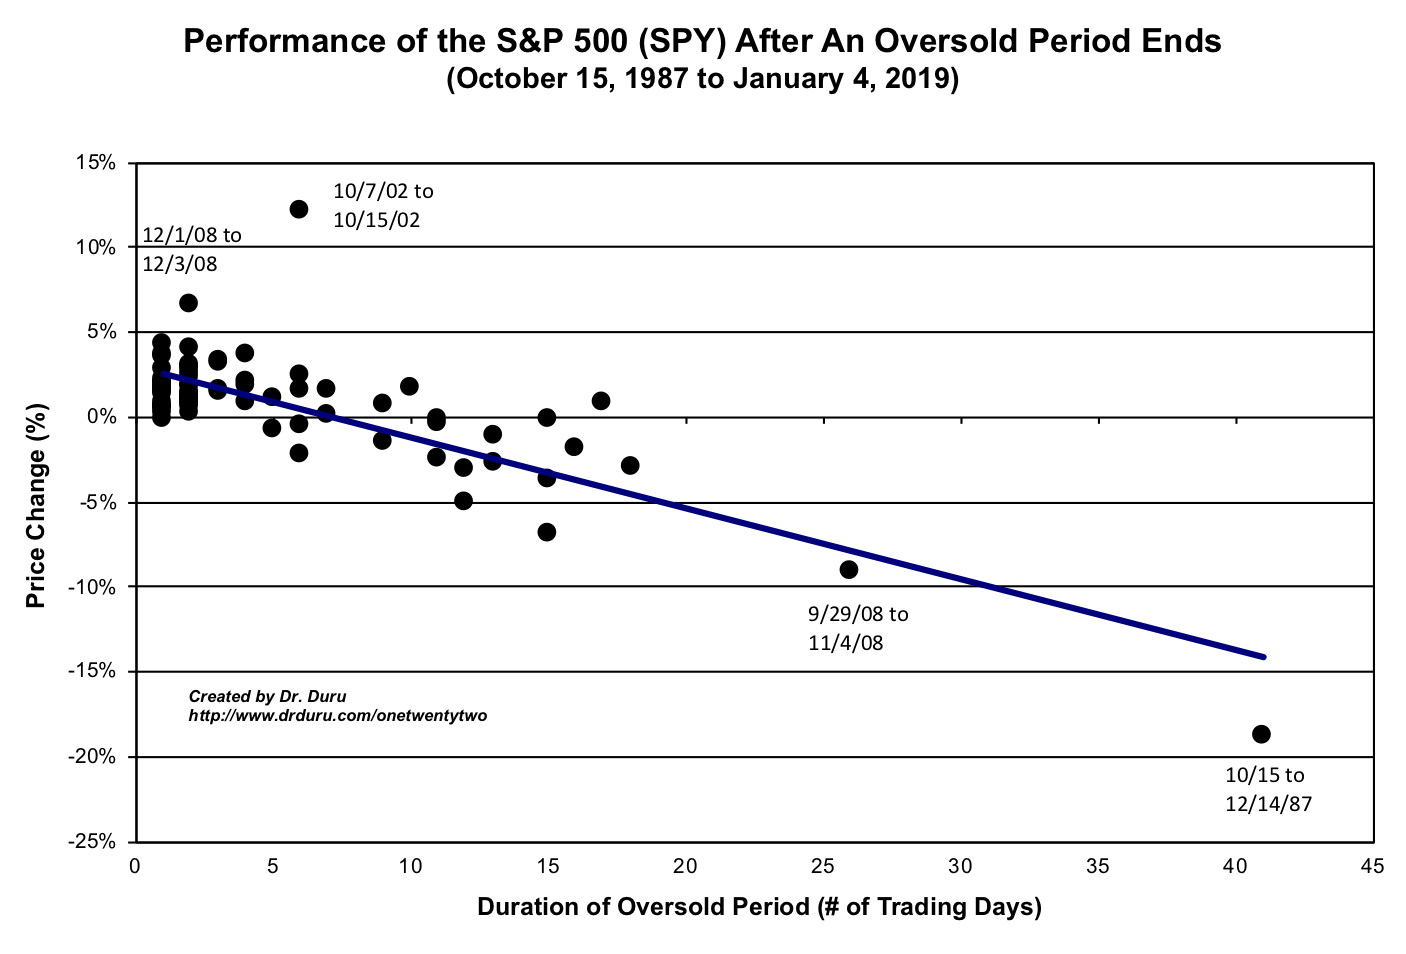
I call the stock market oversold when AT40 (T2108), the percentage of stocks trading above their 40DMAs, closes below 20%. The current historic oversold period is now an endless seeming 28 days long. This oversold period is the second longest on record (since 1986). Given the depths of the misery facing the growing numbers of unemployed and furloughed workers, I can now imagine this oversold period setting a new record (over 41 days). When this oversold period finally ends, current trends suggest that the longer-dated moving averages like the 50DMA and even the 200DMA will be descending to meet price rather than stocks rallying into breakouts.
Since the first oversold day, the S&P 500 (SPY) has lost 20.1%. Per the chart below, the index still has theoretical upside potential if it can end ahead of setting a record.
The Stock Market Indices
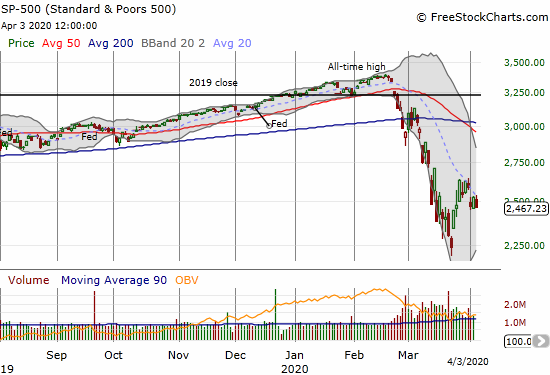
The S&P 500 (SPY) lost 1.5% a week after failing to challenge its downtrending 20DMA. Since then, the index closed right at resistance and twice failed at resistance by fading from intraday highs. The week started with a promising 3.4% gain on Monday but ended with a 2.1% loss on the week. The “good” news is that the S&P 500 provided a line above which I can consider the market in clear bullish territory – about 2650 (overhead resistance notwithstanding). Until that breakout, the index looks hunkered down for an extended stay.
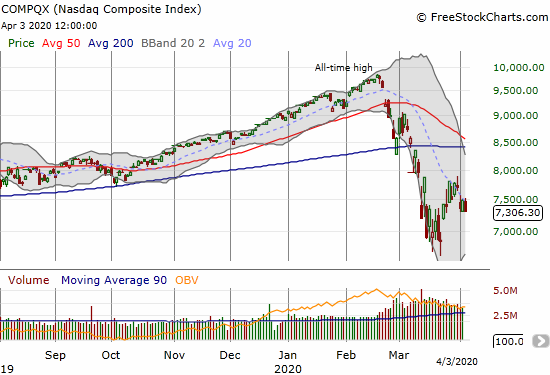
The NASDAQ (COMPQX) actually managed to close twice above its downtrending 20DMA to start the week before ending the week with a 1.5% loss. The tech-laden index failed at resistance three straight days. My upside bull line for the NASDAQ is 7900 – just above last week’s intraday high.
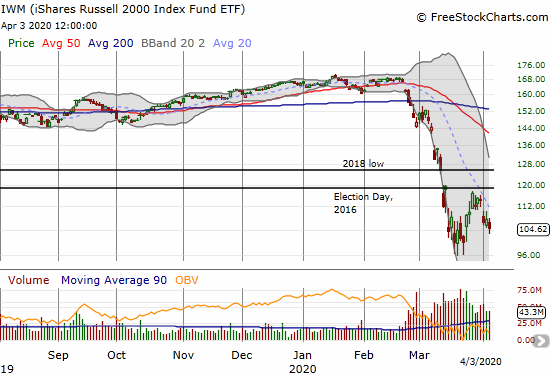
The iShares Russell 2000 Index Fund ETF (IWM) continued its under-performance. IWM ended the day with a 2.8% loss and has only challenged its downtrending 20DMA once. That challenge happened on Monday when IWM faded to a loss of 0.5% and severely under-performed the stock market. IWM has not even come close to resistance since then. Note well that IWM also cleanly failed at resistance from its price level at the close on the day of the 2016 Presidential election.
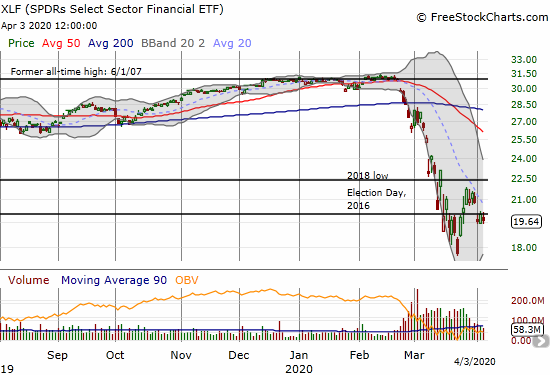
The SPDRS Select Sector Financial ETF (XLF) lost 2.0% and under-performed this past week similarly to IWM. Even more telling and significant is that XLF gapped under the Election Day, 2016 close and failed three times to climb back over that milepost.
Volatility
While the major indices hunker down, trading has actually calmed down from the culture of collapse that characterized trading going into the March 23rd bottom. The VIX failed to make a new high on that momentous day, and the fear gauge has continued to drift lower from there. The VIX is even below the 2011 intraday high and closed at a 3 1/2 week low. Ironically, I set a break below the 53 level as a milestone for getting more aggressive in buying the oversold period. Instead, I am just as non-plussed. The break happened on Thursday, and the S&P 500 gained a healthy 2.3% on that day. I am clinging to the hope that the VIX’s 8.1% loss on Friday even as the S&P 500 sold off is some kind of (minor) bullish divergence.
The Short-Term Trading Call

The above chart blows me away. I believe much of this decline in commodity prices is driven by the decline and then collapse in oil prices (2014 to 2016 and 2020). Yet, still, central banks across the globe have eased monetary policy by historic amounts over this time. They have printed all sorts of money. The inability of commodities as a group to sustain a rally represents some serious deflationary pressures. This behavior makes me question my abiding expectation for the arrival of inflation in the next economic recovery.
With the stock market hunkered down underneath declining 20DMAs and the S&P 500 below a key bear/bull line, I decided to downgrade my trading call from bullish to cautiously bullish. This change also reflects my slight increase in shorting activity. I have kept tight expirations on the trades because I am constantly on watch for a massive upside move out of oversold conditions. I keep seeing so many classic short setups that I finally felt compelled to try some as I wait around for a more convincing entry point for doing aggressive buying. I also gave in to the temptation of buying puts on market laggards IWM and XLF as backstops.
These trades take the polish off my previous bullish short-term trading call. However, I am still very much positioned net bullishly. Even as this historic oversold period put a serious dent into my AT40 trading rules, I cannot violate the fundamental rule to be bullish when the market is at downside extremes. Being cautiously bullish also makes sense given my greatly lowered expectations for performance coming out of the oversold period..
As I mulled over my change in trading call, I took a look back on March 15, 2020 at U.S. Treasury Secretary Steve Mnuchin claiming on ABC News that the U.S. was not in a recession. Technically, Mnuchin was correct since insufficient time had passed to make an official recession call. Yet, even then, it was inconceivable that the U.S. could escape recession with shutdowns of major swaths of the economy on-going. That interview was yet another example to me of how the government will cling to positive narratives as long as possible and until it is absolutely forced to acknowledge reality. These interviews are simply of little use to traders and investors who need to stay focused on what the data and price action actually say. If I were bearish at the time, I would have thought to fade the market after hearing that claim. (I harken back to my skepticism after watching Larry Kudlow, who leads the National Economic Council, celebrate the achievement of boundless economic prosperity for the U.S.).
Stock Chart Reviews – Below the 200DMA
Children’s Place (PLCE)
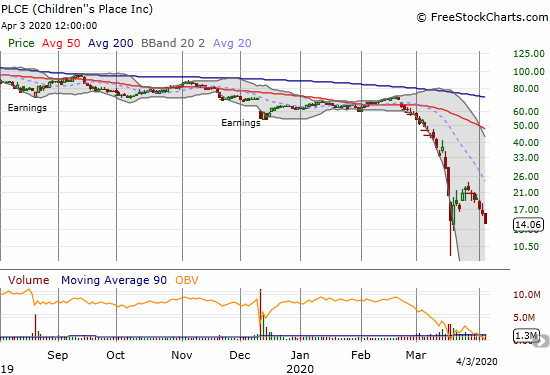
I keep eyeing Children’s Place (PLCE) for a new entry point. I thought I found one the previous week as PLCE showed resilience. I looked at the downtrending 20DMA as a near-term price target. PLCE topped out shortly after that. I almost bit my lip and took my loss, but a bullish call by an analyst stopped me in my tracks. Monness Crespi & Hardt has followed Children’s Place for quite some time and on Friday, in the midst of the heavy selling, the firm dared to keep its price target as high as $38 (down from $50) while applauding the company’s amount of e-commerce business and strong balance sheet. That was enough for me to put my sale on hold…for now.
Walgreens Boots Alliance (WBA)
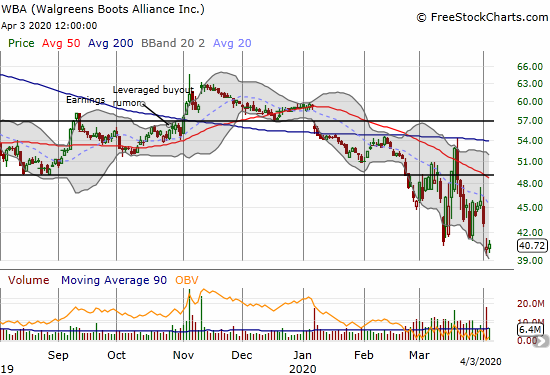
I am surprised that Walgreen Boots Alliance (WBA) continues to struggle so heavily. However, the company acknowledged in Thursday’s earnings report it is suffering sales declines due to the covid-19 pandemic. Post-earnings, WBA gapped down to a 7-year low. Since WBA has been in slow decline since it peaked in 2015, I cannot call this moment “cheap.” However, WBA should at least be tradable. I am looking for any signs of life and interest in moving into the post-earnings gap.
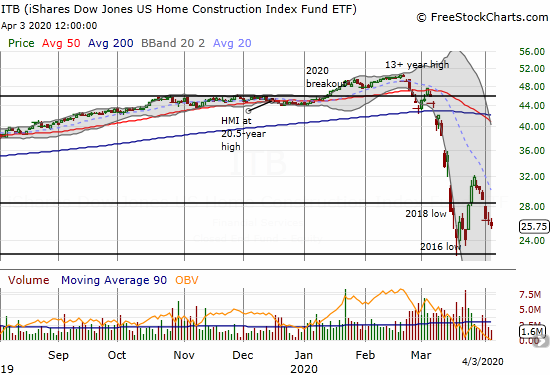
iShares Dow Jones US Home Construction Index Fund ETF (ITB)
It was another rough week for the iShares Dow Jones US Home Construction Index Fund ETF (ITB). ITB lost 2.3% on the day at the end of a week with a 15.7% loss. ITB’s severe under-performance says a lot about the economic duress in the country. The strong momentum going into the Spring selling season has given way to a housing downturn.
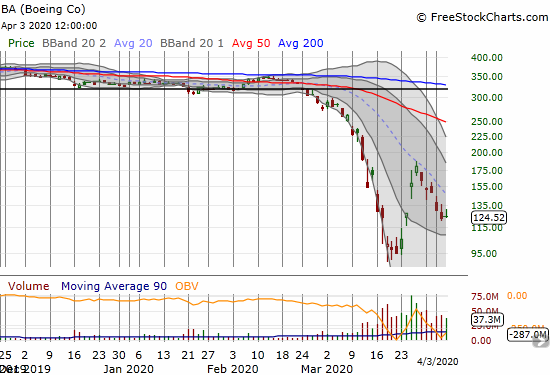
Boeing (BA)
In my last Above the 40 post, I reviewed my trade in Boeing (BA). After its historic one-day performance, the stock took just 6 days to fully reverse the move. BA hit a wall at its 20DMA and lost all its momentum. I have not dipped back into BA yet as I do not see a sound entry point. Moreover, the rapidly declining 20DMA is acting like a tight ceiling. I will consider another round if BA touches the top of its lower Bollinger Band (BB) and/or retests its recent lows.
Stock Chart Reviews – Above the 200DMA
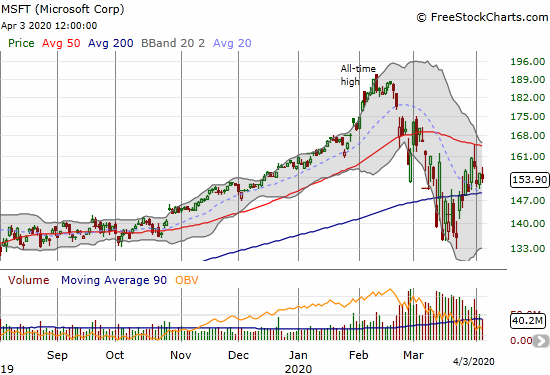
Microsoft (MSFT)
I talked about the importance of losing Apple (AAPL) 2 weeks ago, but Microsoft (MSFT) looks like the better big cap tech to track for a “last stand” for the stock market. MSFT recovered from an extended stay below its 200DMA, an exceptionally rare achievement in this stock market. Unfortunately, MSFT also failed at 50DMA resistance on Tuesday. Now the stock looks hunkered down for a trading range between its 50 and 200DMAs. I bought a weekly $170 calendar call spread on the outside chance of a breakout. I am now left with a long shot on the long side with the short side expiring harmless.
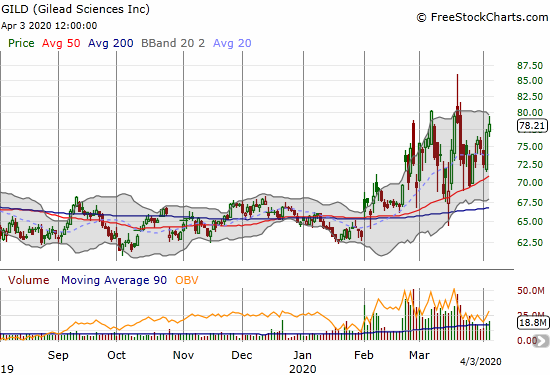
Gilead Sciences (GILD)
I bought a call option on Gilead Sciences (GILD) expecting the market to have a delayed appreciation of the good news from treating a coronavirus victim with its Ebola drug remdesivir. A big surge never came but the rally into the end of the week delivered satisfactory profit. I am still holding shares as a long-term investment.
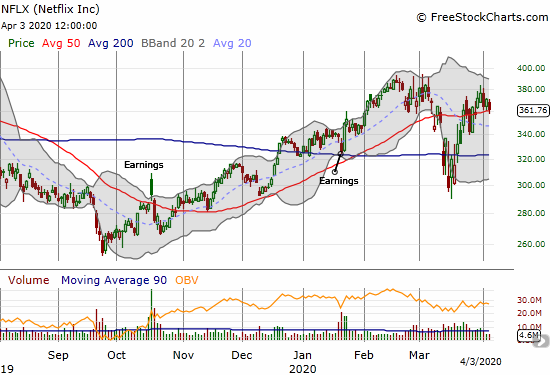
Netflix (NFLX)
As Netflix (NFLX) bounced out of a major breakdown in March, I finally took profits on my short position. While I think my bearish thesis remains intact, it made little sense to stay short such a resilient looking stock. I will likely give one more shot just ahead of earnings as I think investors will be disappointed at subscriber growth and will shun the costs NFLX is incurring from increased usage at fixed subscription prices. There may even be increased costs from the inability to produce new originals. Until then, the stock looks impressive as one of the precious few stocks able to break out above 50DMA resistance and hold. A fall from here will create a double-top looking pattern. A breakout above $400 will be exceptionally bullish, especially in this environment.
Note I am very surprised Netflix has been so silent during the entire coronavirus pandemic. The company’s last press release with content was the Q4 earnings report in January. The last SEC filing was February 14th.
— – —
FOLLOW Dr. Duru’s commentary on financial markets via email, StockTwits, Twitter, and even Instagram!
“Above the 40” uses the percentage of stocks trading above their respective 40-day moving averages (DMAs) to assess the technical health of the stock market and to identify extremes in market sentiment that are likely to reverse. Abbreviated as AT40, Above the 40 is an alternative label for “T2108” which was created by Worden. Learn more about T2108 on my T2108 Resource Page. AT200, or T2107, measures the percentage of stocks trading above their respective 200DMAs.
Active AT40 (T2108) periods: Day #28 under 20% (oversold day #28), Day #29 under 30%, Day #40 under 40%, Day #31 under 50%, Day #50 under 60%, Day #54 under 70%
Daily AT40 (T2108)
")
Black line: AT40 (T2108) (% measured on the right)
Red line: Overbought threshold (70%); Blue line: Oversold threshold (20%)
Weekly AT40 (T2108)

*All charts created using FreeStockCharts unless otherwise stated
The T2108 charts above are my LATEST updates independent of the date of this given AT40 post. For my latest AT40 post click here.
Be careful out there!
Full disclosure: long QQQ shares and calendar call spread, long SSO, short UVXY shares, long ITB shares and various call options, long AAPL call, long GILD, long IWM puts, long XLF puts, long PLCE, long MSFT calls
*Charting notes: FreeStockCharts stock prices are not adjusted for dividends. TradingView.com charts for currencies use Tokyo time as the start of the forex trading day. FreeStockCharts currency charts are based on Eastern U.S. time to define the trading day.
As you mentioned in the article, simple moving averages eventually converge with price. Therefore it is inevitable that T2108 will again do what I saw it do in the ’08 crash (and presume it did in the ’87 crash): “age out” of oversold state as old higher prices stop influencing the average.
T2108’s inevitable ascent above 20% will not produce a useful trading signal in my opinion; its 40 day window is optimized to generate signals based on normal market ebb and flow, not global economic collapses. It appears we would need a 9-year period for that :-}.