
Since companies began restricting business travel over precautions with the coronavirus pandemic, the Transportation Security Administration (TSA) provided data on screenings at U.S. airports. These data say a lot about the disappearance of air travel in the U.S. Almost every screening represents a passenger on a flight. The TSA provides a year-over-year comparison, normalized to the weekday, to show the dramatic decline during the pandemic (I am storing the data in a Google Sheet).
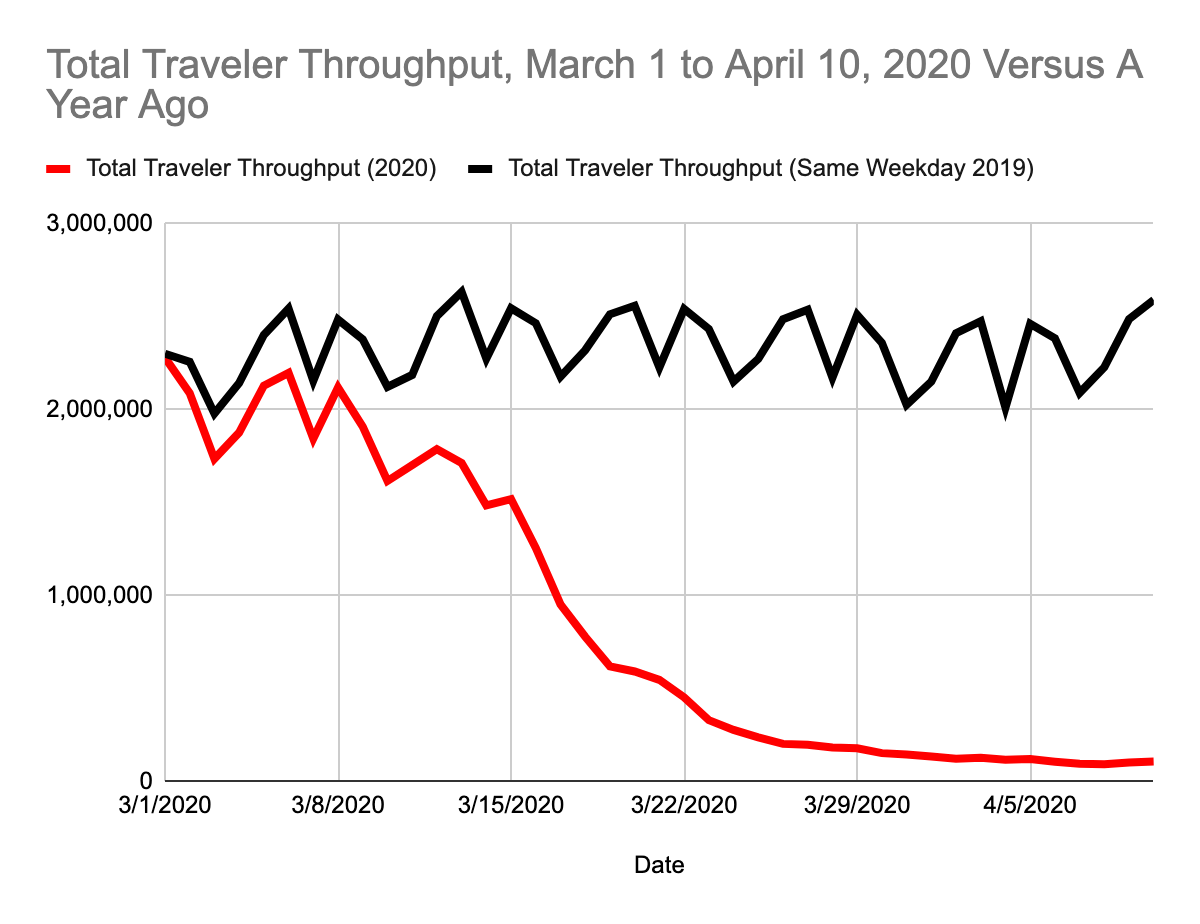
The graph shows that travel was already a little weak when March began. The big declines started after Match 8th, and completely collapsed from March 15th through the end of the month. For example, on Friday, April 10, 2020, total traveler throughput for the TSA was 108,977. The year prior, Friday, April 12, 2019, that throughput was 2,590,499. Year-over-year, total traveler throughput collapsed a whopping 96%! Air travel in the U.S. is down to a mere trickle.
This collapse in air travel has of course impacted a lot of industries with the airlines taking direct hits. The stock charts below demonstrate this damage but also remind us that the airlines have been relatively poor investments for years. The collapse in financial markets have forced these stocks to trade in near unison with most dropping right to 7-year lows regardless of their performance going into 2020. I am surprised that some of these airlines are not trading even lower. The prospect for bailouts is likely helping to prop up some of these prices. I use monthly charts for full perspective; the last bar is for the partial month of April.
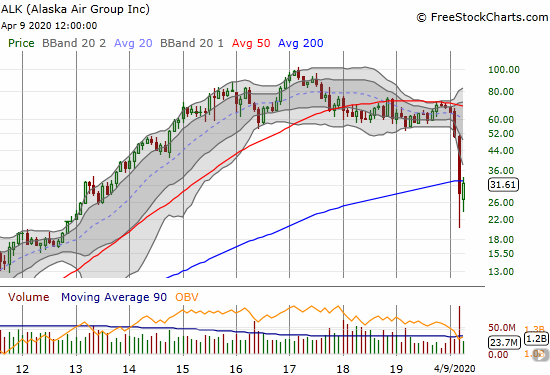
Alaska Air Group Inc (ALK)
Alaska Air Group Inc (ALK) closed at a 7-year low. In March, ALK traded back to prices last seen in late 2012. ALK topped out in early 2017 but held a trading range until an initial breakdown in February.
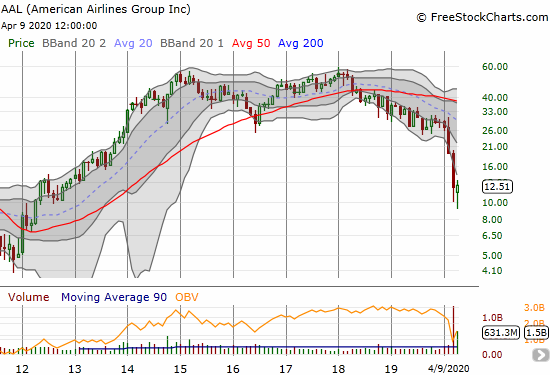
American Airlines Group (AAL)
American Airlines Group (AAL) topped out in 2018 and has been stuck in a downtrend ever since. That downtrend accelerated in February. AAL closed at a 7-year low but traded at an 8-year low just a week ago. The stock is trading like it has yet to find a bottom.
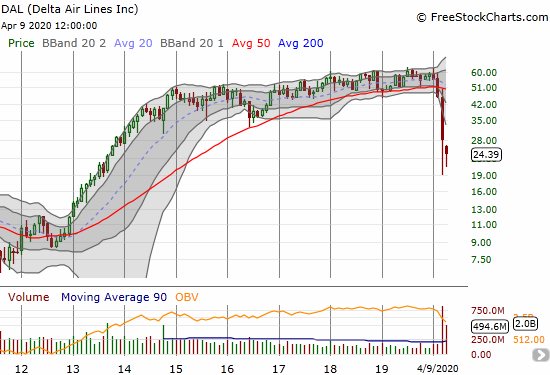
Delta Air Lines (DAL)
Delta Air Lines (DAL) is one of the better performing airlines in this group. DAL marginally topped out in 2019 with a very slight uptrend in place from the end of 2014. The stock closed at a near 7-year low and traded as low as a 7-year low in March. To my family’s disappointment, Delta is one of my favorite U.S. airlines, but I am nowhere near interested in buying this dip: I am warily eyeing the potential for a reversal of the 2013-2014 breakout.
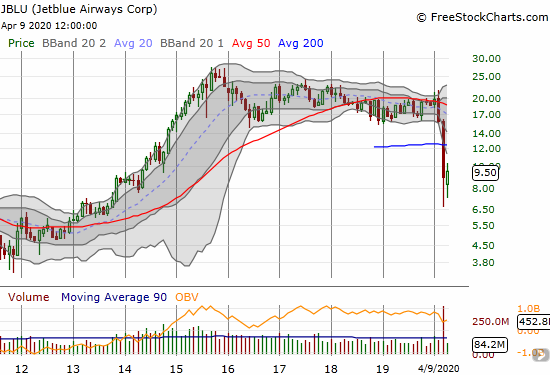
Jetblue Airways Corp (JBLU)
Jetblue Airways Corp (JBLU) topped out in 2015 and has been a in a slight downtrend ever since. The February sell-off took JBLU to the bottom of a recent trading range. March’s trading took the stock down to a 7-year low. Last week JBLU closed at a 6-year low.
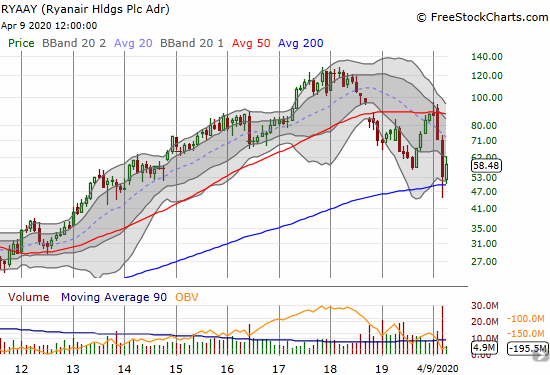
Ryanair Hdgs Plc (RYAAY)
Ryanair Hdgs Plc (RYAAY) is an Irish airline, but I included it as a point of comparison. RYAAY topped out in late 2017/early 2018 and went into a steep downtrend before bottoming in 2019. In March, RYAAY traded to a 7-year low. Last week the stock managed to recover enough to a 7-month low. RYAAY looks like a buy before any of the U.S. airlines.
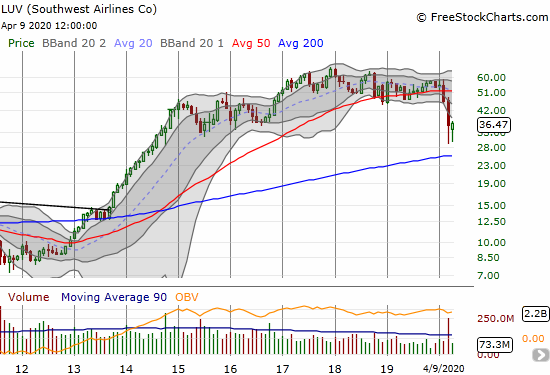
Southwest Airlines (LUV)
Southwest Airlines (LUV) topped out in a process from 2017 to 2018. The February pullback took the stock down to the bottom of a recent trading range. LUV double bottomed across March and April near a 6-year low. LUV looks like the most attractive of the U.S. airlines. However, I worry that in a fresh sell-off LUV might reverse much of its major breakout from 2013 to 2014.
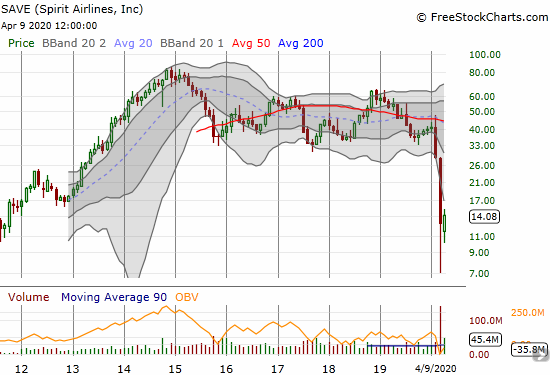
Spirit Airlines, Inc. (SAVE)
Spirit Airlines, Inc. (SAVE) is the worst performer of this group. Not only did SAVE top out in late 2014, but also the stock is down 65.1% year-to-date. Moreover, the stock traded at all-time lows in March. SAVE trades like it could be one of the first airlines to go under if Federal bailouts fail. Given Spirit’s focus on consumer travel, the company is most vulnerable to discretionary spending decisions.
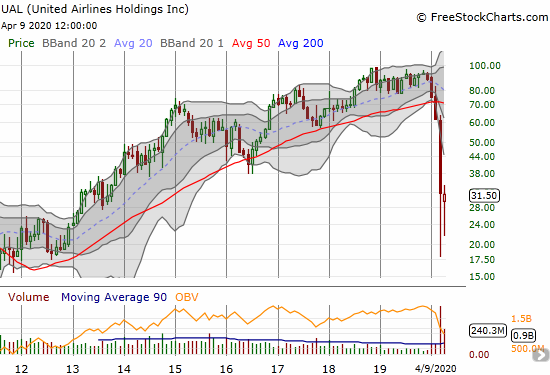
United Airlines (UAL)
United Airlines (UAL) is right behind SAVE as one of the worst performers. Even though the stock enjoyed the best gains and uptrend of the group from 2014/2016 to 2019, UAL suffered a complete collapse for 2020. In March, UAL traded as low as prices last seen in mid-2012. Last week, UAL closed at a near 7-year low. For bottom-fishing, I think UAL is the best of the group given its prior performance and the rapid drop it experienced. Most significantly, UAL finally broke out above its downtrend from the 20-day moving average (DMA). Such breakouts were major buy signals last week, so I have an eye to buy UAL for a trade.
Source for charts: FreeStockCharts
Be careful out there!
Full disclosure: no positions