
AT40 = 2.7% of stocks are trading above their respective 40-day moving averages (DMAs) (16th oversold day)
AT200 = 4.0% of stocks are trading above their respective 200DMAs
VIX = 76.5
Short-term Trading Call: bullish
Stock Market Commentary
The week started with another stomach churning loss with the S&P 500 (SPY) losing 12.0%. It was a day where the stock market looked and felt like it had absolutely no bottom; the stock market stopped just short of triggering a second circuit breaker on the day. Fear was as palpable as ever. The next day’s sharp rebound had all the markings of another bear market rally even as I was hopeful the market could finally string two up days in a row. The failure to step up to that challenge is characteristic of what I am now calling the “Culture of Collapse.” The market opened and quickly collapsed into its 4th circuit breaker trigger in two weeks. The Culture of Collapse features a very broken stock market.
Oversold
AT40 (T2108), the percentage of stocks trading above their respective 40-day moving averages (DMAs), extended oversold trading conditions to a 16th day. My favorite technical indicator closed 2.7% down from the previous day’s 3.5%. The big moves in the stock market accompanied by tiny absolute moves in T2108 are another confirmation of just how far a majority of stocks have fallen.
AT200 (T2107), the percentage of stocks trading above their respective 200DMAs, lost even more ground. AT200 fell from 5.9% to 4.0%. The culture of collapse has sent the majority stocks well below this critical long-term trend line.
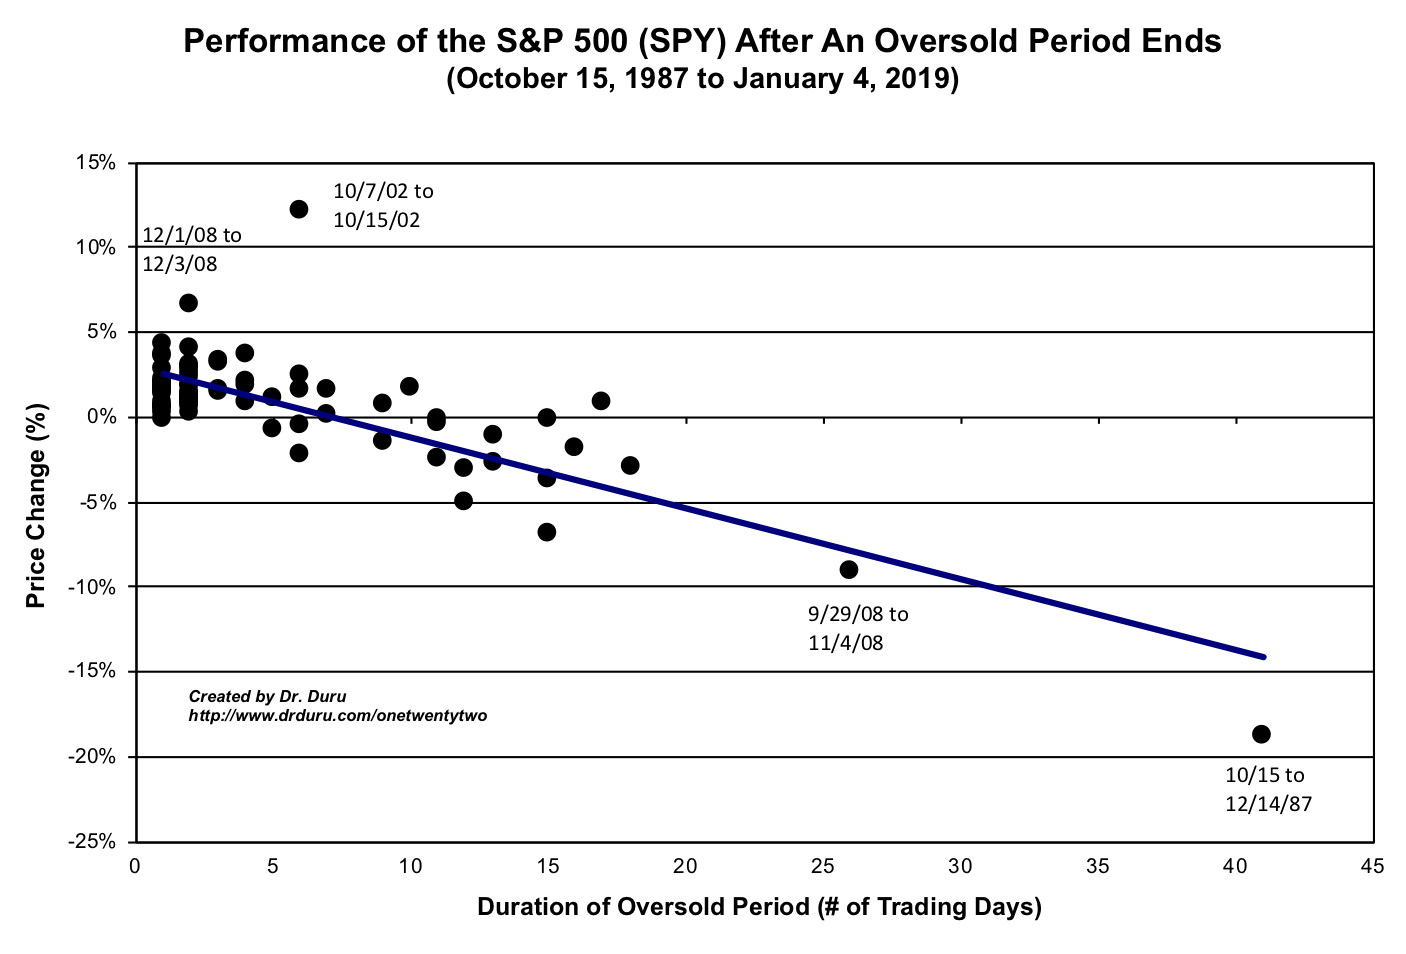
At these depths of collapse, I am focused on the duration of the oversold period. This oversold period is now tied for the 4th longest on record at 16 days. The S&P 500 is down 23.0% since going oversold on February 26th. I was earlier hopeful that the index could still exit the oversold period with a gain, but now the odds are very small. This oversold period is on pace to exit the oversold period with a significant loss.
The Stock Market Indices
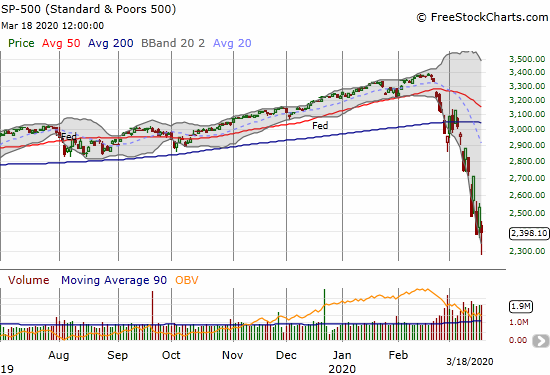
The S&P 500 (SPY) tried again to print some kind of bottom. While the index lost 5.2%, it came after a rebound that could have washed a final set of sellers. Of course in a bear market supports are built to be broken, so buyers will have to put in some more work (like two up days in a row) to demonstrate that the market has some kind foundation to keep prices from returning to fresh plunges.
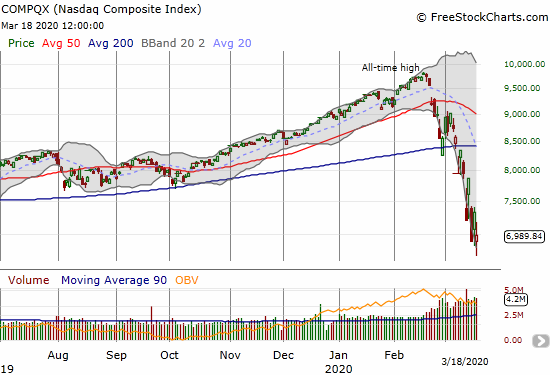
The NASDAQ (COMPQX) moved widely from intraday high to low. The stalemate between buyers and sellers could be a good sign…as much as that is worth in a bear market!
Volatility
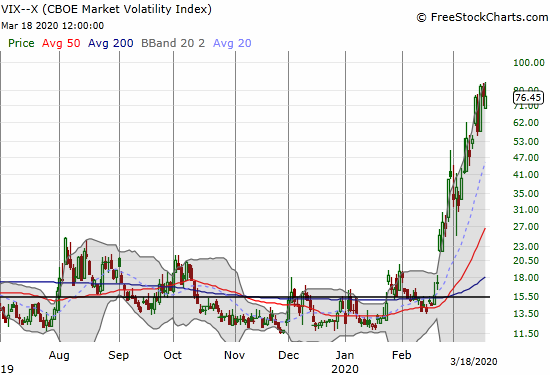
On Monday, March 16th, the volatility index (VIX) set a new all-time record closing high since its formulation in 1990. The prior high was set on November 20, 2008. The all-time intraday high of 89.5 from October 24, 2008 still stands. I am duly noting that the VIX topped out a full 4-5 months before the stock market reached its generational bottom. It sure feels and seems like today’s culture of collapse will follow that model.
The Short-Term Trading Call
A grinding bear market takes its toll. The oversold trading rules went overboard a while ago. Like my approach with housing-related stocks, I have largely stepped aside from accumulating further positions. I am now looking at very targeted trades while I wait for the market to stabilize and/or recover. I have also dabbled in more backstops (shorts and puts) for the swollen portfolio of long positions. I am hoping that once this oversold period ends, I can return to a cleaner execution of the AT40 oversold trading rules.
In a sea of bad news, my next beacon and sliver of hope is a great CNBC Fast Money interview with Kyle Bass. I think of Bass as a perma-bear, but this time around he had a few constructive (meaning positive) observations on the stock market. I highly recommend listening in.
Stock Chart Reviews – Below the 200DMA
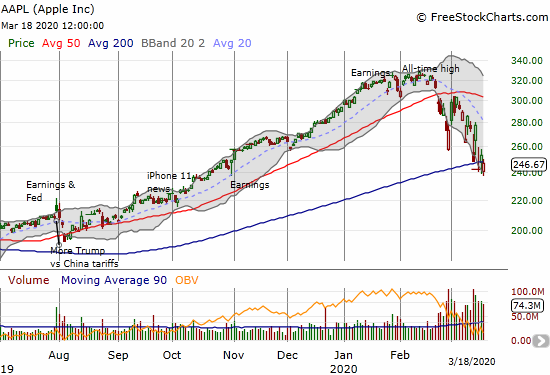
Apple (AAPL)
The stock market lost Apple (AAPL) on Monday. The next day the stock came back and reclaimed its 200DMA. Today, it gave up support once again. Although AAPL is on a steep downtrend, this battle for 200DMA support remains psychologically important (ok, maybe just for me). With so few stocks trading above their 200DMAs, AAPL sticks out as one of the last bulwarks of the market during this culture of collapse.
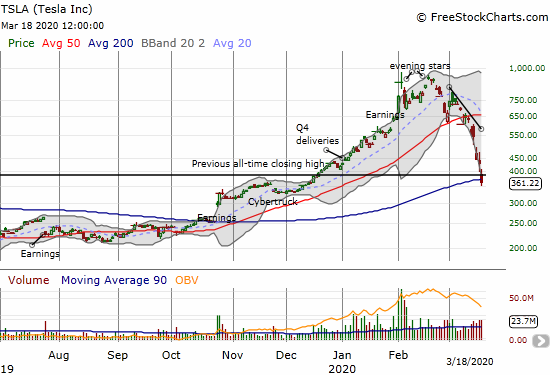
Tesla (TSLA)
Tesla (TSLA) finally left the elite club of stocks still trading above their respective 200DMAs. The stock lost 16.0% after California’s Alameda county government refused to allow Elon Musk to designate his business as essential during this period of “shelter-in-place.” The manufacturing plant in Fremont must now shut down as part of the order that has the entire Bay Area on lockdown. The day’s loss also finishes reversing all of TSLA’s heady gains from the December breakout.
Stock Chart Reviews – Above the 200DMA
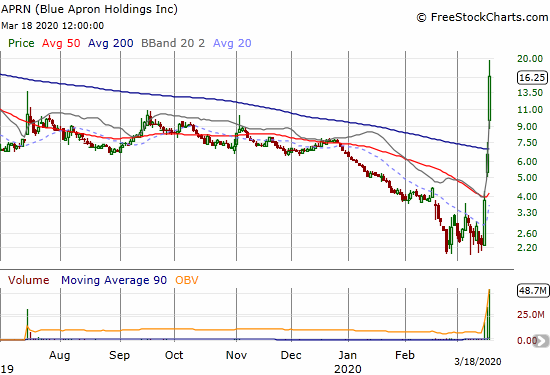
Blue Apron (APRN)
Here we go again. Speculators have suddenly caught a liking to nearly bankrupt Blue Apron (APRN). The company looks like a good investment in helping people get food during shelter-in-place lockdowns across the country. The stock also looks “cheap” because of its low price relative to the intraday high of $165 from APRN’s first days as a publicly-traded company (APRN has had to reverse splits to maintain listing standards).
In just three days, it looked like a large swath of money emptying out the rest of the stock market went into APRN. The result is a massive gain that is sure to attract even more speculators. The company reported earnings a month ago, so speculators could run up the stock for another two months or so before reality hits.
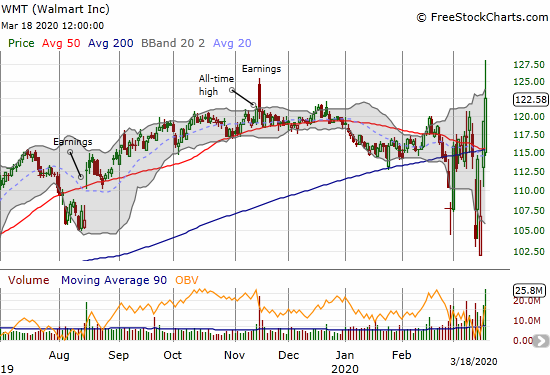
Walmart (WMT)
Walmart (WMT) did a rare thing in this market: it hit an all-time high. The promise of massive fiscal stimulus to help Americans spend money while on lockdown sent investors scrambling to hoard shares. I am surprised other retailers like Target (TGT) did not similarly benefit; perhaps those rallies are coming? I have TGT on my cross-hairs as a select buy.
— – —
FOLLOW Dr. Duru’s commentary on financial markets via email, StockTwits, Twitter, and even Instagram!
“Above the 40” uses the percentage of stocks trading above their respective 40-day moving averages (DMAs) to assess the technical health of the stock market and to identify extremes in market sentiment that are likely to reverse. Abbreviated as AT40, Above the 40 is an alternative label for “T2108” which was created by Worden. Learn more about T2108 on my T2108 Resource Page. AT200, or T2107, measures the percentage of stocks trading above their respective 200DMAs.
Active AT40 (T2108) periods: Day #16 under 20% (oversold day #16), Day #17 under 30%, Day #28 under 40%, Day #19 under 50%, Day #38 under 60%, Day #42 under 70%
Daily AT40 (T2108)
")
Black line: AT40 (T2108) (% measured on the right)
Red line: Overbought threshold (70%); Blue line: Oversold threshold (20%)
Weekly AT40 (T2108)

*All charts created using FreeStockCharts unless otherwise stated
The T2108 charts above are my LATEST updates independent of the date of this given AT40 post. For my latest AT40 post click here.
Be careful out there!
Full disclosure: long QQQ calls and shares, long SSO, short UVXY, short AAPL put spread
*Charting notes: FreeStockCharts stock prices are not adjusted for dividends. TradingView.com charts for currencies use Tokyo time as the start of the forex trading day. FreeStockCharts currency charts are based on Eastern U.S. time to define the trading day.