
The Market Breadth Summary: AI Crash
- The AI crash drove steep losses across semiconductors, optical-networking stocks, and major technology companies before buyers quickly absorbed what appeared to be forced selling.
- Market breadth remained resilient, with AT50 ending at 51.7% and AT200 holding near 56%, while the VIX finished the week lower.
- The S&P 500 and NASDAQ gained for the week, but unresolved moving-average breakdowns and resistance levels preserved both bullish and bearish interpretations.
- Rising Treasury yields, a strengthening yen, and sharply divergent earnings reactions across technology and AI-related stocks kept broader risk conditions unresolved.
The Stock Market Summary
First, technology cracked and next the AI trade crashed. The crash is not obvious because the stock market absorbed the crash quickly and, perhaps most importantly, many AI trades are still up significantly for the year despite trading down 30%, 40%, 50% and more from their all-time highs. The crash was initially hidden by the poor reaction to more jawboning against inflation from the Federal Reserve Chair Kevin Warsh (see “Warsh Doubled Down On Jawboning Even As the Fed Fights Over Rate Hikes” in my Inflation Watch blog). Wednesday’s broad-based selling looked like a recognition that the bond market’s displeasure with Warsh also equated to trouble for stocks. By Thursday morning, a more likely culprit had emerged, along with broader recognition that the AI trade had crashed. Situational Awareness, a highly leveraged fund heavily concentrated in the AI trade and shorts against software, collapsed on Wednesday in a flurry of forced selling that apparently started in early July. Soon after the revelation of the news, Citadel stepped in and bought publicly traded assets on the cheap, and bullish traders rushed into the vacuum left by the stampede out of AI stocks. The market absorbed the crash, yet resolved nothing.
The bulls scored with the major indices managing to make gains for the week. Market breadth held its critical support. The volatility index (VIX) even plunged to a two-week low. Yet, many elements of the AI trade remain in downtrends and/or trade under topping patterns. The NASDAQ remains in bearish breakdown territory. The S&P 500 is stuck. The Russell 2000 is in a short-term downtrend. And now a strengthening Japanese yen could force more unwinding of leveraged bets on risky assets (in the form of the carry trade). The market is flashing support for the bull and bear narratives. Nothing is yet resolved.
In the meantime, I am looking for opportunities to get back into some AI-related trades. The technicals helped me to make timely exits as well as avoid chasing AI-related trades at exactly the wrong time. Given my specialty in trading during extreme market conditions, I consider the AI crash a moment for “bargain” shopping and not for panic.
S&P 500 (SPY)
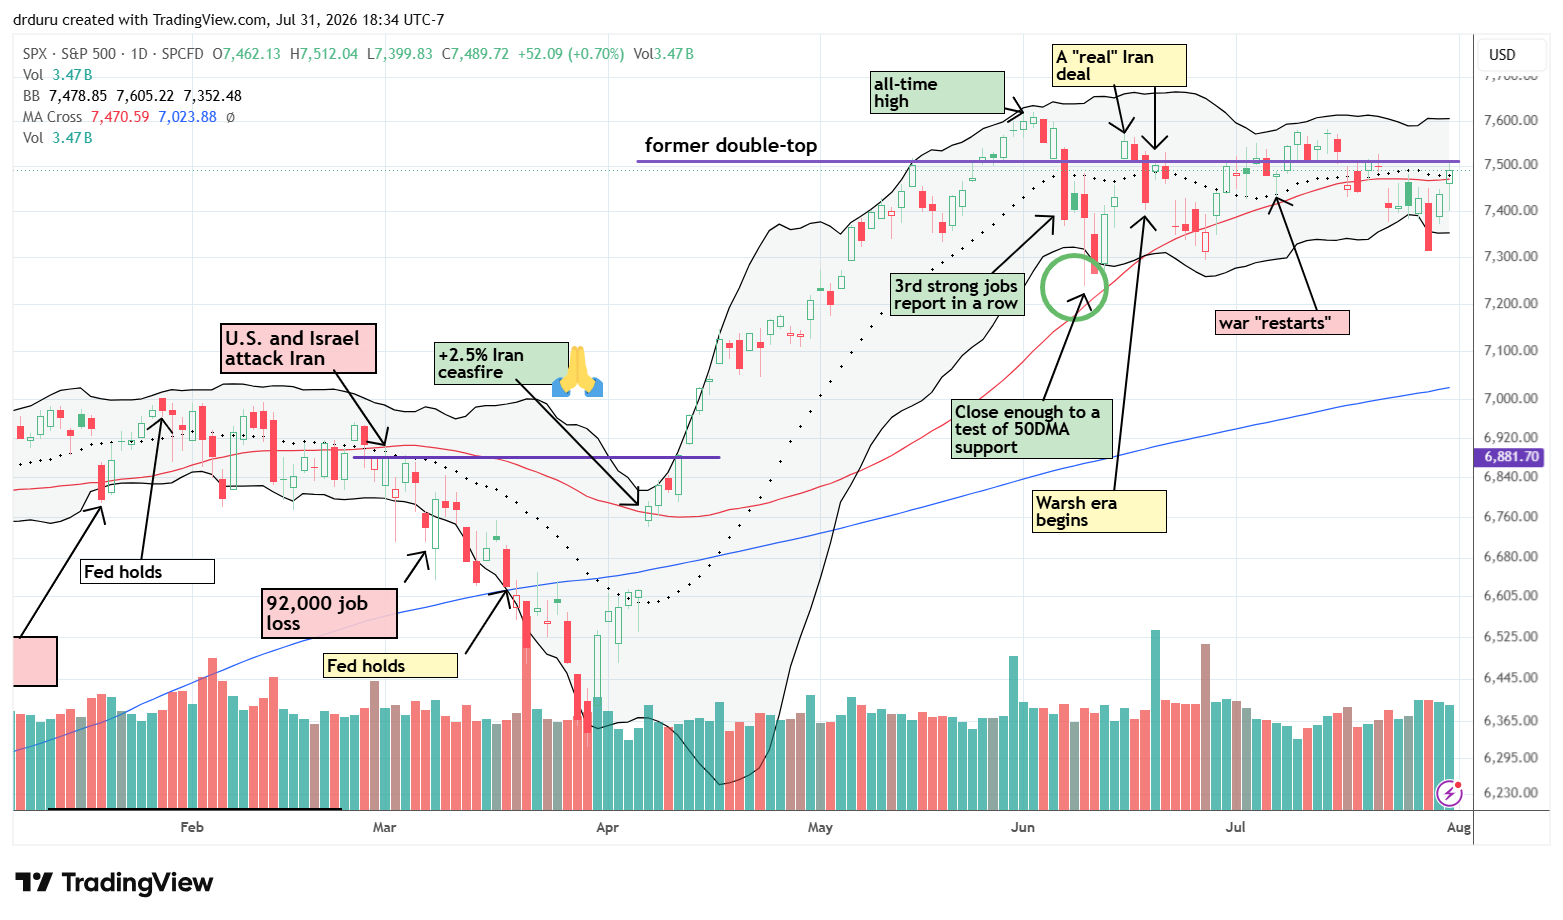
The S&P 500 (SPY) went into last week carrying the burden of a breakdown below its 50-day moving average (DMA) (the red line). Wednesday’s 1.5% drop to a 6-week low looked at the time like the beginning of a larger sell-off. Instead, buyers gapped the index higher the next day and even printed a 1.7% gain. On Friday, the S&P 500 closed above its 50DMA but shrank from its “7,500 wall.” The index gained 1.1% on the week. While the index absorbed the AI crash, it resolved nothing given the persistent trading range.
NASDAQ (COMPQ)
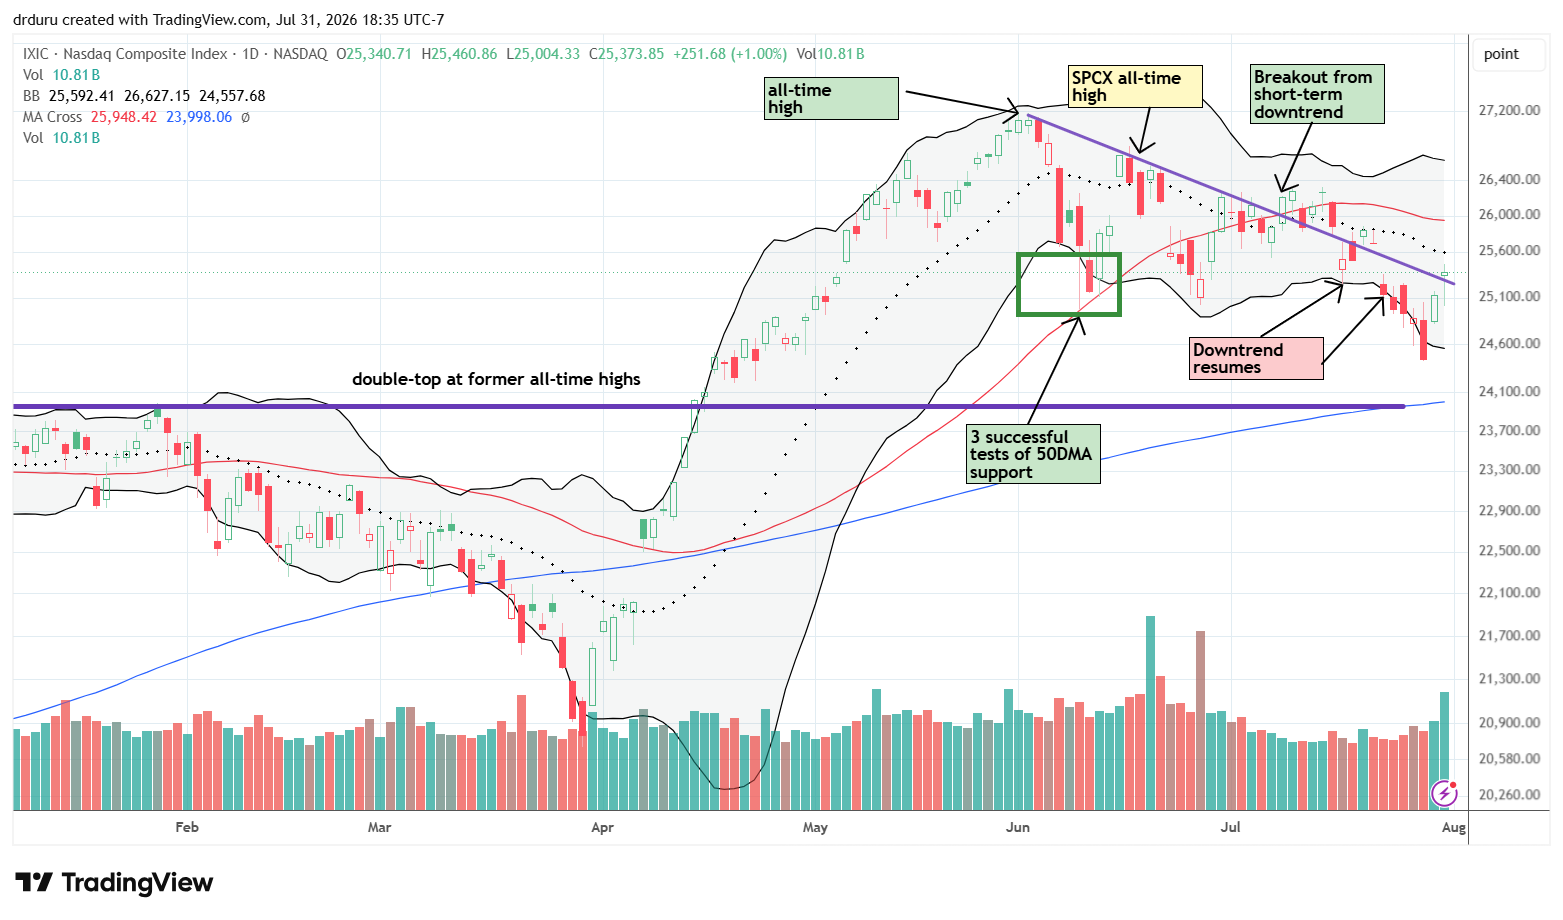
The NASDAQ (COMPQ) remained in a downtrend and ended the week well below its 50DMA. Buyers gapped the tech-laden index so strongly that it opened on Thursday exactly where it opened Wednesday before the sharp sell-off. The NASDAQ jumped like a previously coiled spring after trading at or below its lower Bollinger Band (the black line) for 5 straight trading days. After the dust settled, the NASDAQ gained 1.6% for the week; AI crash absorbed, for now.
iShares Russell 2000 ETF (IWM)
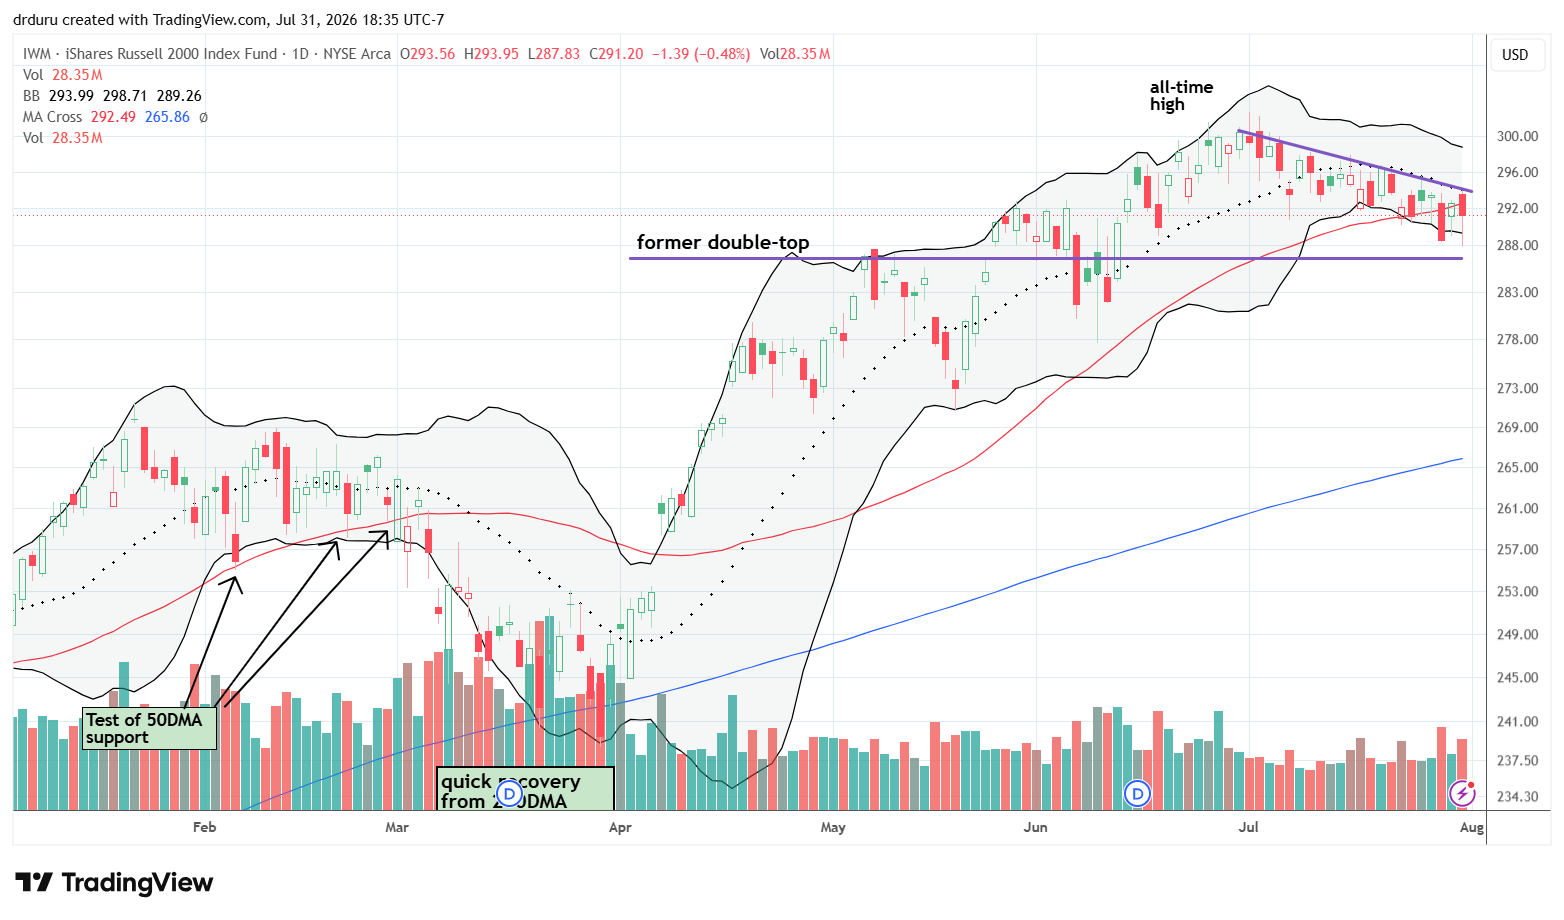
The iShares Russell 2000 ETF (IWM) closed exactly flat for the week after pivoting around its 50DMA. The ETF of small caps is now trading underneath a downtrend well-defined by its 20DMA (the dashed line). Resolution for IWM would happen above $294.10 and below $286 where IWM recorded a double-top stretching from last summer to the winter. Small caps are feeling the heaviest weight from rising bond yields. At one point, IWM even traded below its Wednesday close. Buyers rushed in at that point and closed IWM with a minimal loss for the day.
The Short-Term Trading Call With An AI Crash
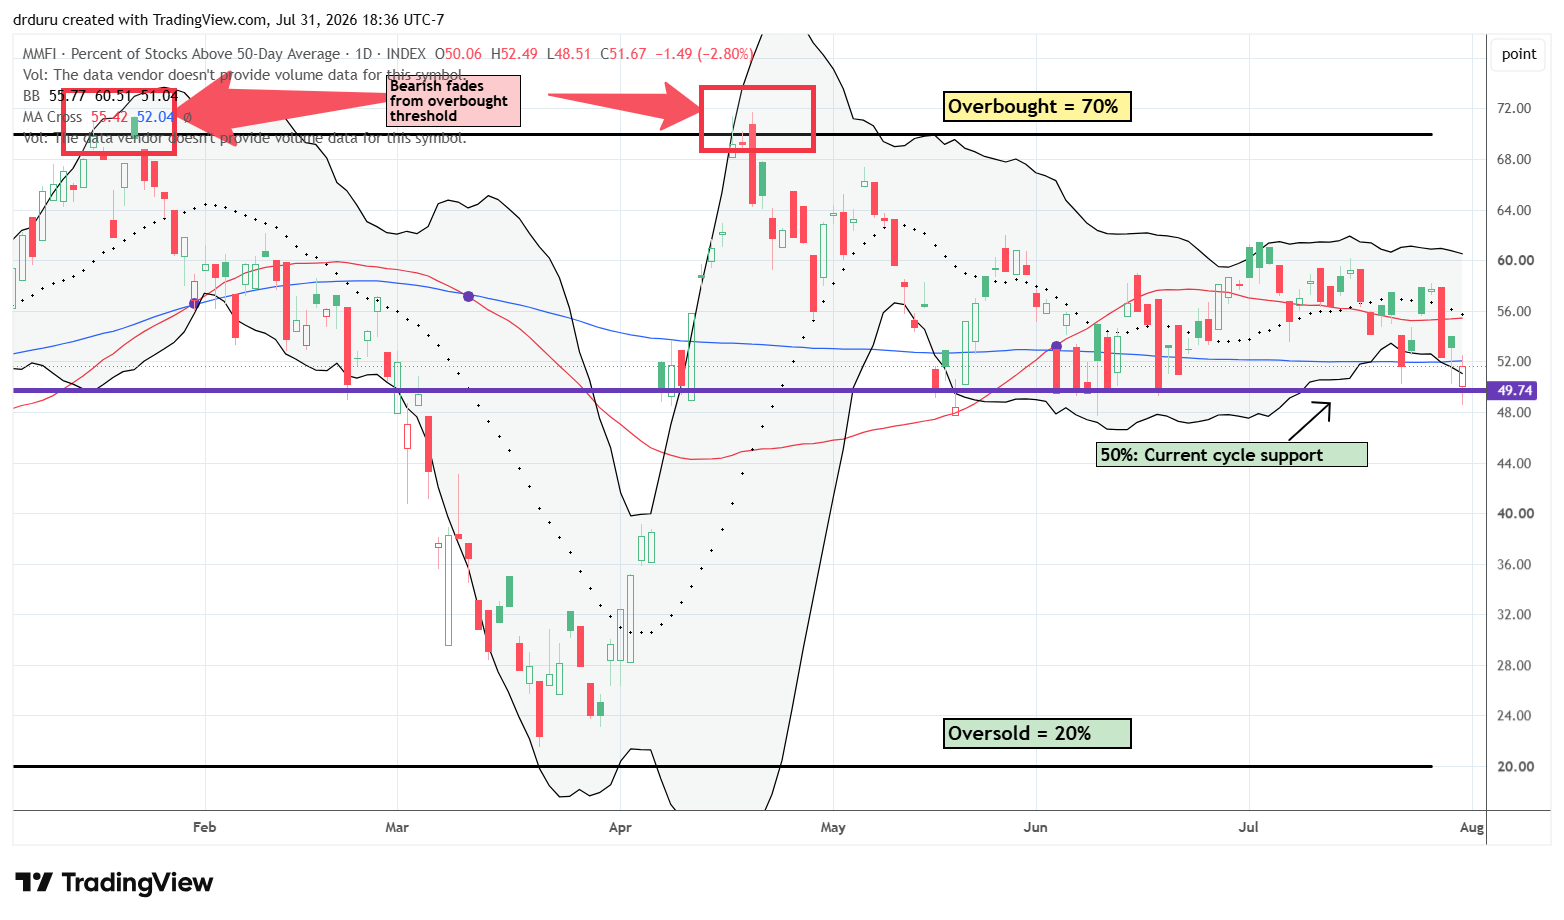
- AT50 (MMFI) = 51.7% of stocks are trading above their respective 50-day moving averages
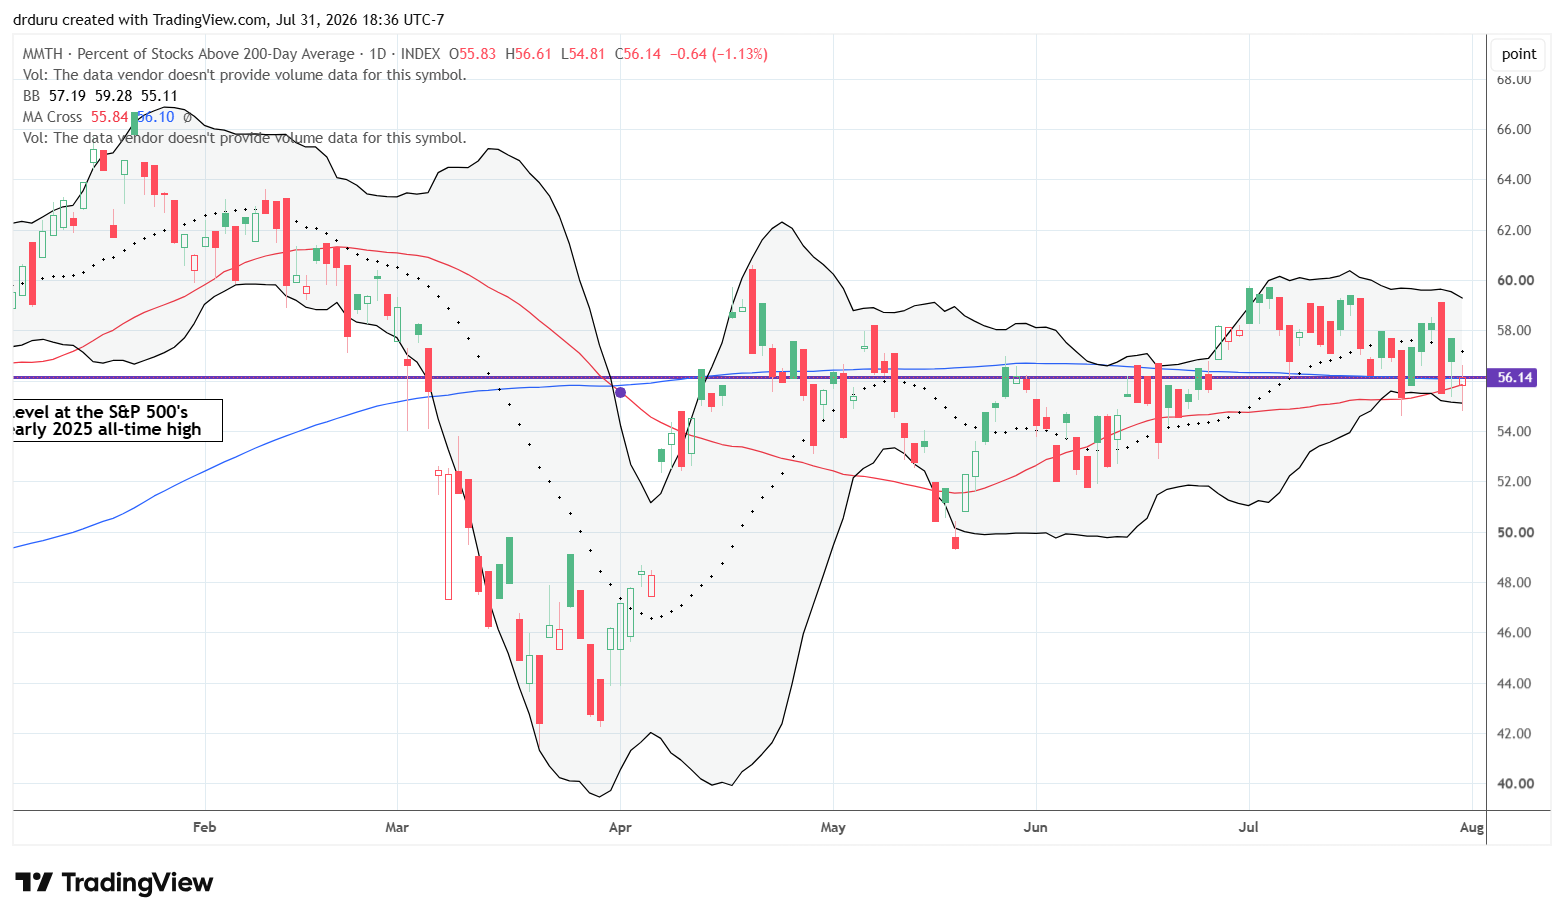
- AT200 (MMTH) = 56.1% of stocks are trading above their respective 200-day moving averages
- Short-term Trading Call: neutral
AT50 (MMFI), the percentage of stocks trading above their respective 50DMAs, closed the week at 51.7%.
My favorite technical indicator drifted lower for most of July, yet held support around the 49-50% level. AT50 has churned in a trading range since May. Over this time, it has prevented me from worrying about the pain in any particular sector of the market. As long as market breadth holds up, I know the bearishness in technology stocks is isolated.
AT200, the percentage of stocks trading above their respective 200DMAs, closed the week at 56.1%. Like AT50, this longer-term indicator of the health of market breadth is overall going nowhere. Thus, I have little reason to worry about the overall market indices even with the AI crash.
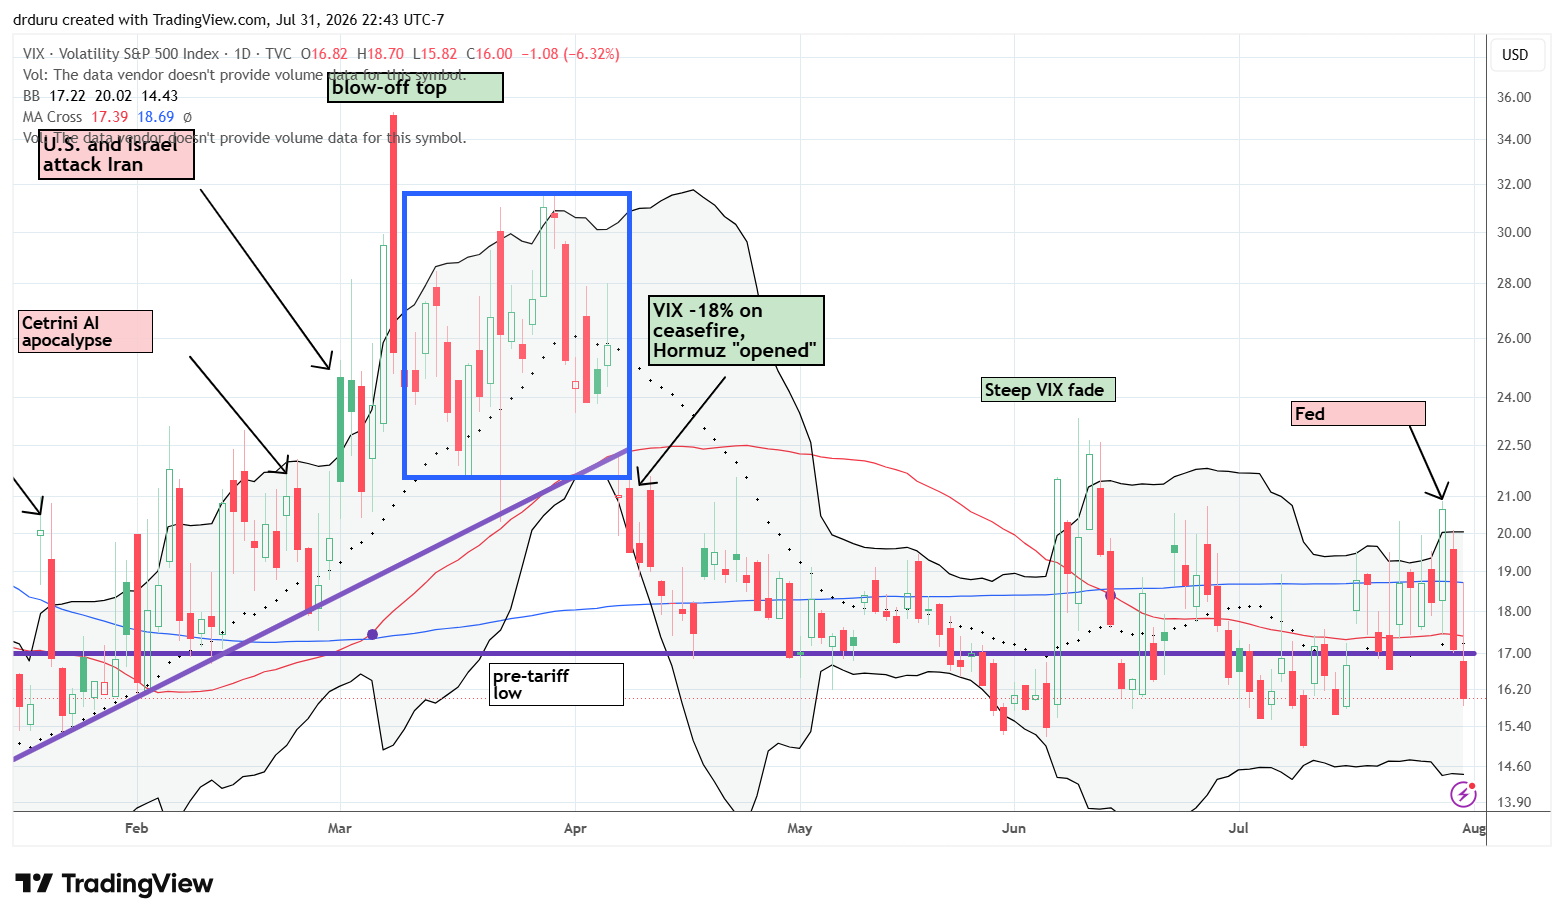
The volatility index (VIX) managed to close the week lower and thus further confirmed that the market absorbed the AI crash without broader damage. The VIX did pop on Wednesday to a six-week high, but faders stepped in with force on Thursday and Friday. I am surprised that the VIX so decisively dropped given the ongoing rise in long-term bond yields.
In case you missed it…
I summarized my thoughts about last week’s Federal Reserve meeting.
The Equities
VanEck Semiconductor ETF (SMH)
Description: SMH tracks a concentrated portfolio of major semiconductor designers, manufacturers, and equipment companies.
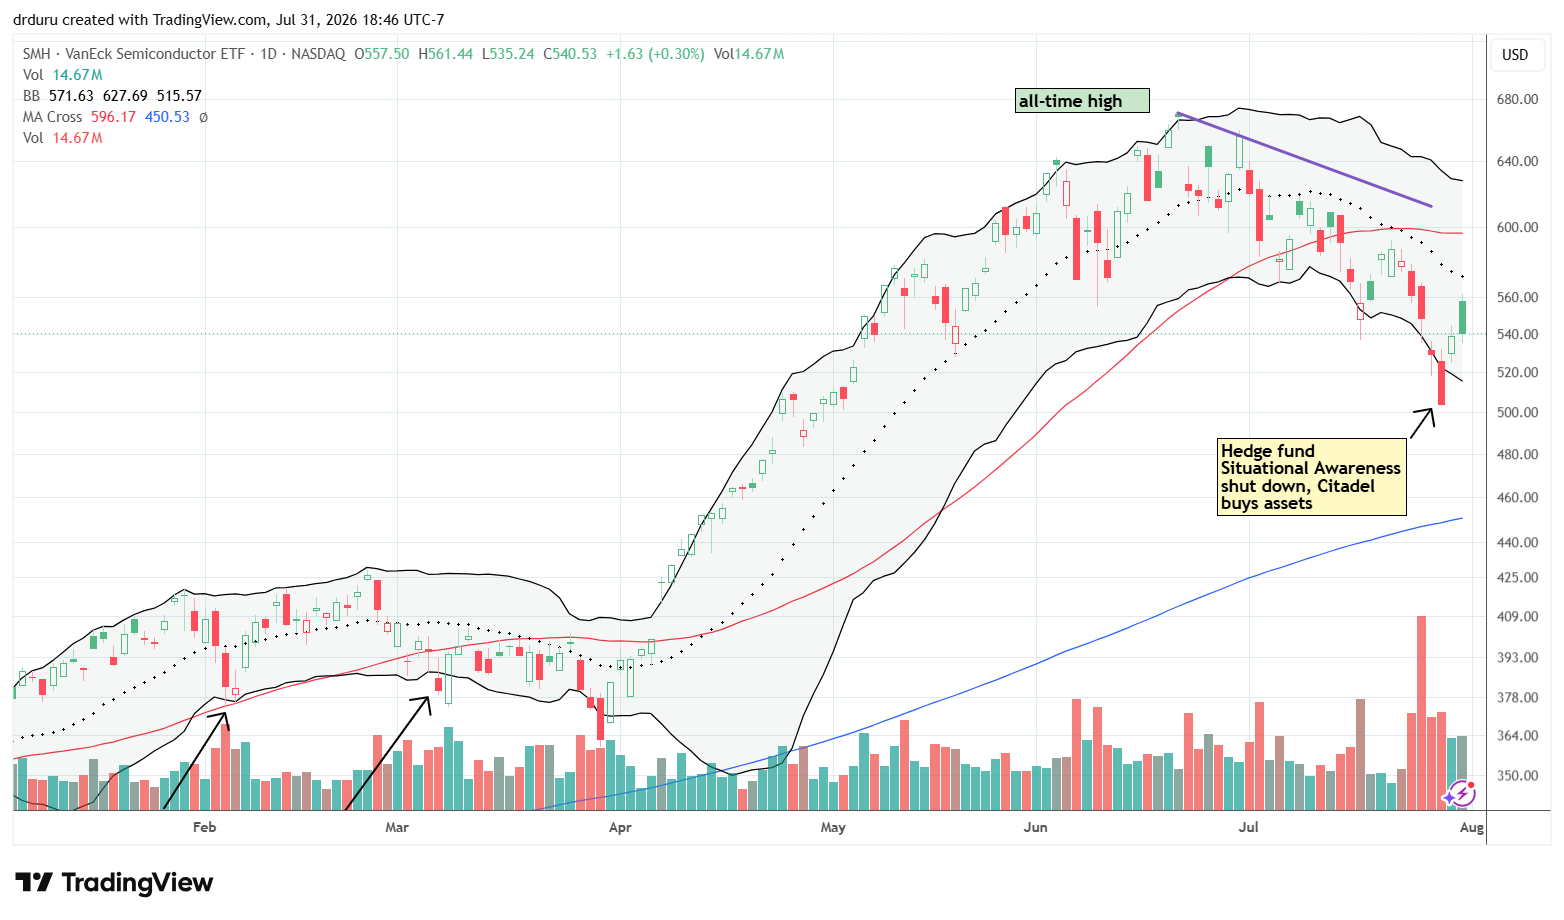
Technical status: The VanEck Semiconductor ETF (SMH) rebounded towards its 20DMA after Citadel symbolically saved AI stock assets. A two-month-long downtrend remained firmly in place.
Trade commentary: SMH represents the AI crash and the subsequent rebound in the AI trade. Semiconductor stocks suffered a major liquidation before staging a major comeback after Citadel absorbed most of Situational Awareness’s public portfolio. The rebound relieved forced-selling pressure, but the scale of July’s semiconductor damage keeps the larger downtrend unresolved. Note that while SMH at its low point of the week was down 25% from its all-time high, the ETF was still up 40% for the year.
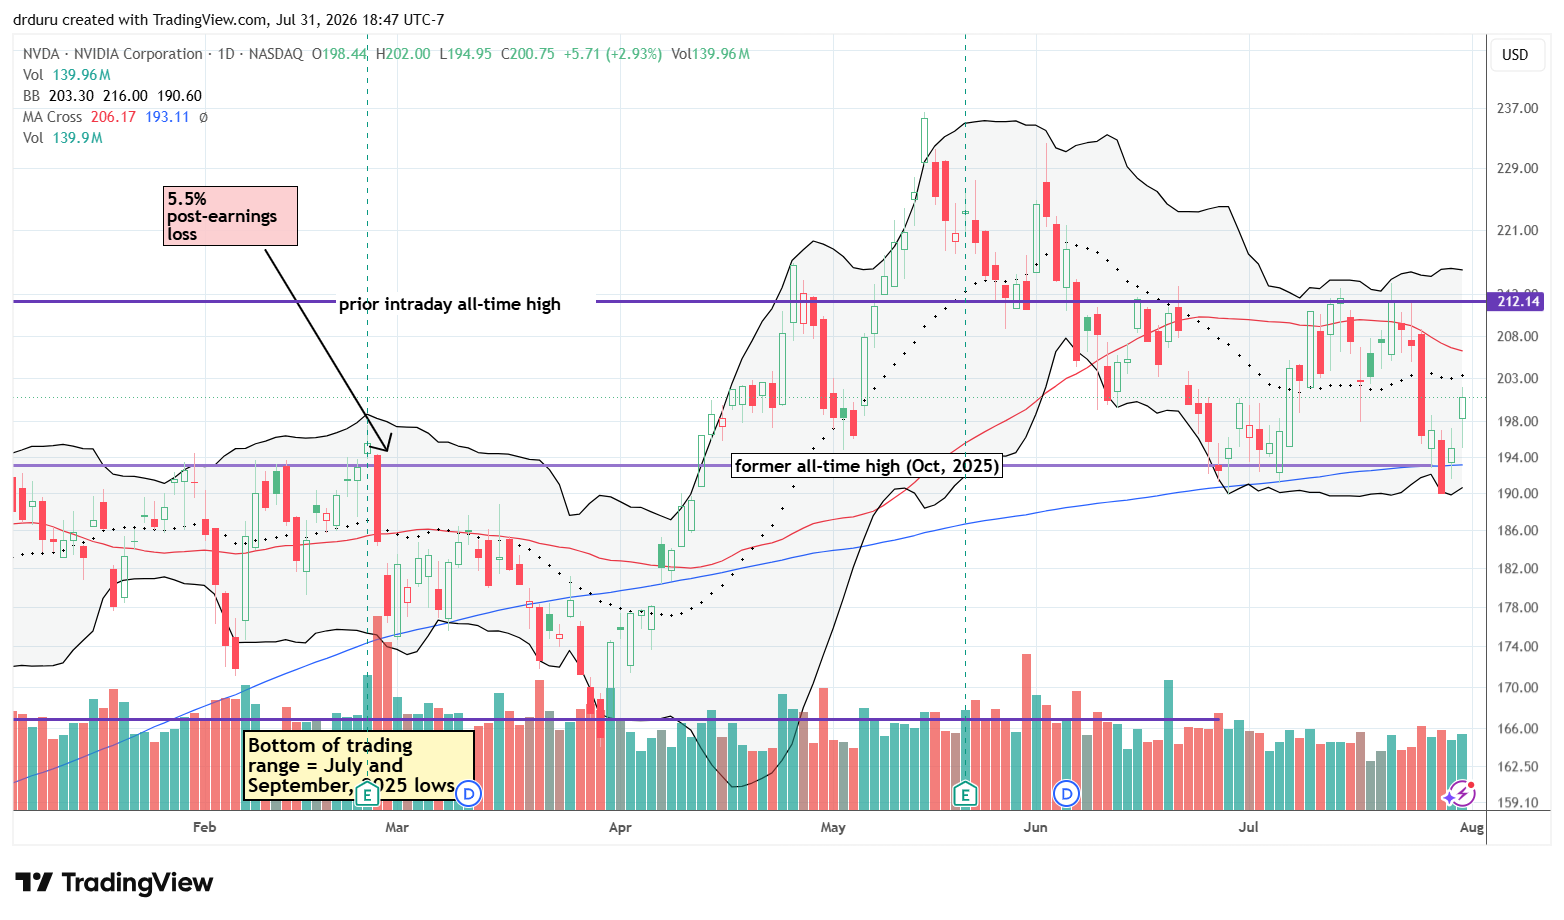
NVIDIA Corporation (NVDA)
Description: NVIDIA designs accelerated-computing processors, networking products, and software used extensively in artificial intelligence and data centers.
Technical status: NVIDIA Corporation (NVDA) tumbled below its 200DMA after failing at 50DMA resistance. A rebound from a near four-month low kept NVDA in a trading range.
Trade commentary: NVIDIA is a primary sentiment gauge for the AI trade. The stock got caught in Wednesday’s sell-off, but it “only” lost 3.6% on that day. The rebound the next day saved NVDA from confirming a 200DMA breakdown. Still, NVDA’s positioning remained unresolved given the stock continued to trade in its recent range.
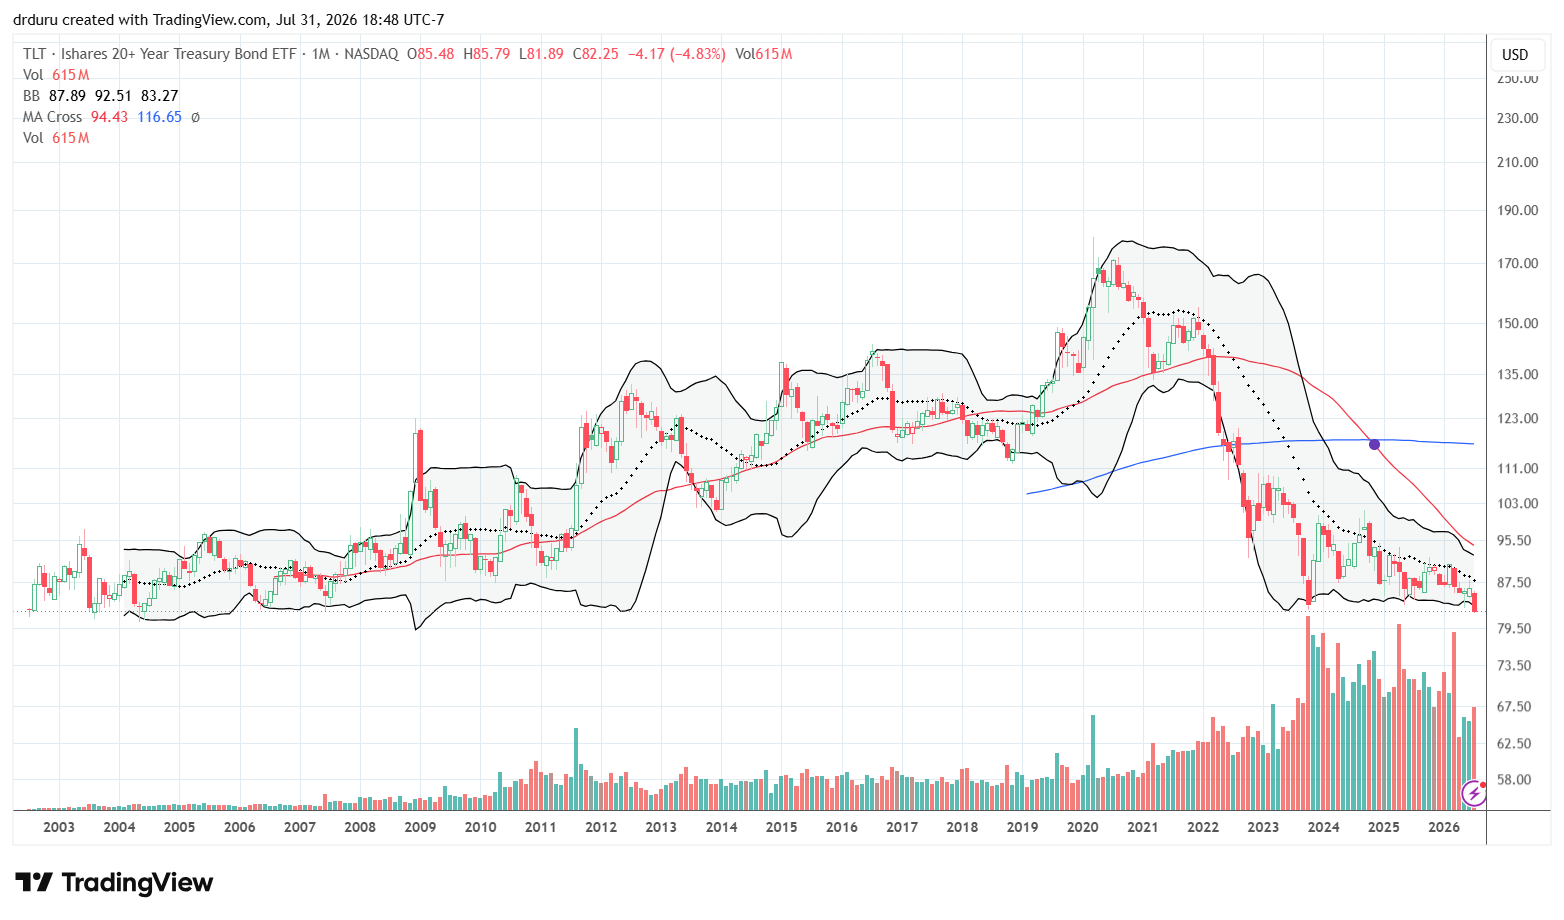
iShares 20+ Year Treasury Bond ETF (TLT)
Description: TLT holds long-dated U.S. Treasury securities and generally moves inversely to long-term Treasury yields.
Technical status: The iShares 20+ Year Treasury Bond ETF (TLT) continued its multi-year downtrend, reaching levels as low as those from the 2000s.
Trade commentary: The 10-year Treasury yield reached approximately 4.74%, its highest level in more than a year. The 30-year Treasury yield reached 5.28%, a 19-year high. The return of long-term Treasury yields to levels last seen near the period preceding the Great Financial Crisis deserves close attention. The mortgage system is more robust today, but I remain on alert for stress elsewhere in the credit markets. Of course, this time is different with a more robust mortgage market in place. Still, I am on alert for a new credit blow-up. In the meantime, I am sticking with TLT to collect yield; I am also anticipating an eventual rebound to sell into. The surge in trading volume since 2023 suggests to me that the bond market is much more jittery than the stock market.
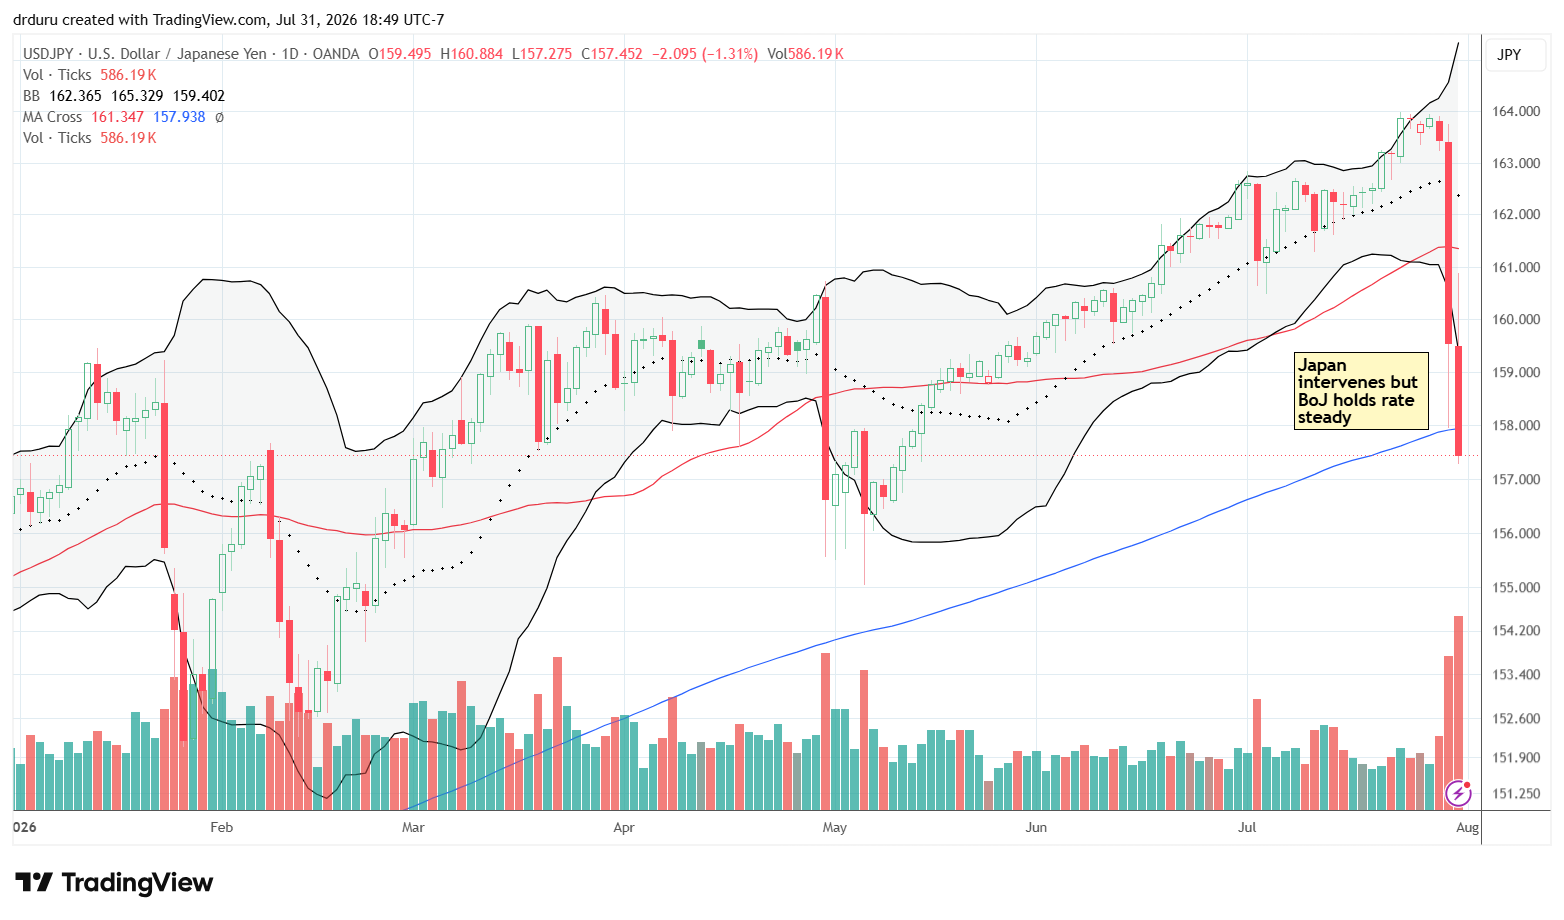
U.S. Dollar/Japanese Yen (USD/JPY)
Description: USD/JPY measures how many Japanese yen are required to purchase one U.S. dollar.
Technical status: U.S. Dollar/Japanese Yen (USD/JPY) crashed below its 50DMA and 200DMA, losing all of its gains since May after Bank of Japan intervention.
Trade commentary: The Bank of Japan intervened once, maybe twice, in currency markets in order to strengthen the long-suffering Japanese yen. The U.S. Treasury is helping out as well. The U.S. dollar versus the yen bounced perfectly off 200DMA support on Thursday but pierced support in a sudden rush of selling in the aftermarket on Friday. I am fading the intervention by going long AUD/JPY. I had two successful day trades, but the third got caught in the resurgent yen strength. Yen interventions ultimately fail, and this history could explain why financial markets are not dreading the prospect of a stronger yen.
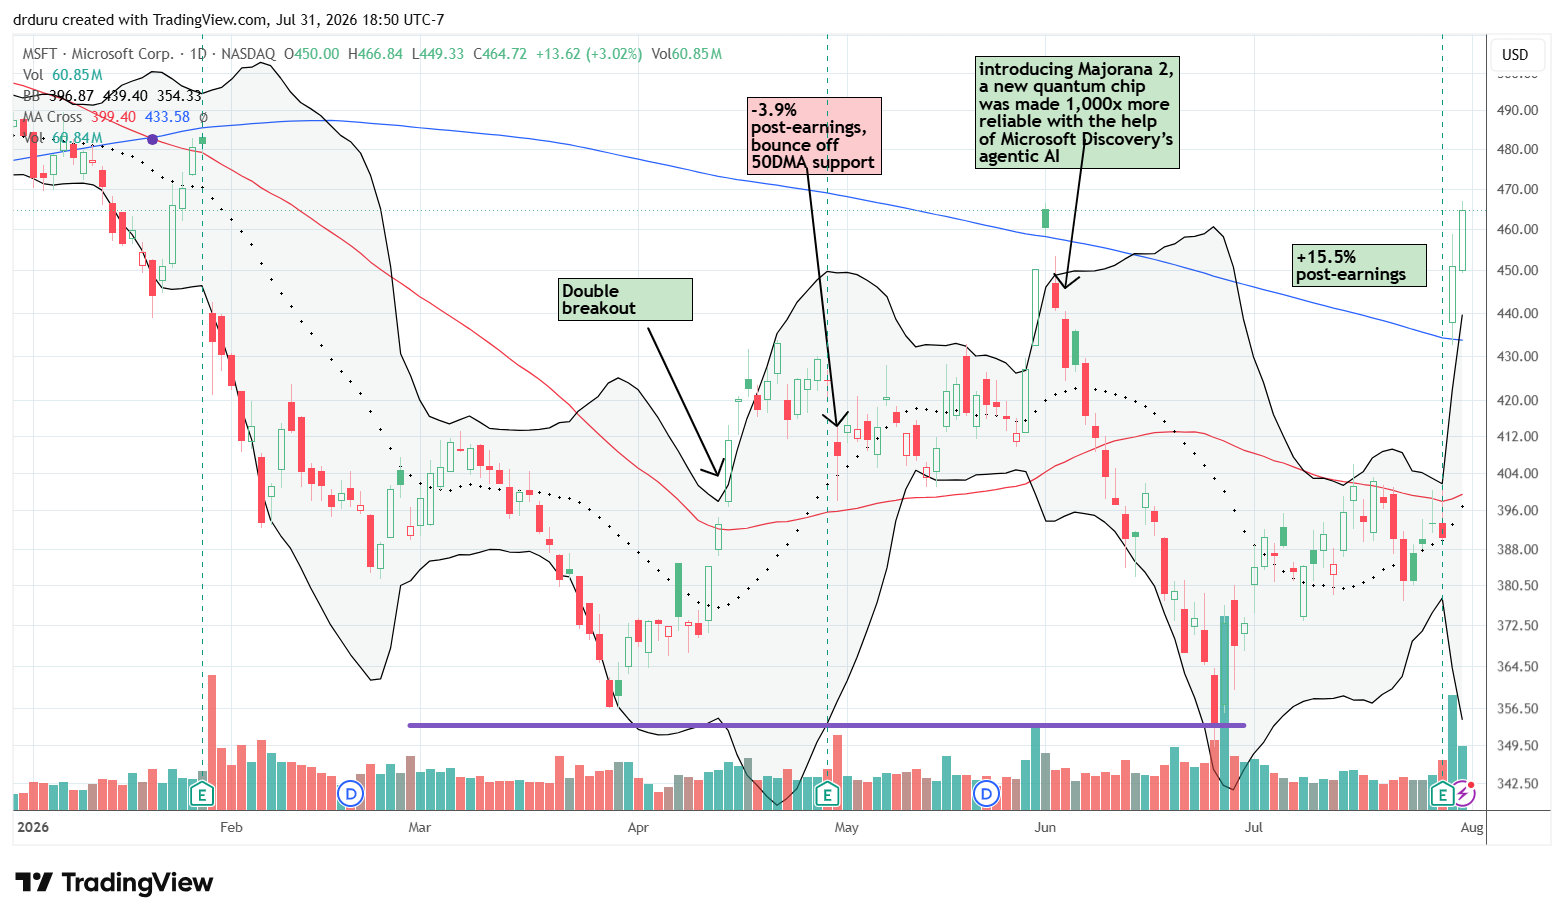
Microsoft Corporation (MSFT)
Description: Microsoft provides enterprise software, cloud infrastructure, productivity applications, gaming products, and artificial-intelligence services.
Technical status: Microsoft Corporation (MSFT) surged upward, breaking out above its 50DMA and 200DMA and rising by 15.5% post-earnings as it approached a new high for the year.
Trade commentary: Microsoft supplied the strongest positive answer to questions about AI spending. Azure revenue grew 43%, paid Copilot seats more than doubled to 30 million, and management projected strong growth and continued cash generation despite enormous infrastructure investment. The stock’s 15.5% post-earnings surge demonstrated that the market will still reward AI spending when monetization and financial discipline arrive together. The $450B one-day gain in market cap was a record. However, in my opinion, MSFT should never have traded as low as it did.
Meta Platforms, Inc. (META)
Description: Meta operates Facebook, Instagram, WhatsApp, Threads, and an expanding portfolio of artificial-intelligence and computing products.
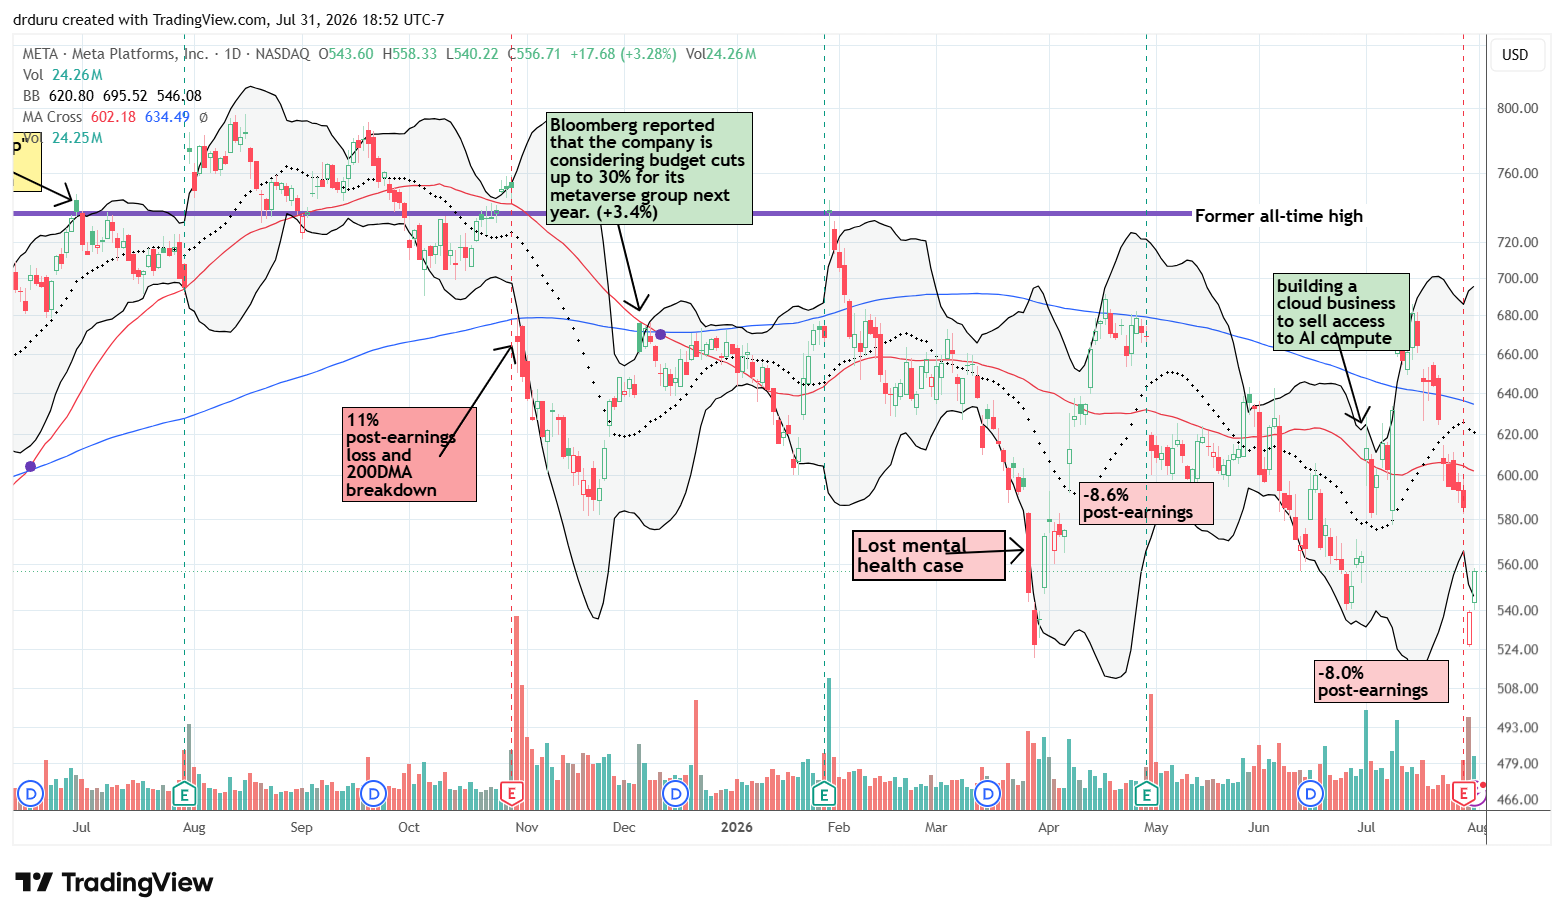
Technical status: Meta Platforms, Inc. (META) broke down below its 50DMA, and crashed under its lower Bollinger Band after a post-earnings 8% drop.
Trade commentary: Meta showed the other side of the AI-spending debate. Revenue remained strong, but free cash flow collapsed 91% as capital expenditures and restructuring costs surged. Meta Platforms also raised the lower end of its capex guidance from a range between $125B and $140B to $130B to $140B. The stock responded by losing as much as 10% before rebounding to an 8.0% post-earnings loss. The 3.3% gain on Friday demonstrates negativity on META was insufficient to break down the lower part of the 2+ year trading range. The stock bounced perfectly off its closing low of the year set on March 27, 2026.
Amazon.com, Inc. (AMZN)
Description: Amazon operates a global online marketplace, logistics network, advertising business, and the Amazon Web Services cloud platform.
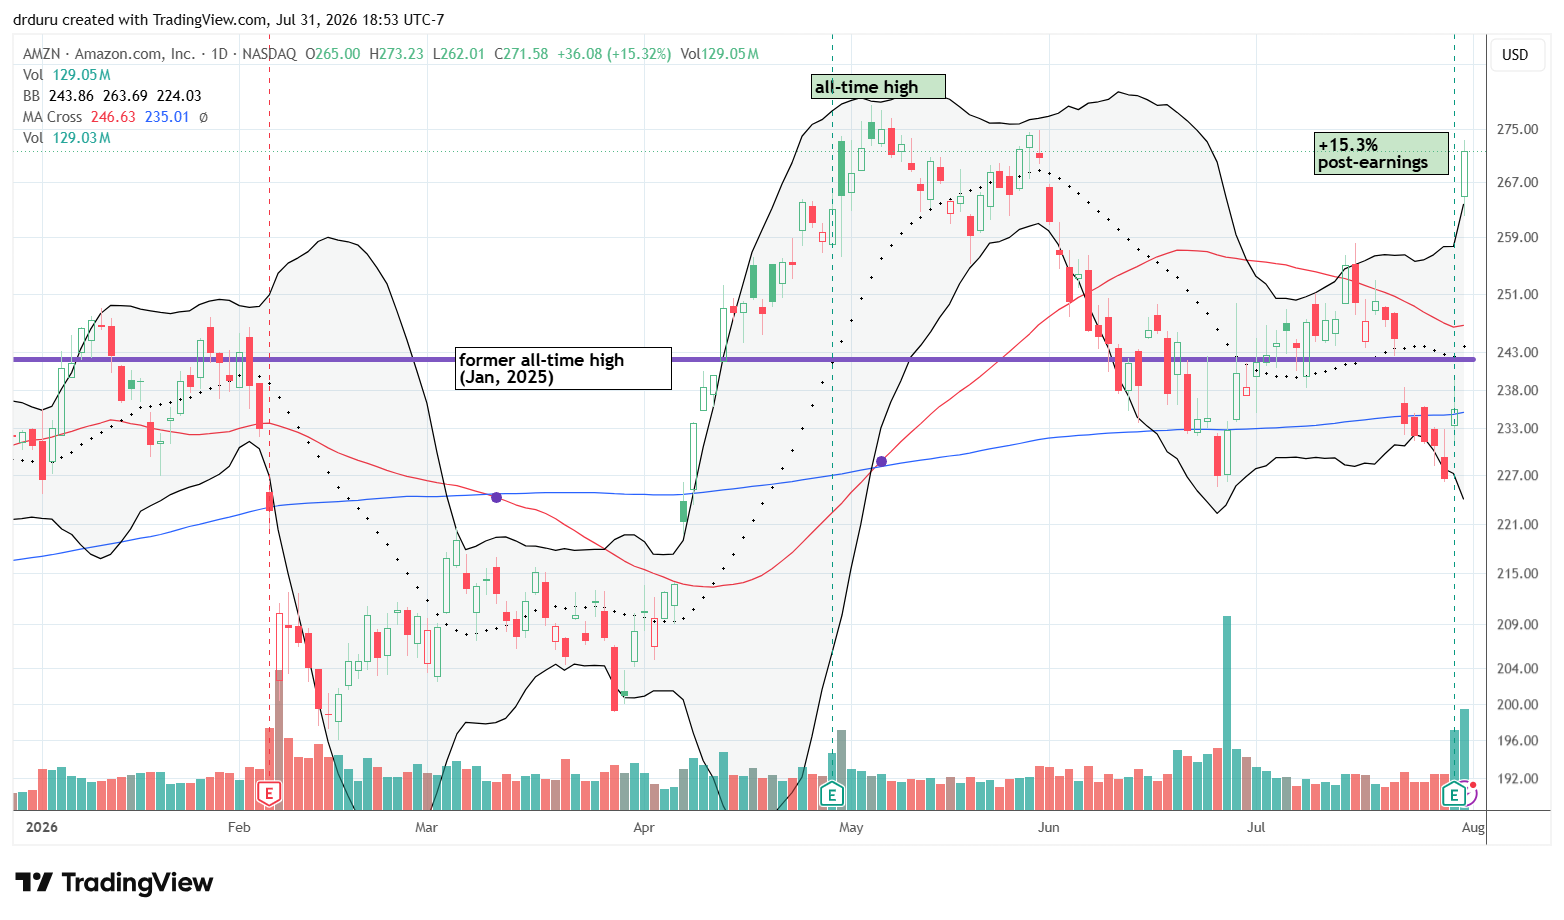
Technical status: Amazon.com, Inc. (AMZN) declined alongside its lower Bollinger Band and below 200DMA resistance until a 15.3% post-earnings surge that challenged the all-time high.
Trade commentary: AMZN’s post-earnings surge benefited from a reported acceleration in AWS growth by 37%, its strongest pace in more than four years. The market decided to look past higher AI capital spending and negative trailing free cash flow. I did not trigger the AMZN post-earnings trade because the stock gapped well above its upper Bollinger Band. If I had been quicker on my feet, I could have considered buying right at the open. Despite the surge, AMZN needs to hold a new all-time high to reestablish upward momentum.
Apple Inc. (AAPL)
Description: Apple designs consumer hardware, operating systems, digital services, and semiconductor components for its device ecosystem.
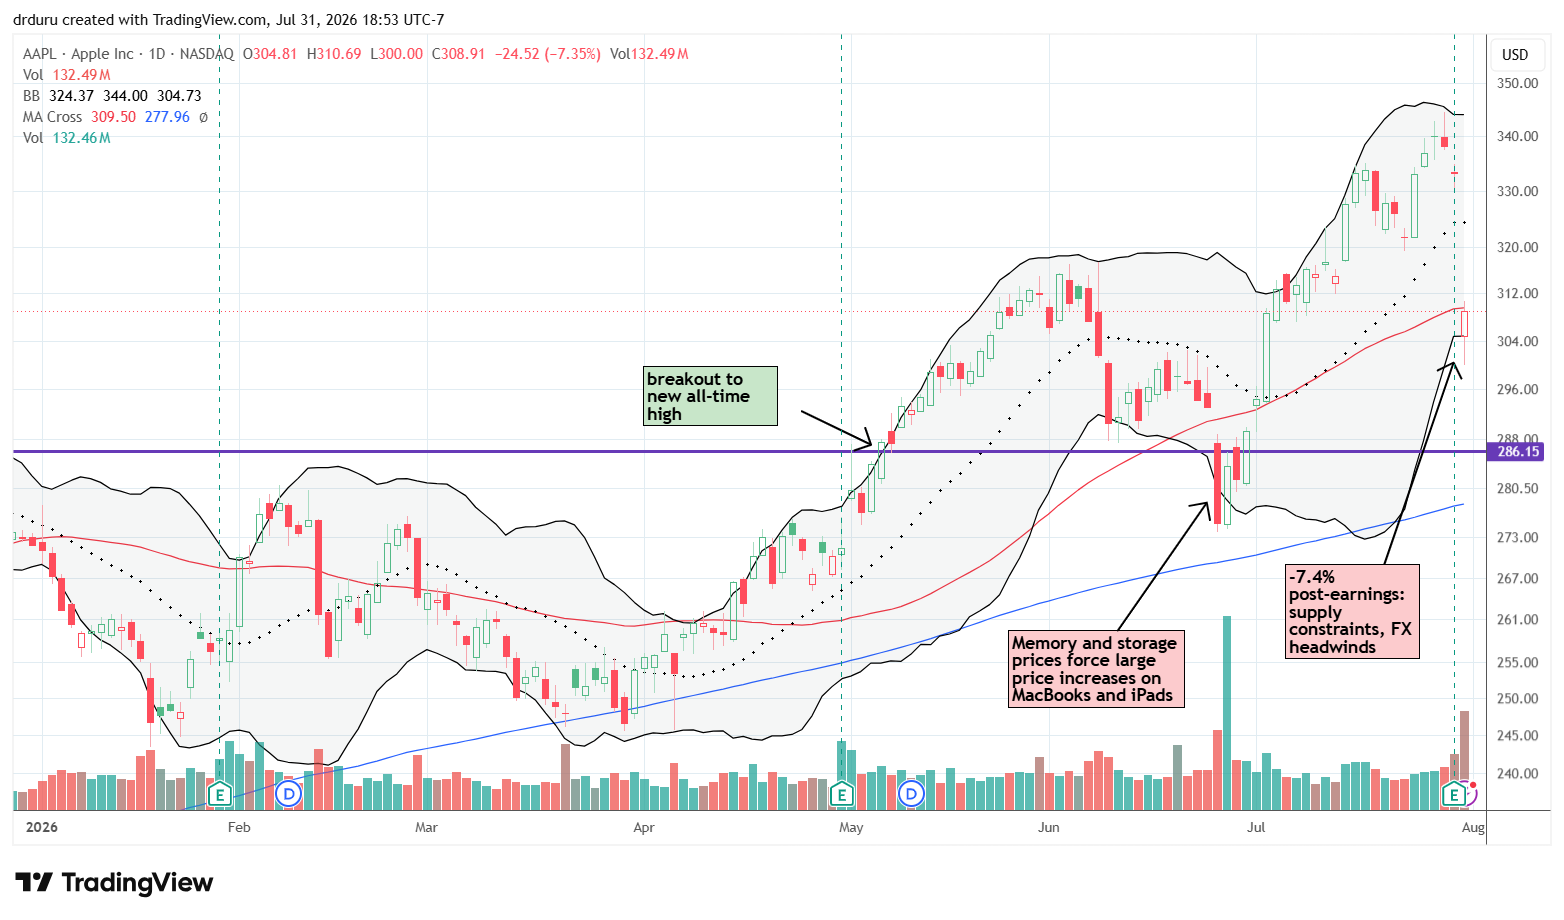
Technical status: Apple Inc. (AAPL) crashed down below its 50DMA with a 7.4% post-earnings loss, falling away from its all-time high.
Trade commentary: Apple delivered a dramatic negative earnings reaction despite beating quarterly revenue and profit expectations. According to Reuters, investors soured on weaker-than-expected forward growth, services results, supply constraints, and surging memory costs, sending the stock down as much as 9 or 10% before rebounding to 50DMA resistance. Like a lot of big cap tech, AAPL has a very high valuation, so I am more stunned by the extreme runup into earnings than I am the reversal of that surprising reversal of June’s concerns over price hikes. Before the post-earnings crash, AAPL had a price/sales ratio of 11 which is extremely high for a company heavily reliant on consumer hardware and tech (and yes, they are one of the best out there). The good news is that AAPL looks like a straightforward buy once it closes above its 50DMA.
Corning Incorporated (GLW)
Description: Corning manufactures specialty glass, ceramics, fiber-optic products, and connectivity systems used in communications networks, electronics, and data centers.
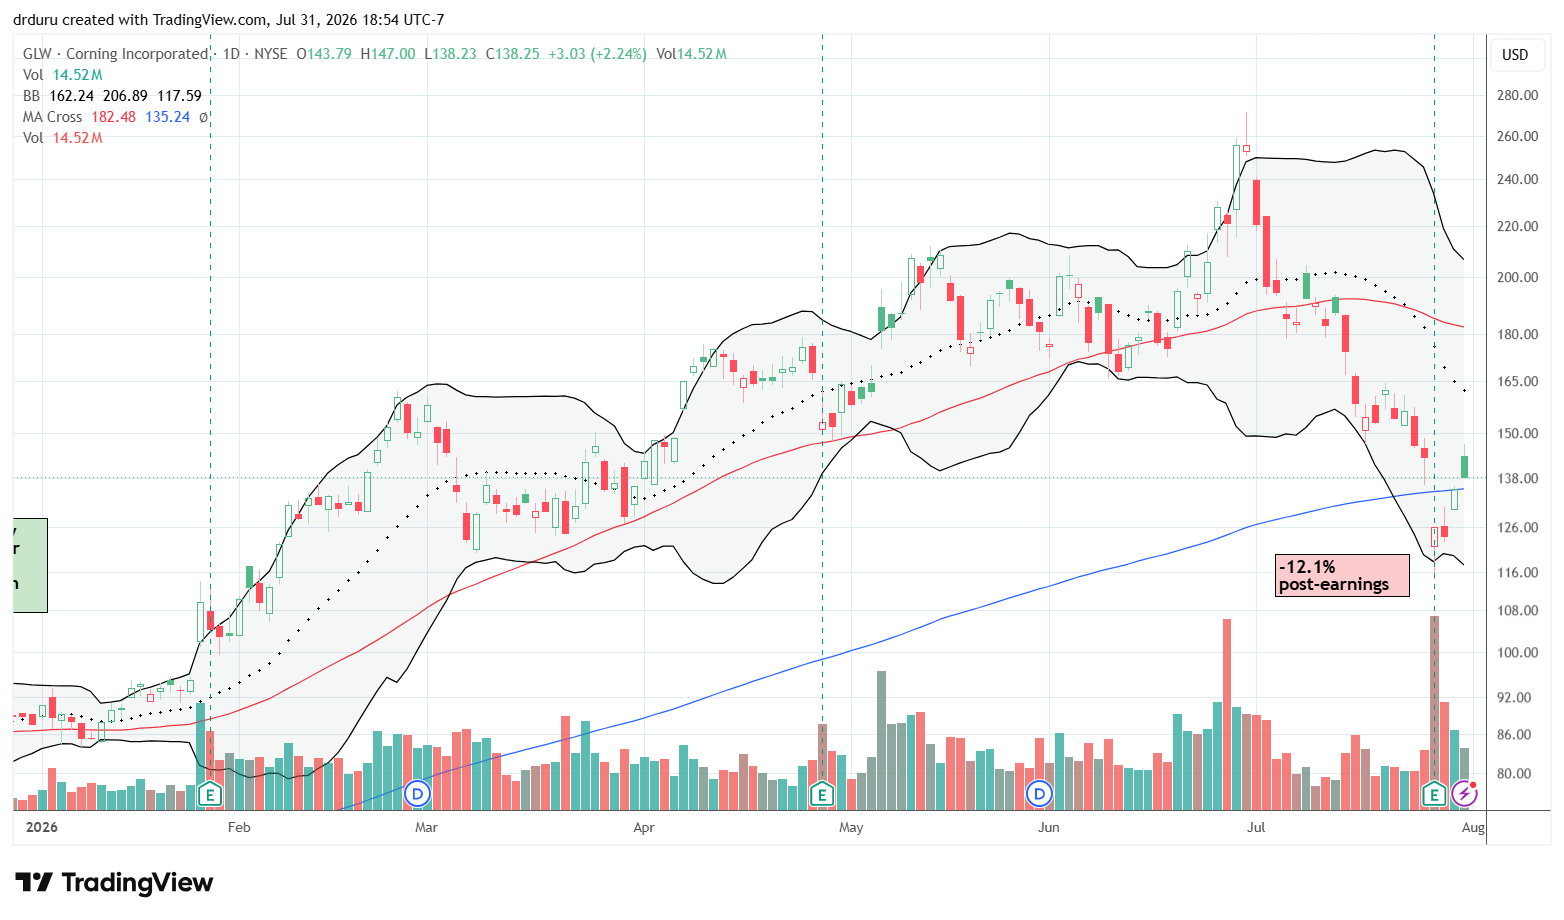
Technical status: Corning Incorporated (GLW) broke down below its 200DMA after a 12.1% post-earnings drop but soon closed the gap before fading.
Trade commentary: According to Reuters, Corning guidance only met or slightly missed elevated analyst expectations while manufacturing constraints limited the company’s ability to satisfy demand. The stock plunged as much as 20% before closing the day with a 12% loss. After another stumble on Fed day, the rebound momentum continued. The close above 200DMA resistance almost motivated me to buy the stock. However, I decided to wait for a true test of 200DMA support before considering a purchase.
Even after the rebound, GLW remains 46% below its all-time high. This AI crash is hidden by the 58% year-to-date gain.
Vertiv Holdings Co. (VRT)
Description: Vertiv supplies power-management, cooling, and infrastructure systems used in data centers and communications networks.
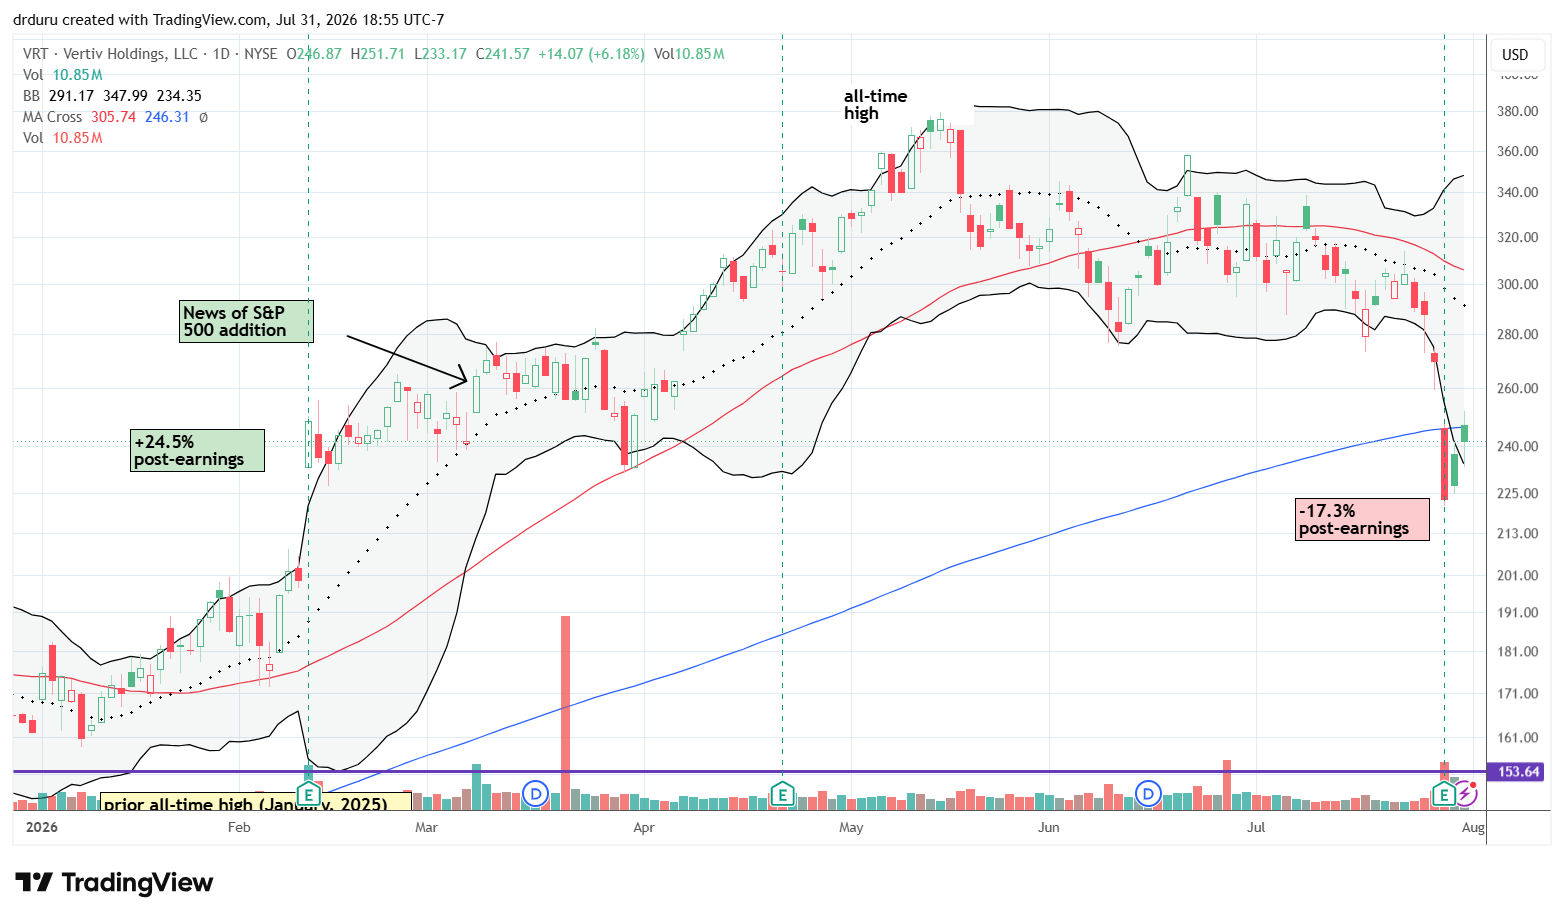
Technical status: Vertiv Holdings Co. (VRT) suffered from a 17.3% post-earnings drop, breaking down below its 200DMA. A sharp recovery faded at 200DMA resistance.
Trade commentary: According to Barron’s, Vertiv beat earnings estimates and raised its full-year outlook. Yet the stock crashed post-earnings. The revenue miss and project-timing challenges overwhelmed evidence of continued AI data-center demand. The extreme move motivated me to sell a weekly $215 put expiring on Friday. That trade worked out, and now I am waiting to see whether VRT can recover from its bearish 200DMA breakdown before considering another bullish trade. In the meantime, VRT is at risk of filling its February post-earnings gap at $201. Also note that, just as I feared could happen, VRT is now trading below its price when the S&P 500 announced inclusion of VRT in the S&P 500.
Fundrise Innovation Fund (VCX)
Description: VCX is a publicly traded closed-end venture fund holding stakes in private technology companies, including major private AI businesses.
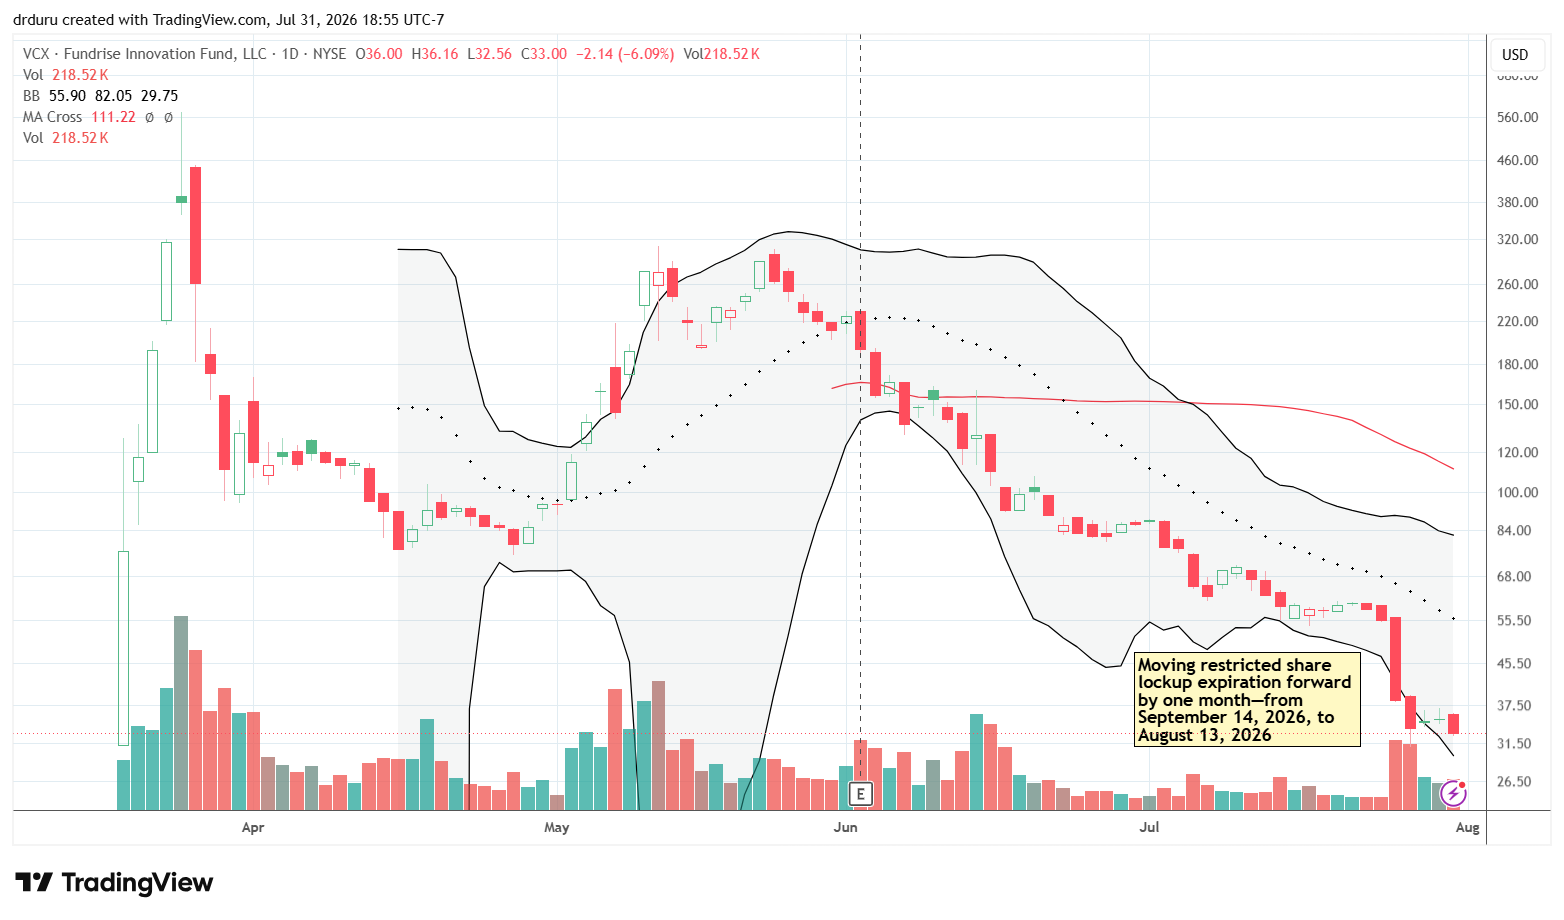
Technical status: The sell-off since May for Fundrise Innovation Fund (VCX) paused at its intraday all-time low but only after plunging 31.0% on lock-up news.
Trade commentary: VCX offers direct exposure to the speculative enthusiasm surrounding private AI companies such as Anthropic and OpenAI. The fund fell from approximately $55.62 on July 24 to around $35 by July 30 while still trading well above its reported net asset value. VCX’s compete reversal is another form of the AI crash. I have no interest in buying this fund until/unless it starts showing signs of bottoming….after the lock-up expiration of course.
Applied Materials, Inc. (AMAT)
Description: Applied Materials supplies equipment and services used to manufacture semiconductors and advanced displays.
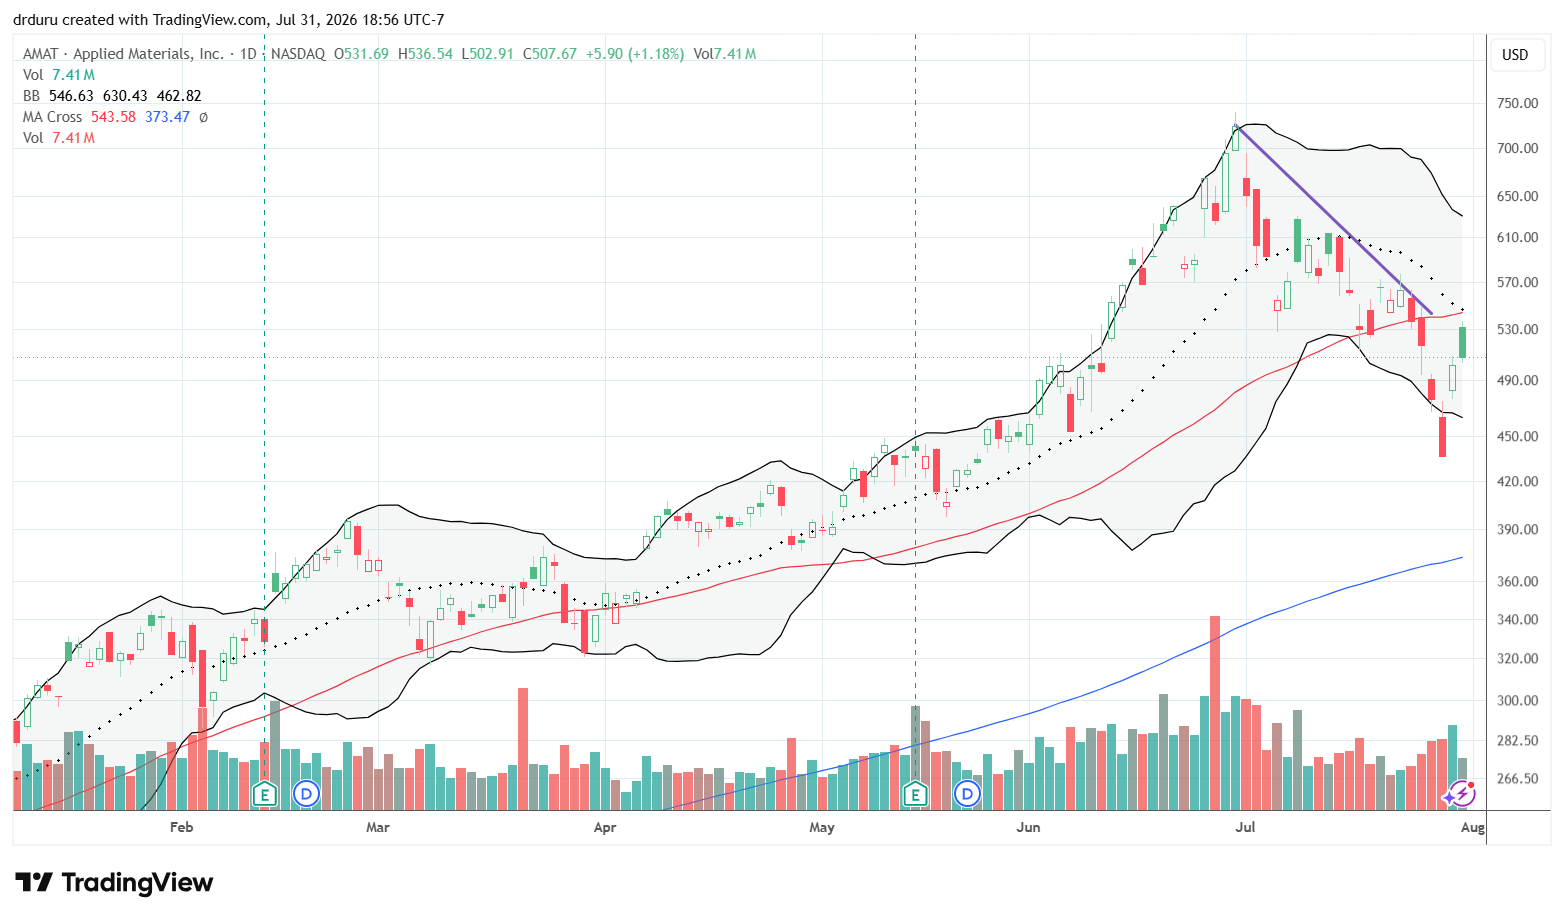
Technical status: Applied Materials, Inc (AMAT) accelerated downward with an 18.6% loss the first 3 days of the week. A subsequent rebound faded from converged 20DMA and 50DMA resistance.
Trade commentary: Applied Materials got caught in the broad unwinding of semiconductor-equipment and AI-infrastructure exposure. The stock had already fallen sharply from its June peak before joining Wednesday’s liquidation and Thursday’s equipment-sector rebound. If I had known on Wednesday that forced selling was a likely culprit in the AI crash, I would have bought AMAT given the stock is my favorite semi equipment trade. Now I just wait to see whether it can hold a 50DMA breakout.
Advanced Micro Devices, Inc. (AMD)
Description: AMD designs processors and accelerators used in personal computers, gaming systems, servers, and artificial-intelligence infrastructure.
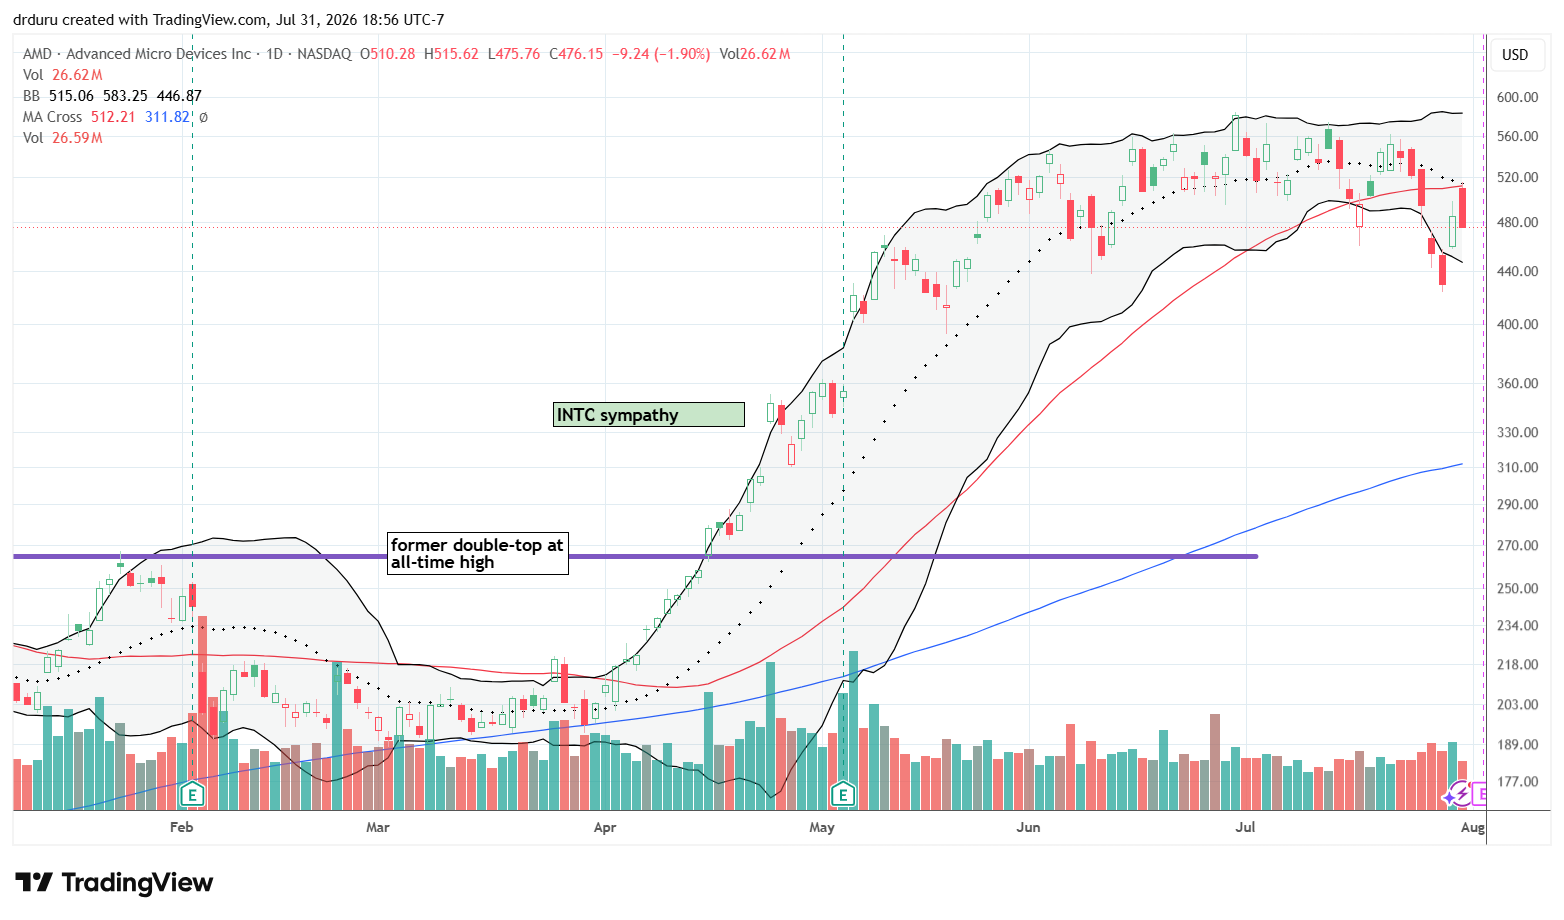
Technical status: Advanced Micro Devices, Inc. (AMD) broke down below its 50DMA, accelerating under its lower Bollinger Band. A subsequent rebound failed right at converged 20DMA and 50DMA resistance.
Trade commentary: With the AI crash in full swing, I checked in on AMD. The stock fared relatively well by avoiding a double-digit loss on Wednesday. The subsequent rebound snapped the stock back into place in its trading range. However, Friday’s fade from the gap open confirmed 50DMA resistance and generated a small loss on the day. Earnings this week will be front and center for my attention.
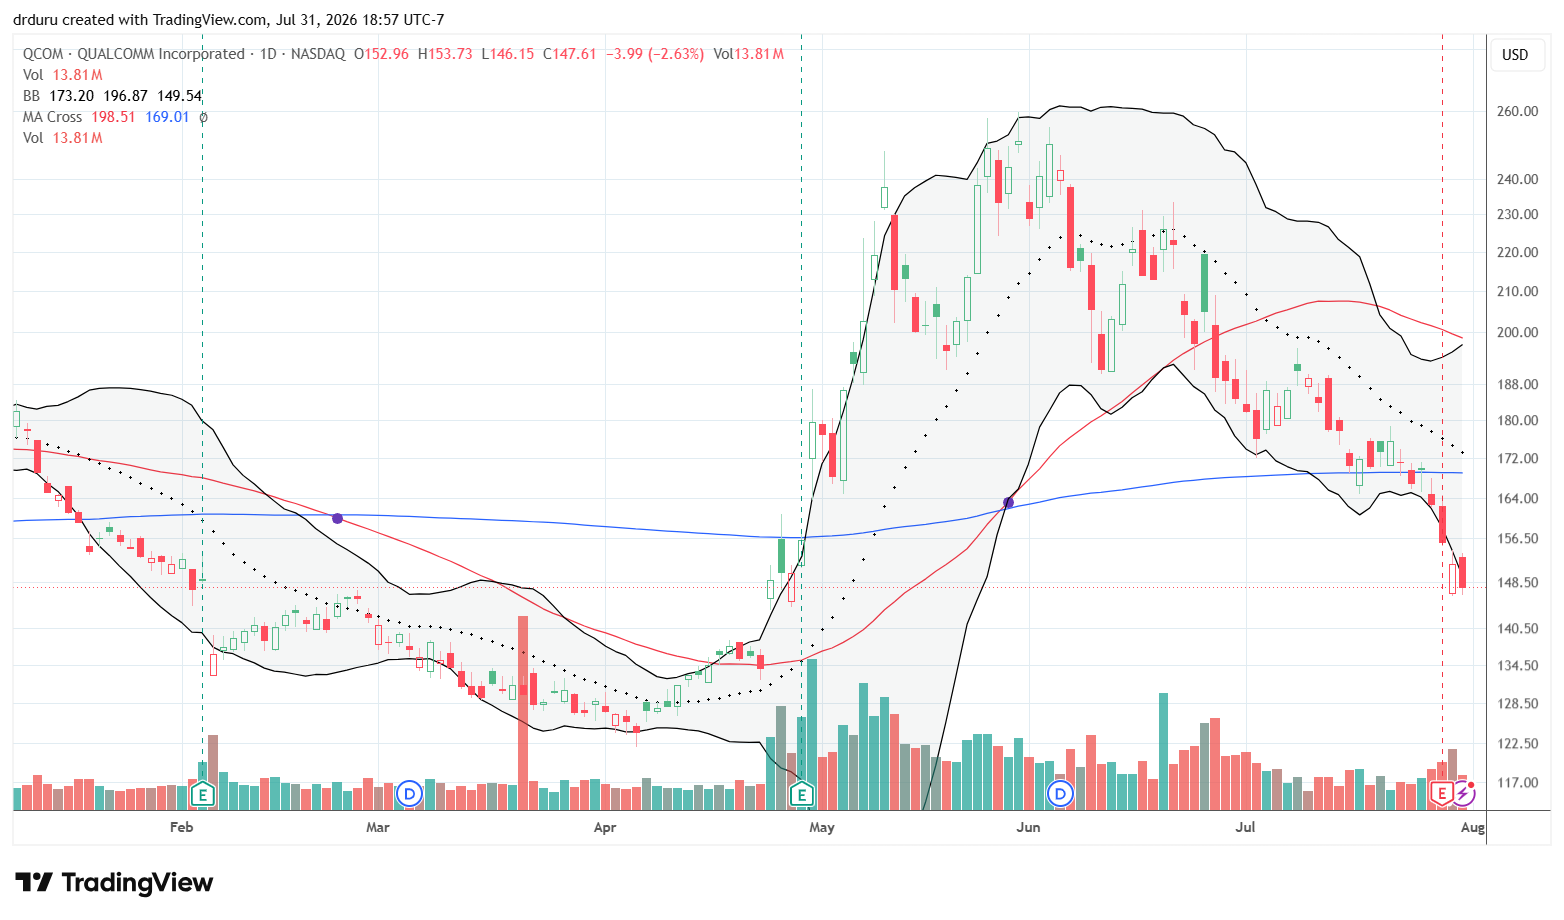
QUALCOMM Incorporated (QCOM)
Description: Qualcomm designs wireless processors, modems, connectivity products, and emerging data-center and artificial-intelligence chips.
Technical status: QUALCOMM Incorporated (QCOM) lost 4.4% post-earnings and further confirmed its 200DMA breakdown.
Trade commentary: According to Reuters, Qualcomm reported better-than-expected revenue but guided fourth-quarter earnings below consensus and warned that Apple-related revenue will decline faster than expected. QCOM has signed some AI-related deals, but I do not consider it a prime AI trade. Still, the stock’s complete reversal of its April run-up and breakout represents an ominous warning that the crash in semiconductors may not yet be over. QCOM is deep in bearish territory below its 50DMA and 200DMA.
Teradyne, Inc. (TER)
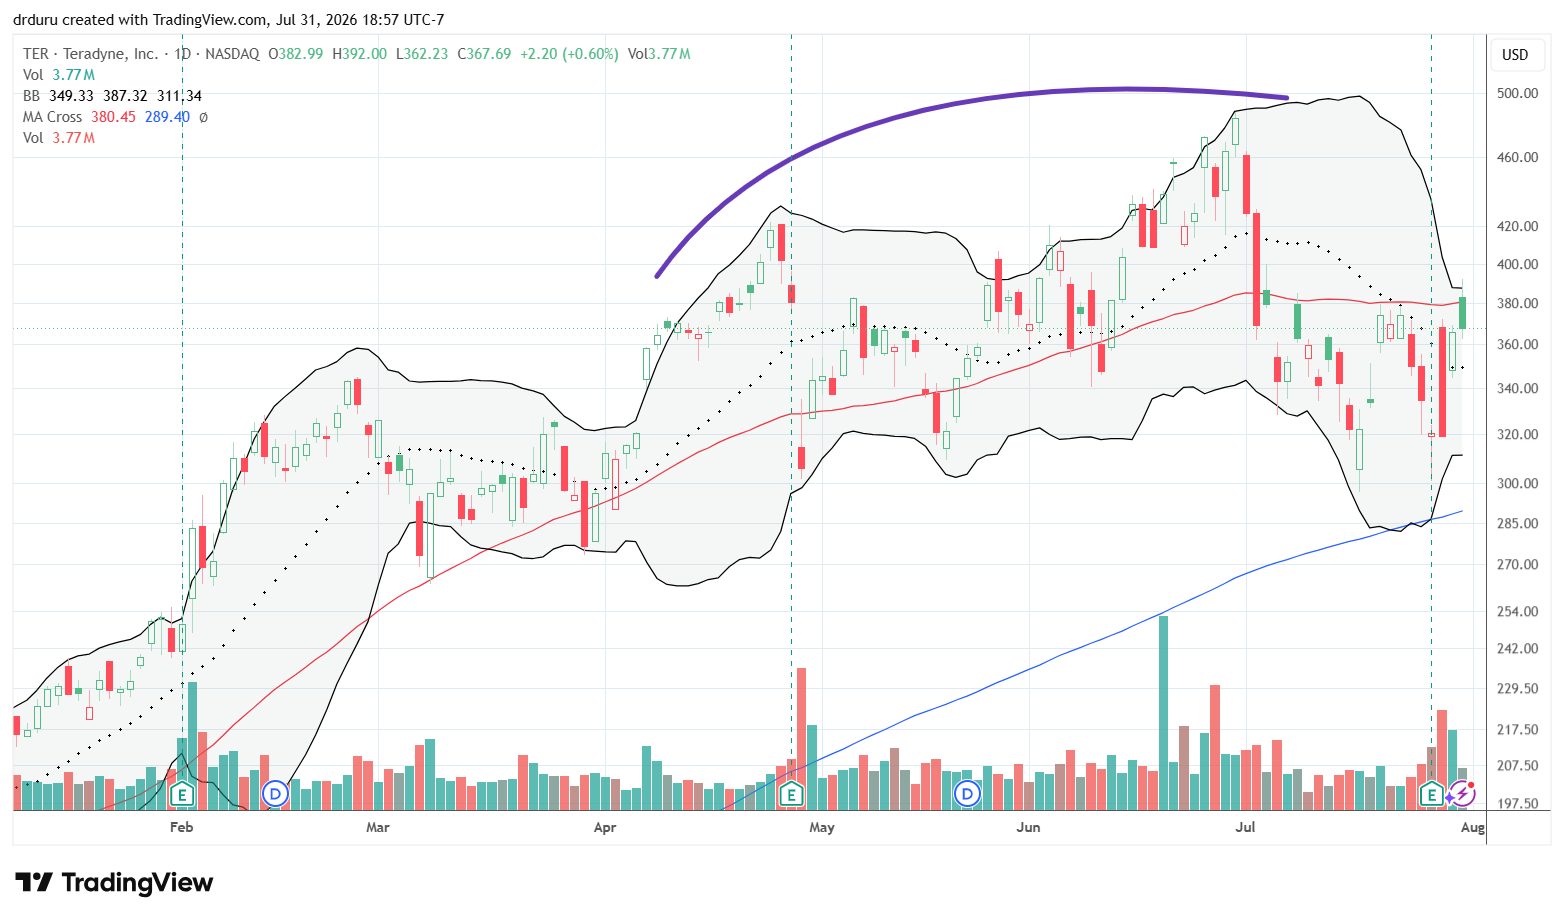
Description: Teradyne produces automated testing equipment for semiconductors, electronic systems, wireless products, and industrial robotics.
Technical status: Teradyne, Inc (TER) rallied post-earnings only to fade sharply away from 50DMA resistance.
Trade commentary: According to the Wall Street Journal, Teradyne results and guidance exceeded expectations, producing an initial double-digit after-hours gain. The stock’s post-earnings gap higher was met immediately by sellers. Given the surrounding AI crash, TER did well to end flat on the day. In mid-July, I pointed out the potential topping pattern in TER. The stock’s overall positioning is unresolved given Tuesday’s picture-perfect bounce off 200DMA support was countered by a fade from 50DMA resistance. I am a buyer on a close above 50DMA resistance.
KLA Corporation (KLAC)
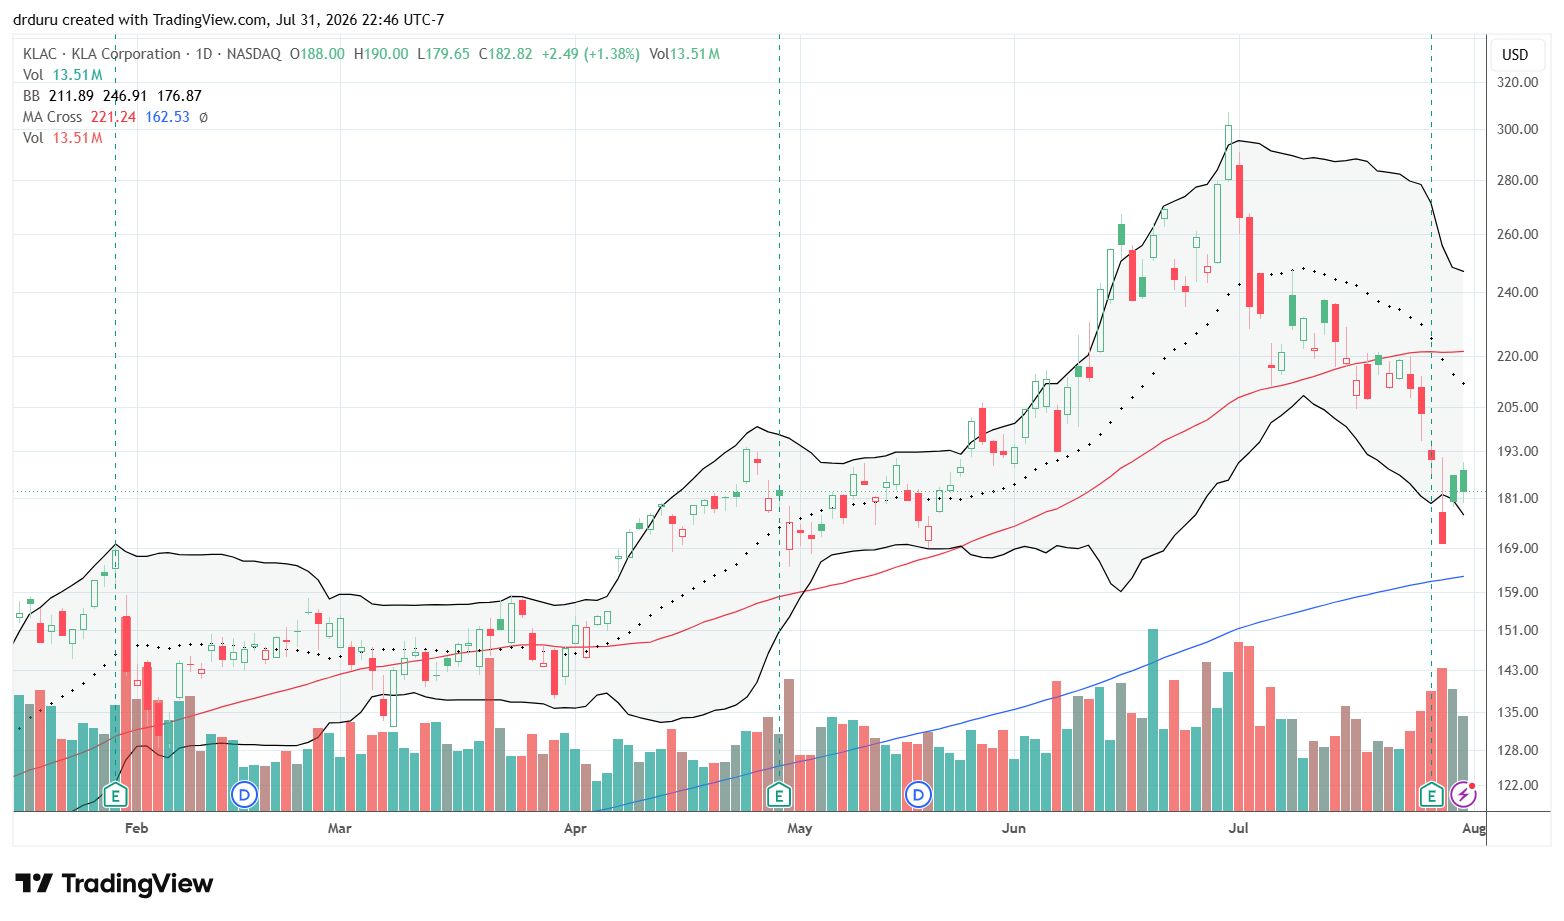
Description: KLA supplies process-control, inspection, and measurement equipment used in semiconductor fabrication.
Technical status: KLA Corporation (KLAC) fell 10.8% post-earnings but stopped short of testing 200DMA support.
Trade commentary: KLA exceeded the midpoint of its quarterly guidance, but strong results were not enough to exempt KLAC from the AI crash. The post-earnings close returned KLAC to its April breakout point. Despite this major reversal, KLAC is still up 50% for the year.
Amkor Technology, Inc. (AMKR)
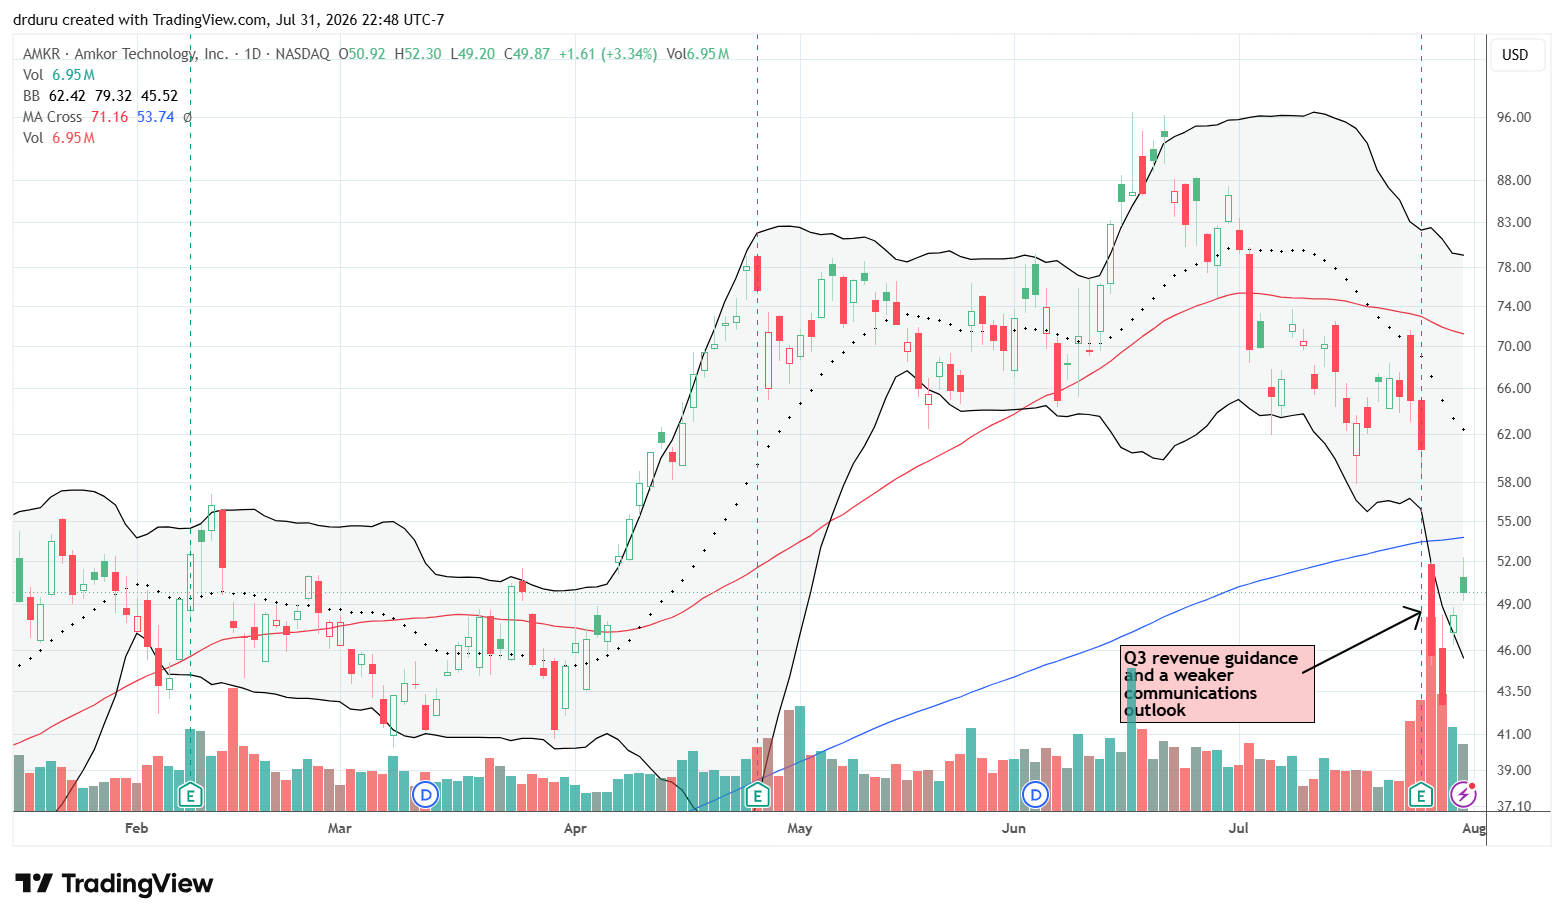
Description: Amkor provides outsourced semiconductor packaging, assembly, and testing services.
Technical status: Amkor Technology, Inc. (AMKR) crashed 24.7% post-earnings and confirmed a 200DMA breakdown the next day.
Trade commentary: According to Investors.com, Amkor reported record second-quarter revenue and a substantial earnings beat as AI, high-performance computing, and advanced packaging demand remained strong. However, its Q3 sales outlook fell short of expectations. I last made the case for AMKR almost a year ago. I have since taken profits and missed a substantial chunk of the rally that preceded AMKR’s contribution to the AI crash. AMKR’s complete reversal of its April breakout, combined with the 200DMA breakdown, makes the stock a no-touch for me.
Coherent Corp. (COHR)
Description: Coherent manufactures lasers, optical components, transceivers, and materials used in communications, industrial systems, and AI data centers.
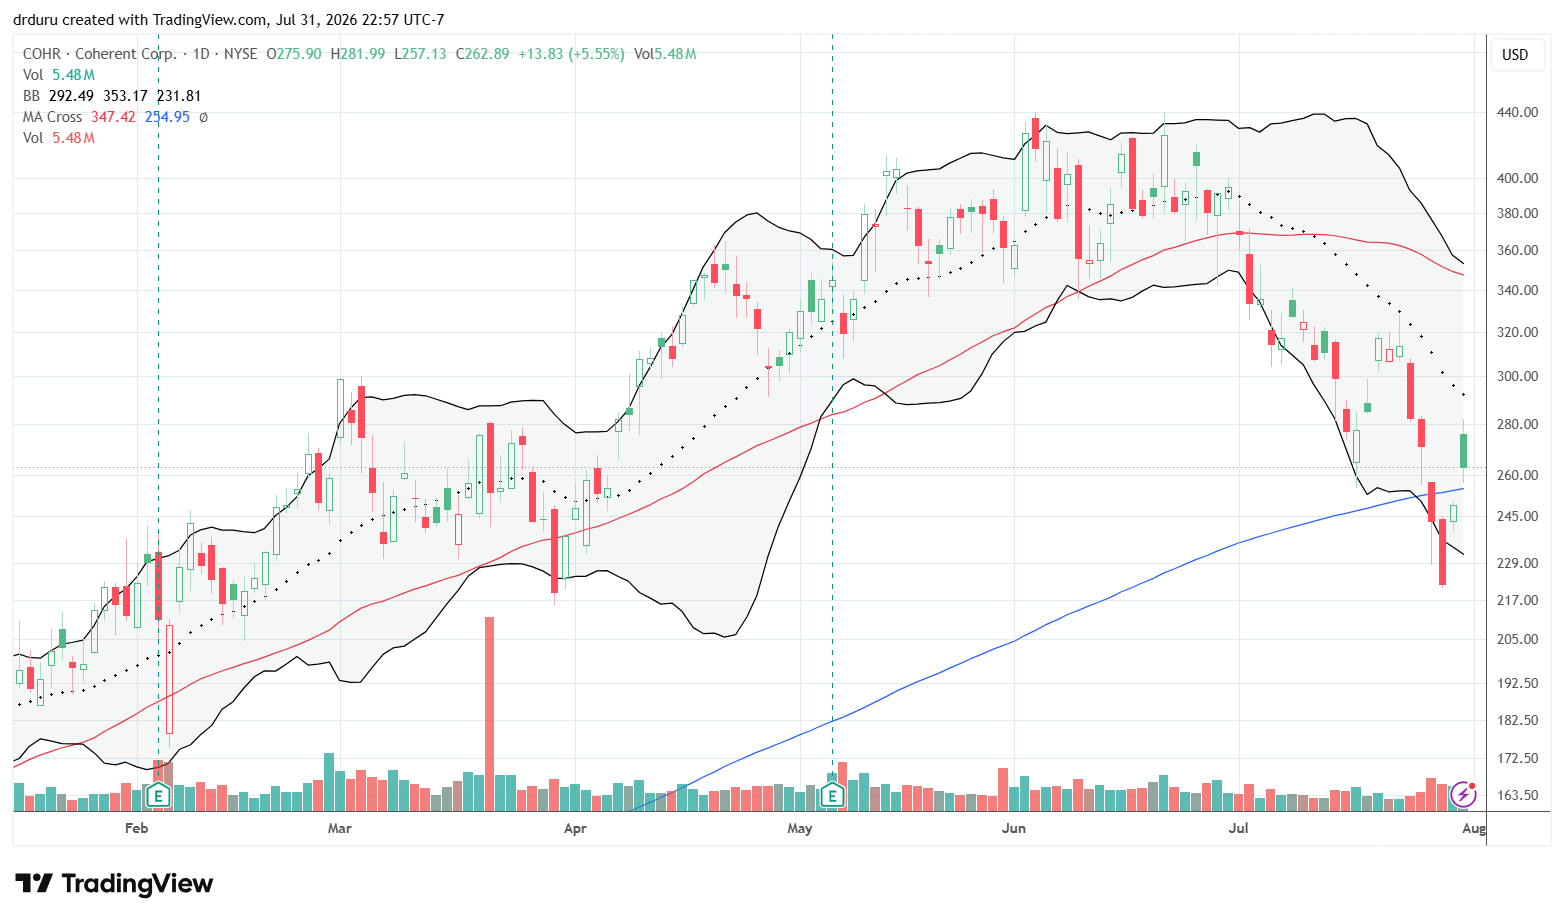
Technical status: Coherent Corp. (COHR) confirmed a 200DMA breakdown and made a five-month low before rebounding above its 200DMA. A downtrend from its 20DMA remained intact.
Trade commentary: COHR fell 10.3% in sympathy with GLW’s post-earnings crash. The 200DMA breakdown preceded an 8.8% loss on Wednesday’s AI crash. While Friday’s recovery above the 200DMA looks encouraging, COHR is a no-touch until the company reveals earnings soon.
Applied Optoelectronics, Inc. (AAOI)
Description: Applied Optoelectronics manufactures optical networking products used by cloud data centers, telecommunications providers, and cable networks.
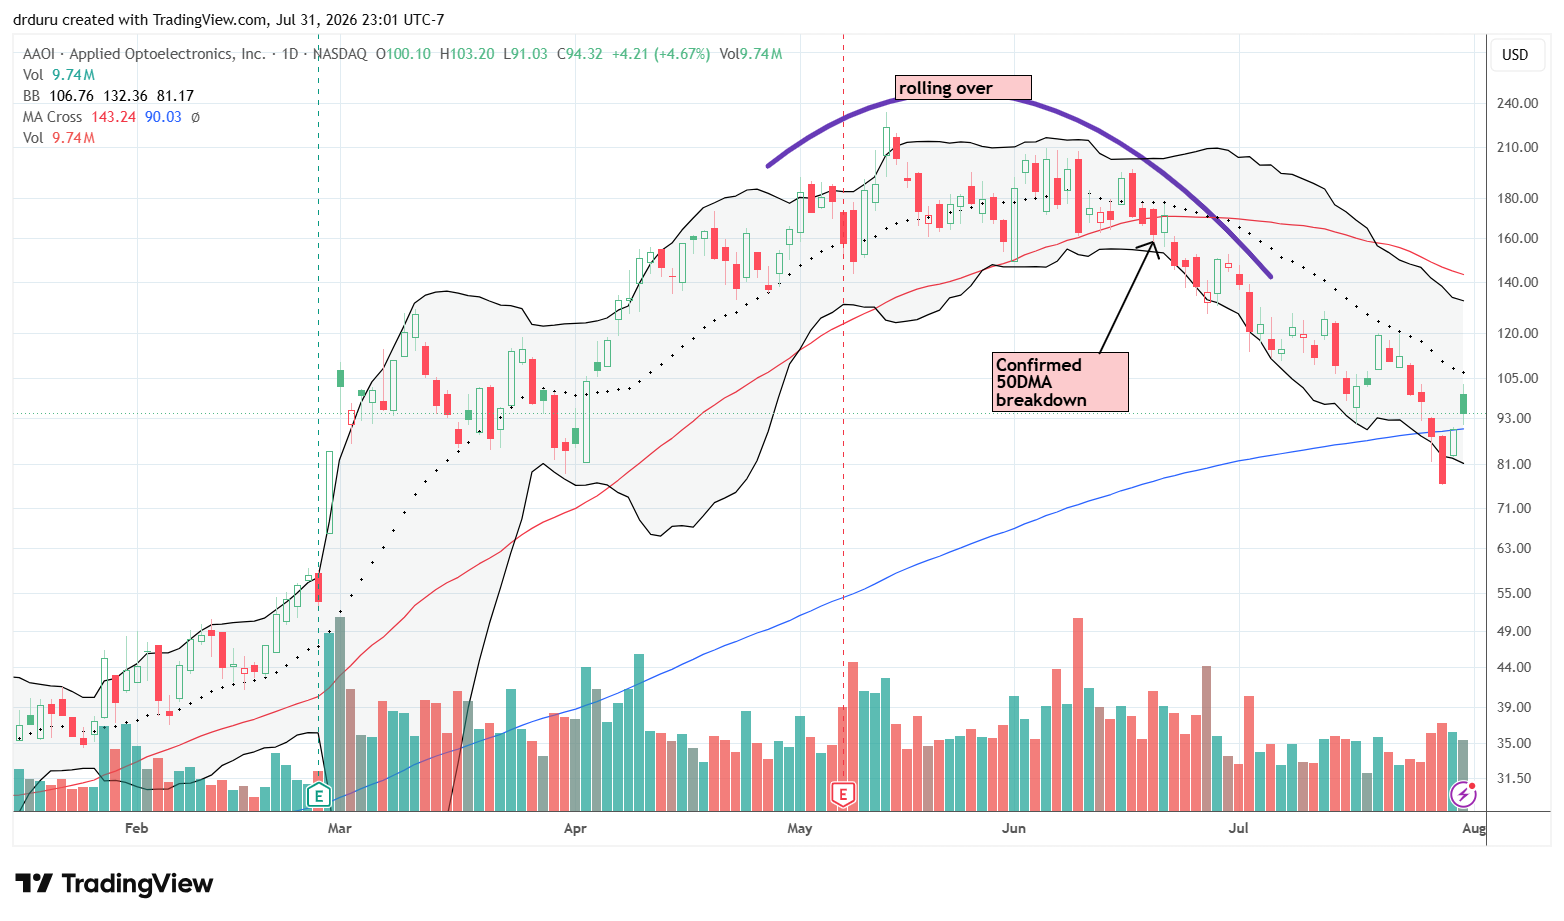
Technical status: Applied Optoelectronics, Inc. (AAOI) broke 200DMA support with a 4-month low.
Trade commentary: AAOI entered the week as one of the market’s most volatile AI-optics names and continued falling from its July highs. AAOI lost 13.2% on Wednesday’s AI crash. The subsequent rebound left AAOI’s steep downtrend intact with 20DMA resistance looming directly overhead. Like COHR, this stock is a no-touch for me until the next earnings reveal.
Alphabet Inc. (GOOG)
Description: Alphabet operates Google Search, YouTube, digital advertising platforms, cloud infrastructure, Android, and major artificial-intelligence businesses.
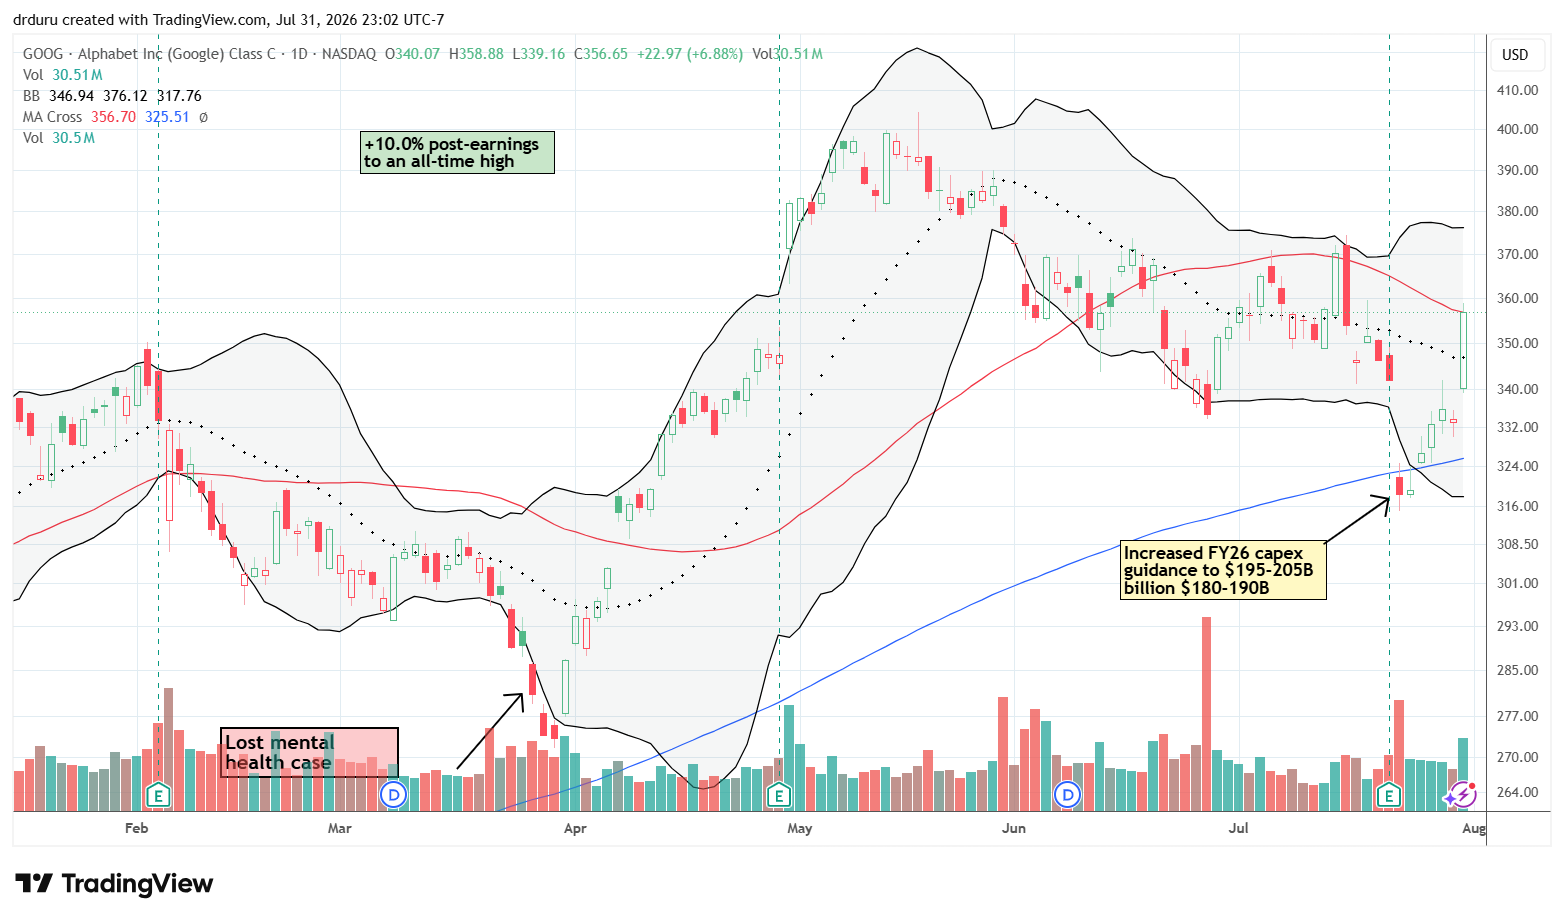
Technical status: Alphabet Inc (GOOG) rallied all week, recovering from a post-earnings gap down and testing 50DMA resistance.
Trade commentary: I was surprised by GOOG’s robust recovery, but I will definitely take it. Friday’s 6.9% took the stock to the edge of resuming its upward momentum.
Fair Isaac Corporation (FICO)
Description: FICO develops credit-scoring systems, analytics software, and decision-management products used by lenders and other enterprises.
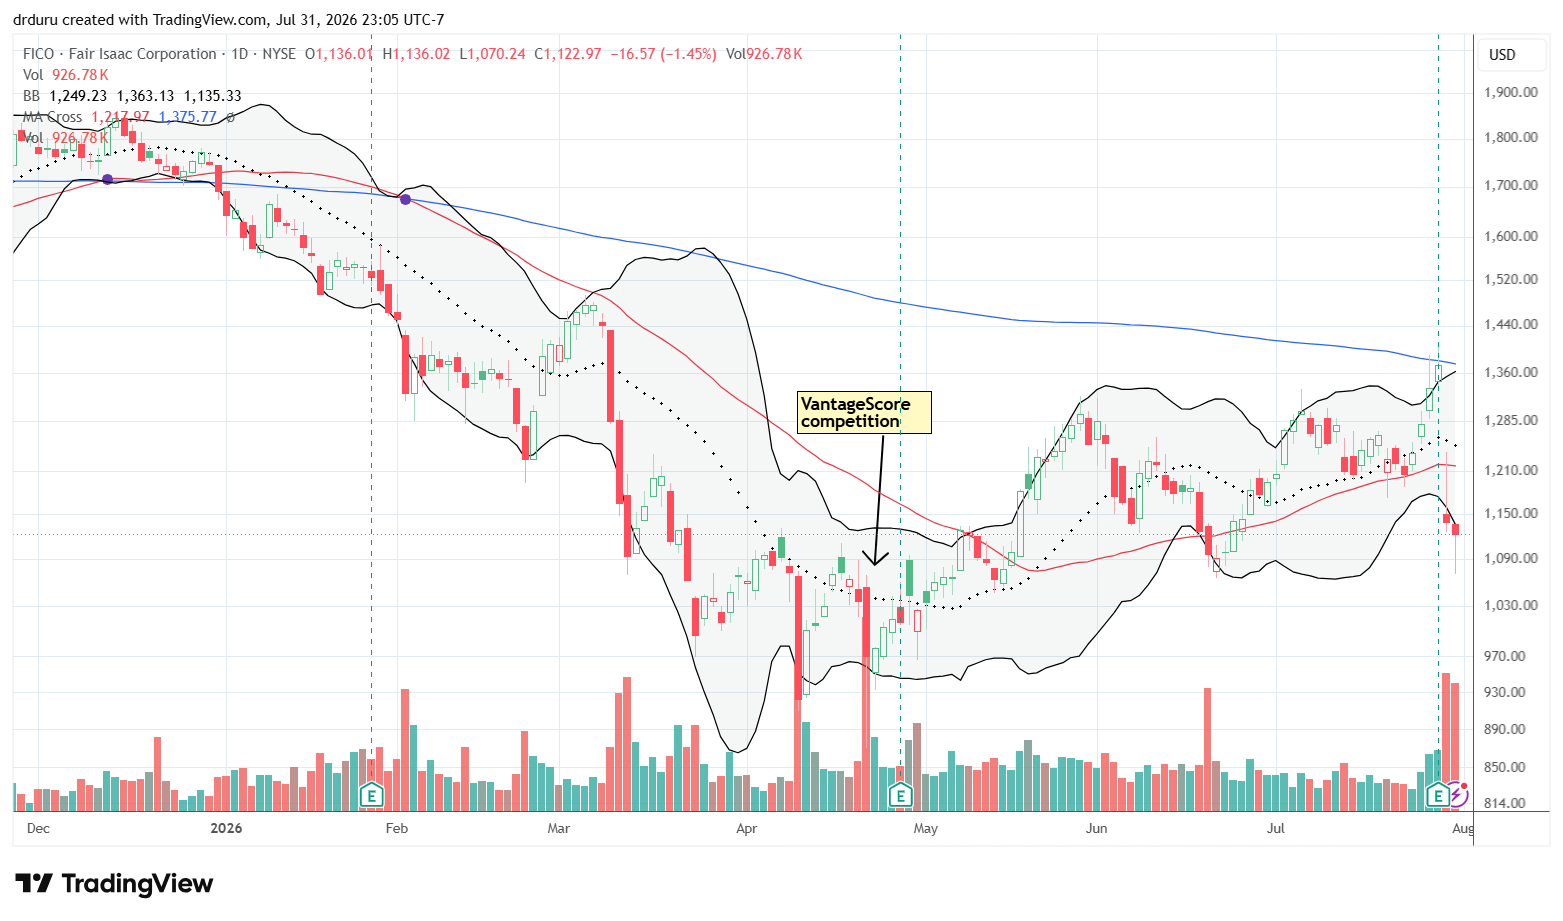
Technical status: Fair Isaac Corporation (FICO) confirmed 200DMA resistance with a 17.0% post-earnings decline and 50DMA breakdown.
Trade commentary: According to Barron’s, FICO beat earnings expectations and raised its full-year forecasts, but the revised outlook still fell short of Wall Street’s expectations. The pre-earnings jump to 200DMA resistance produced a big fakeout for buyers. The confirmation of 200DMA resistance and the 50DMA breakdown removed the stock once again from my radar.
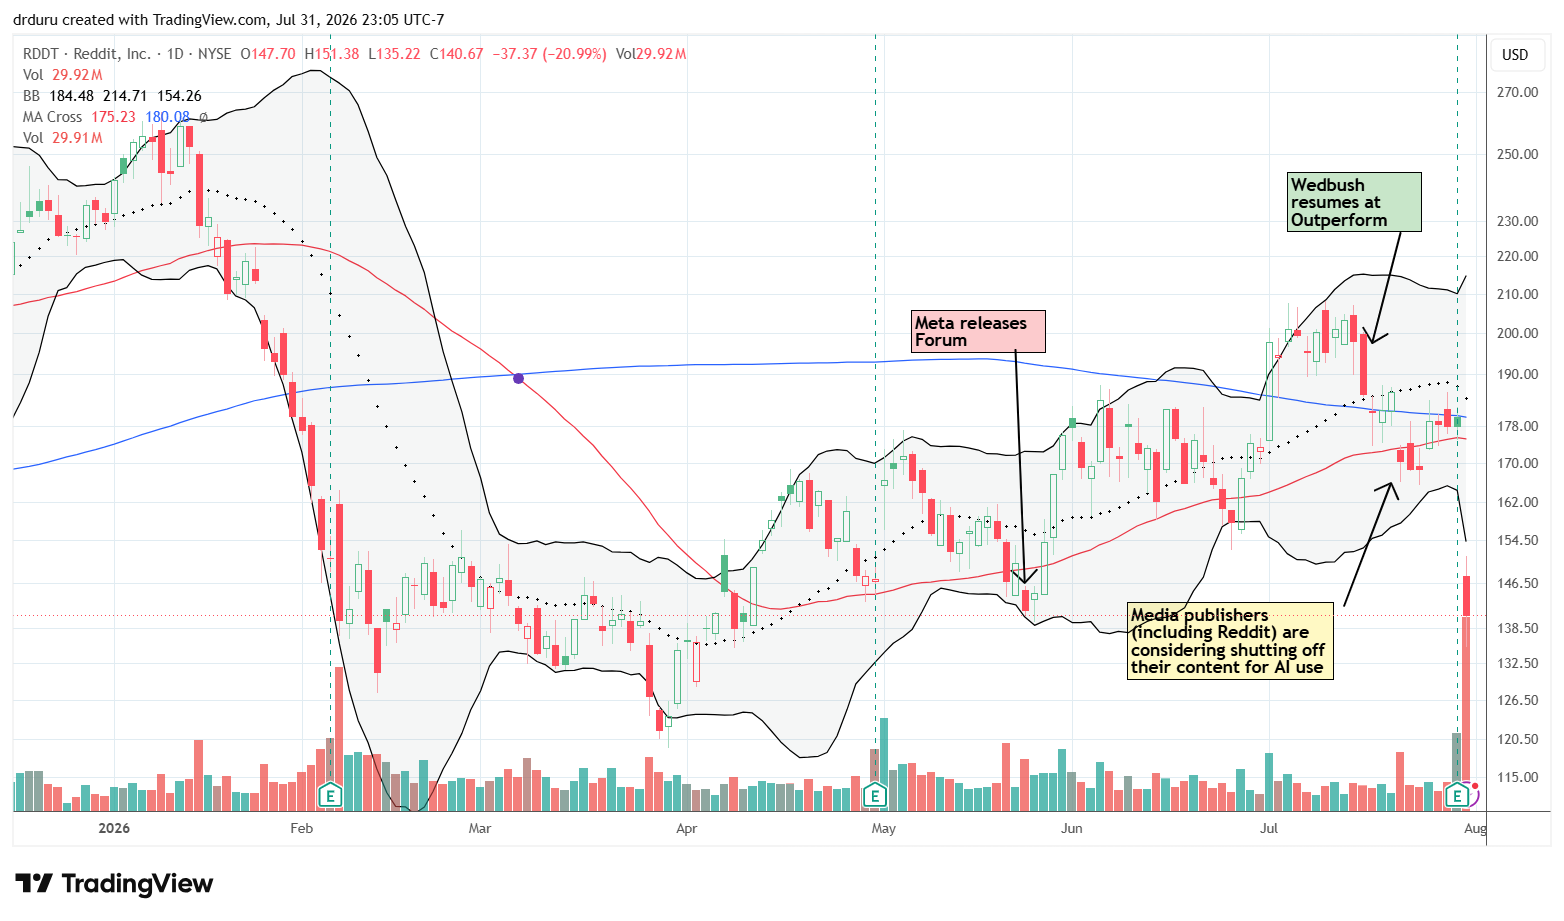
Reddit, Inc. (RDDT)
Description: Reddit operates an online platform organized around user-created communities and interest-based discussions.
Technical status: Reddit, Inc. (RDDT) crashed 21.0% post-earnings and tried to hold support at the May low.
Trade commentary: Speaking of fake-outs, RDDT was a major disappointment for me. Reddit increased revenue 61% and issued an above-consensus forecast, but traders and investors decided to panic about user growth dynamics. On CNBC, the CEO tried to explain how a drop in Google search referrals reflected increased adoption of its app. Higher monetization of these higher-quality users is a big positive. These explanations fell on deaf ears. I consider the post-earnings crash well overdone and the bullish case little changed, so doubled down on my position. {edited August 4, 2026 after I realized that a limit order had executed at $150}
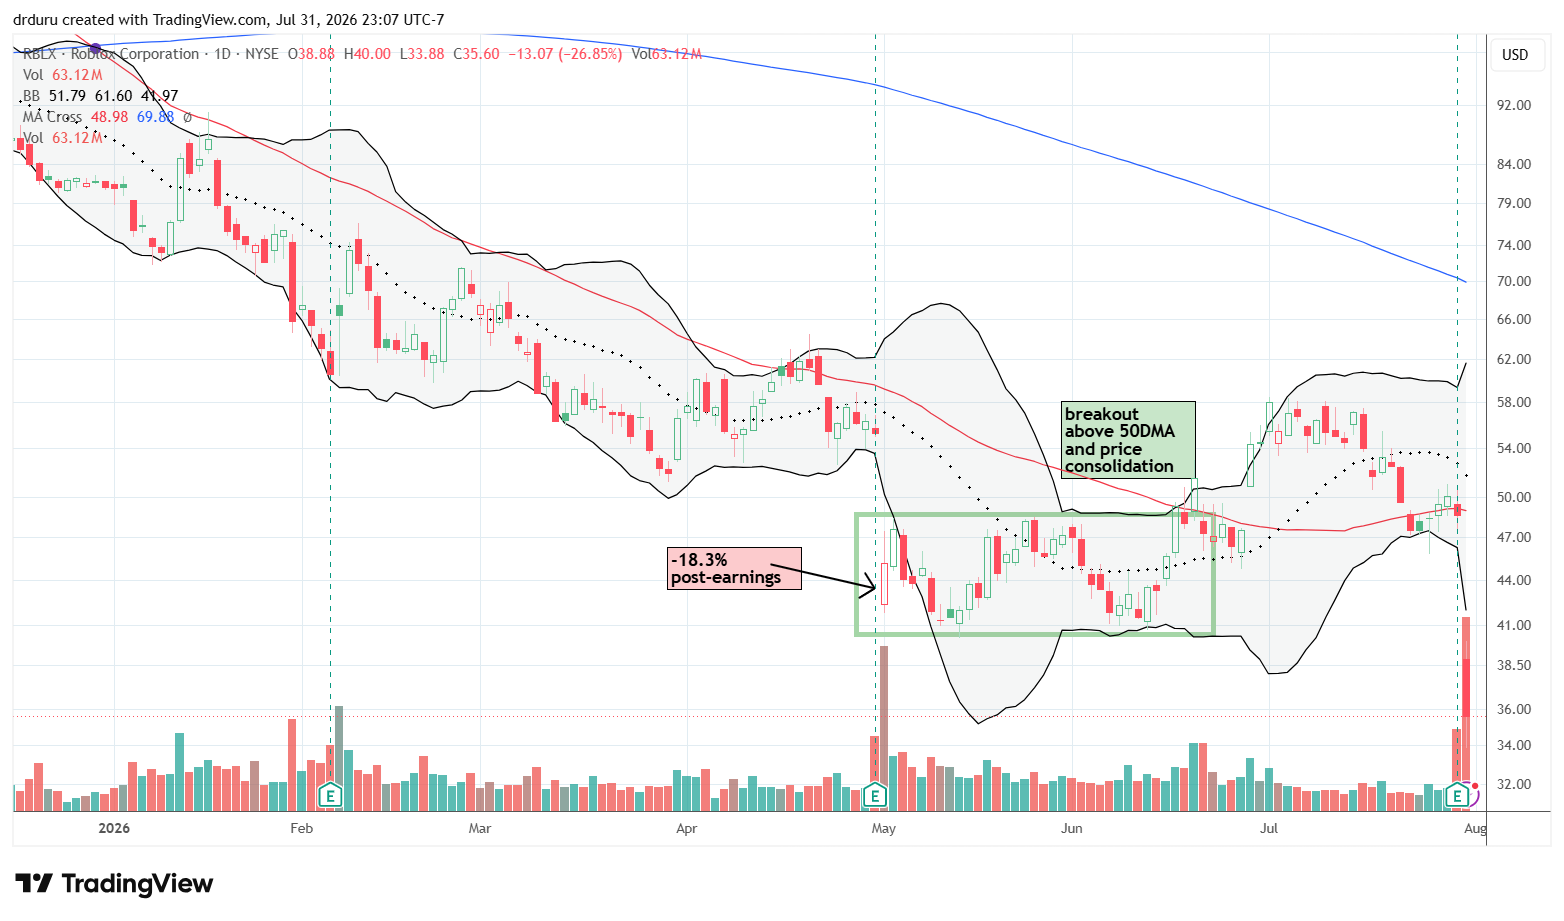
Roblox Corporation (RBLX)
Description: Roblox operates an interactive gaming and creation platform where users build, distribute, and play virtual experiences.
Technical status: Roblox Corporation (RBLX) crashed 26.9% post-earnings to a 2+ year low.
Trade commentary: According to Reuters, Roblox forecast third-quarter bookings well below expectations after recommendation changes steered users toward lower-monetizing games and stricter safety measures complicated sign-ups and engagement. The post-earnings collapse was a major disappointment for me given what looked like a bullish trading setup. I accepted the downside risk but of course did not have a 2+ year low in the playbook. RBLX is now a truly broken stock with a massive double-top stretching between 2021 and 2025. At some point, I will make a permanent exit from this stock.
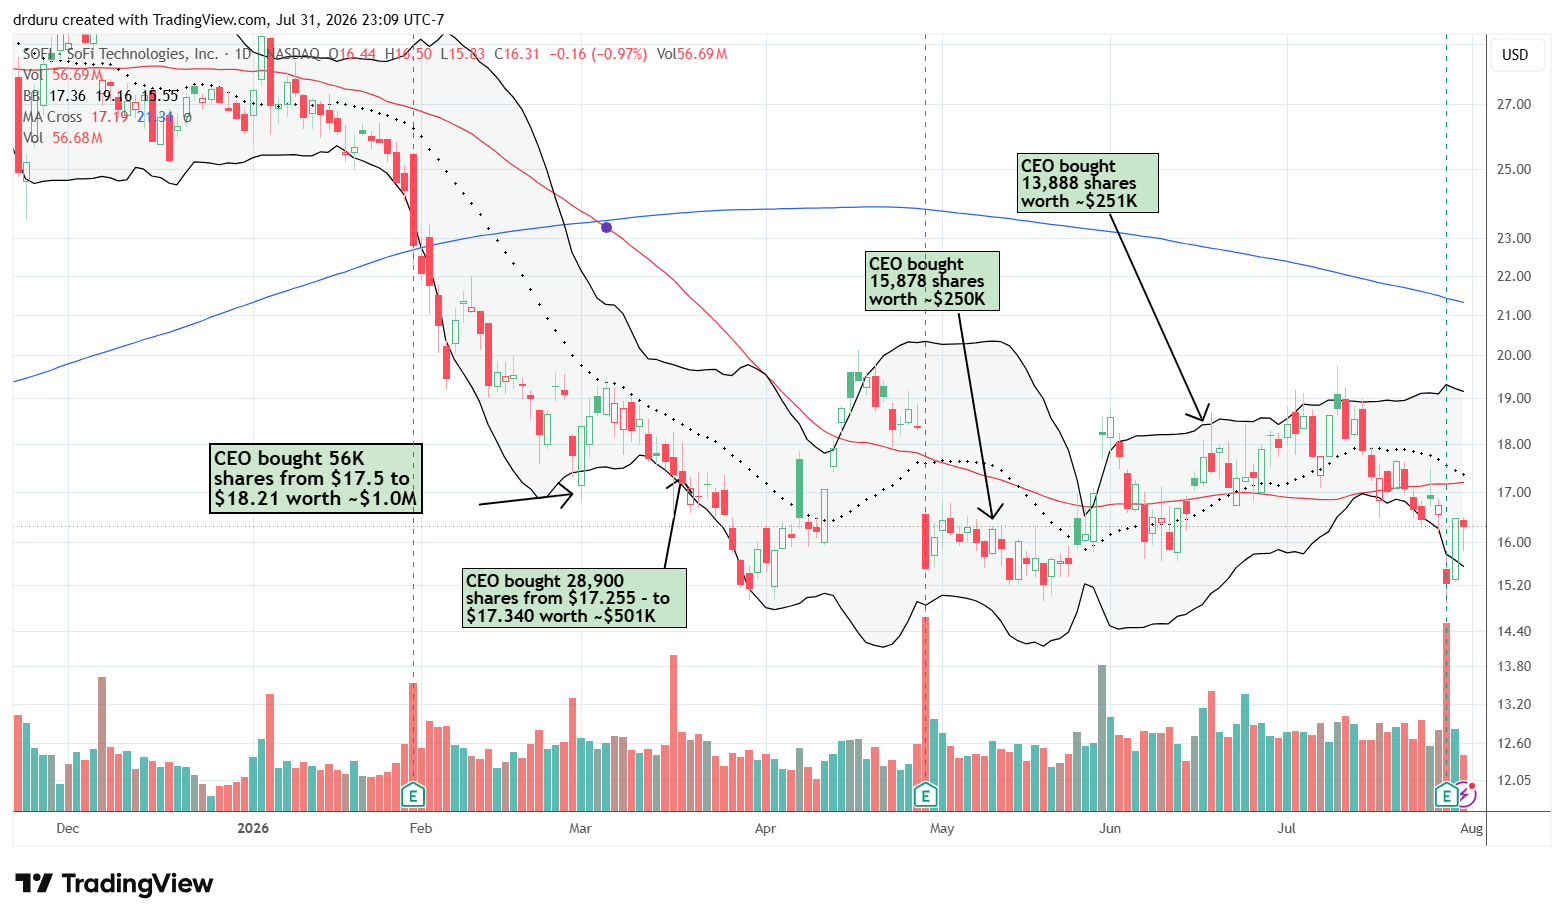
SoFi Technologies, Inc. (SOFI)
Description: SoFi is a digital financial-services company offering lending, banking, investing, and financial-technology infrastructure.
Technical status: SoFi Technologies, Inc. (SOFI) quickly recovered from an 8.9% post-earnings loss but remained in danger of setting new lows for the year.
Trade commentary: According to Reuters, SoFi delivered record originations, rapid membership growth, and a higher annual revenue forecast. Yet, management left its profit forecast unchanged. If I did not already own enough SOFI shares based on the numerous purchases by the CEO, I would have started here. I find it very telling that the stock reversed its entire post-earnings loss the very next day. Perhaps the post-earnings selling in SOFI was exaggerated by Wednesday’s trading turmoil.
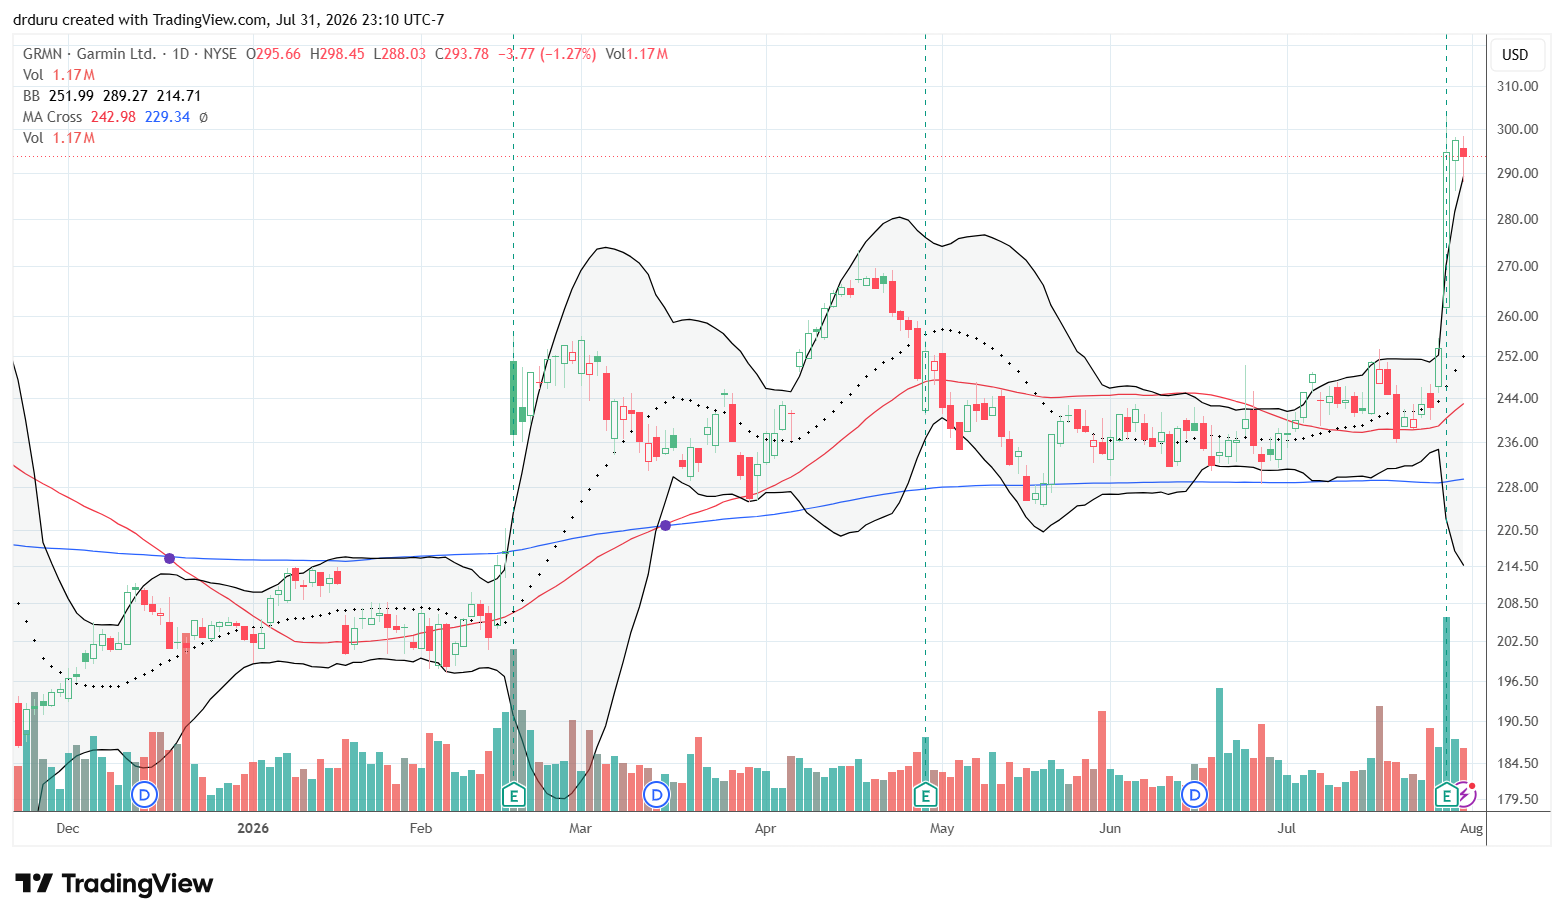
Garmin Ltd. (GRMN)
Description: Garmin manufactures navigation, fitness, aviation, marine, automotive, and outdoor electronic devices.
Technical status: Garmin Ltd. (GRMN) surged 16.2% post-earnings to an all-time high.
Trade commentary: Just two weeks ago, I was talking to a friend about how surprised I am that “old school” Garmin has been able to hang around. More surprises for me as the stock surged post-earnings in a major breakout. According to Investors.com, earnings and revenue exceeded expectations and management raised full-year guidance. I want to buy GRMN on the dips from here as long as it preserves this breakout.
GoDaddy Inc. (GDDY)
Description: GoDaddy provides domains, website-building tools, hosting, commerce services, and software for small businesses.
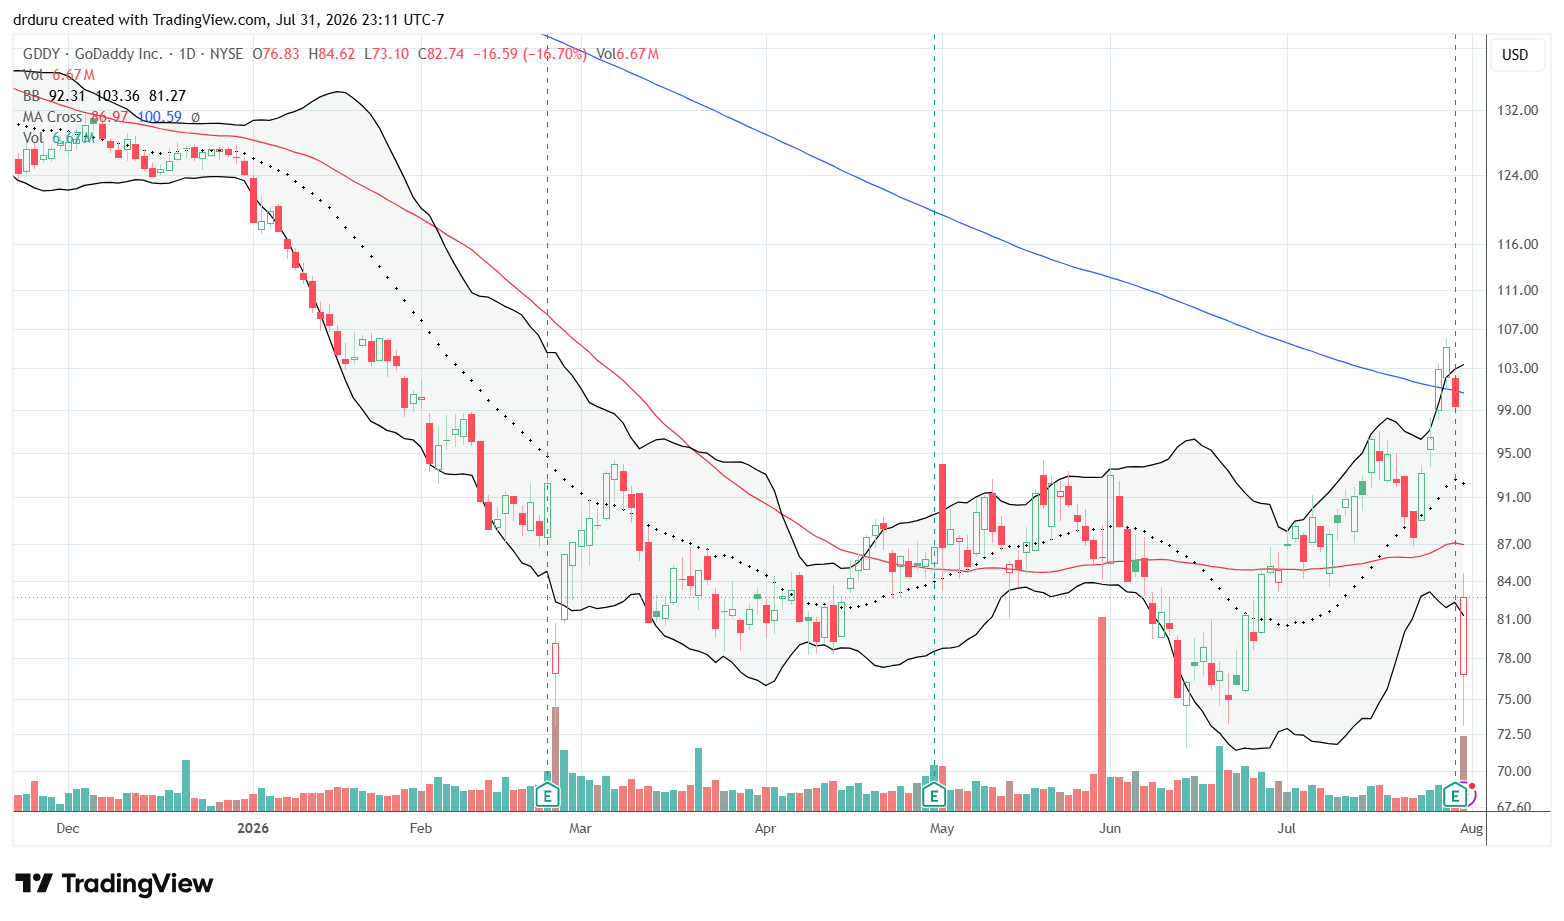
Technical status: GoDaddy Inc (GDDY) ended a brief 200DMA breakout with a 16.7% post-earnings crash.
Trade commentary: I last discussed GDDY five months ago. The stock did not make my cut then, and it failed again with a failed 200DMA breakout. While the rebound from intraday lows looks like the start of another recovery, I am content to wait for more signs of stabilization above the 50DMA.
GoDaddy reported higher profit and cash flow, continued aggressive share repurchases, and projected approximately $1.8 billion in annual free cash flow. Thus, the fundamentals look encouraging. I just need the technicals to confirm a good risk/reward entry.
Modine Manufacturing Company (MOD)
Description: Modine manufactures thermal-management and cooling systems for vehicles, industrial equipment, and data centers.
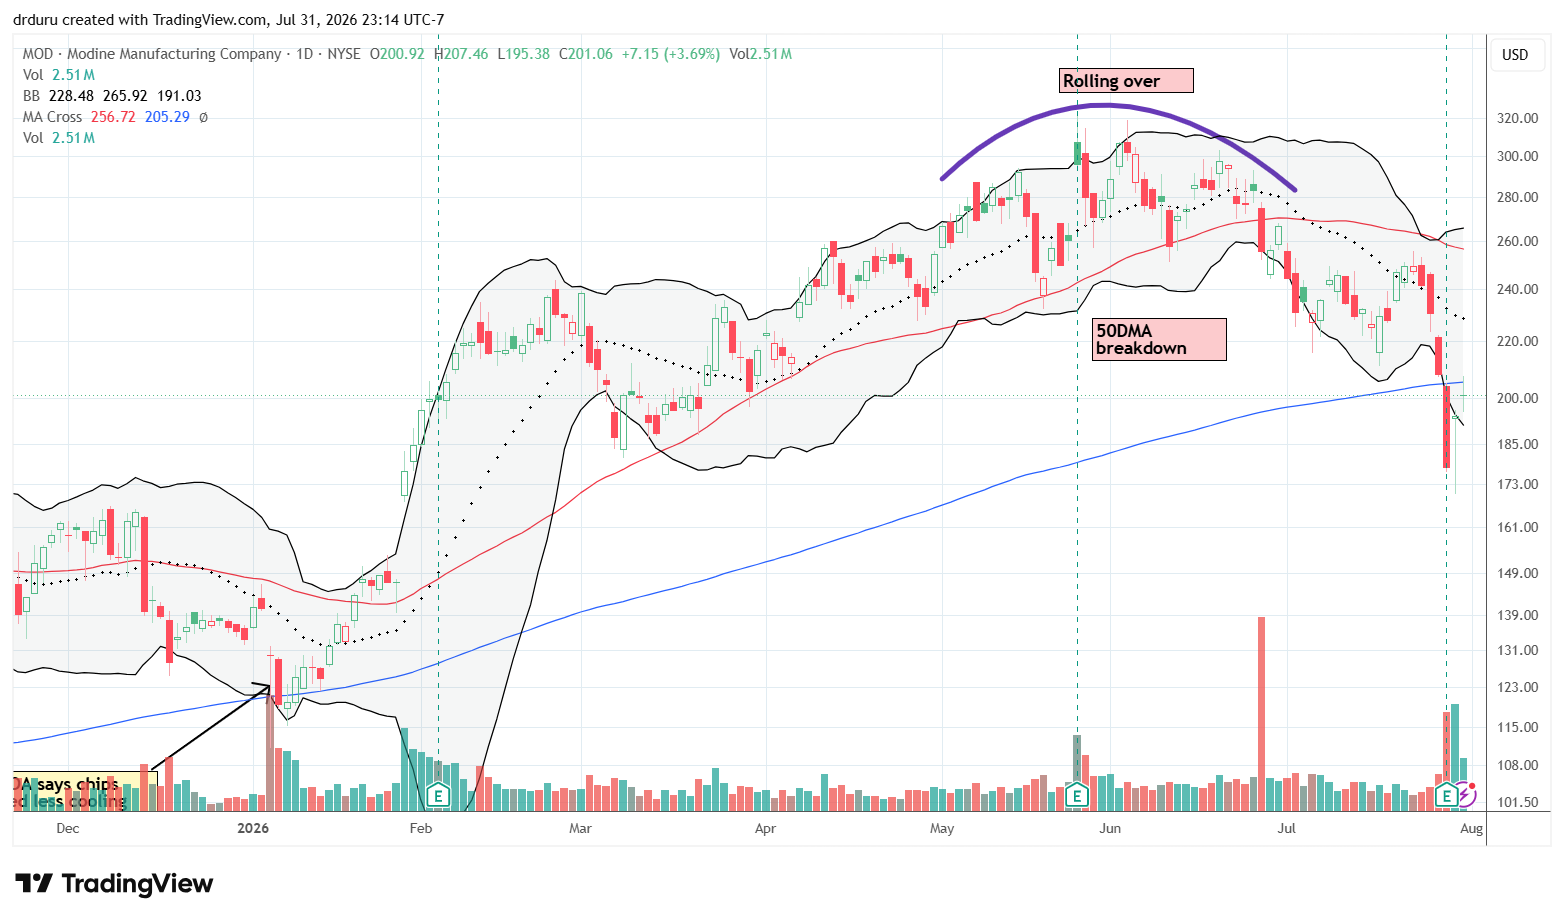
Technical status: Modine Manufacturing Company (MOD) almost recovered from a 14.4% post-earnings loss but stalled at 200DMA resistance.
Trade commentary: I discussed the bearish setup in MOD a month ago. The stock’s AI crash below its 200DMA confirmed my concerns. Modine reported 28% sales growth and a 44% increase in adjusted earnings per share, helped by continued demand for data-center cooling. The company beat earnings expectations, but adjusted EBITDA growth was much slower than revenue growth. The quick rebound to 200DMA resistance suggests MOD’s plunge was exaggerated by the AI crash. Still, I cannot buy this stock until/unless it recovers from its 50DMA breakdown. Depending on how Johnson Controls (JCI) performs after upcoming earnings, I may reengage with a pairs trade long JCI and short MOD.
Robinhood Markets, Inc. (HOOD)
Description: Robinhood operates a retail brokerage and financial platform offering stocks, options, cryptocurrencies, retirement accounts, and prediction markets.
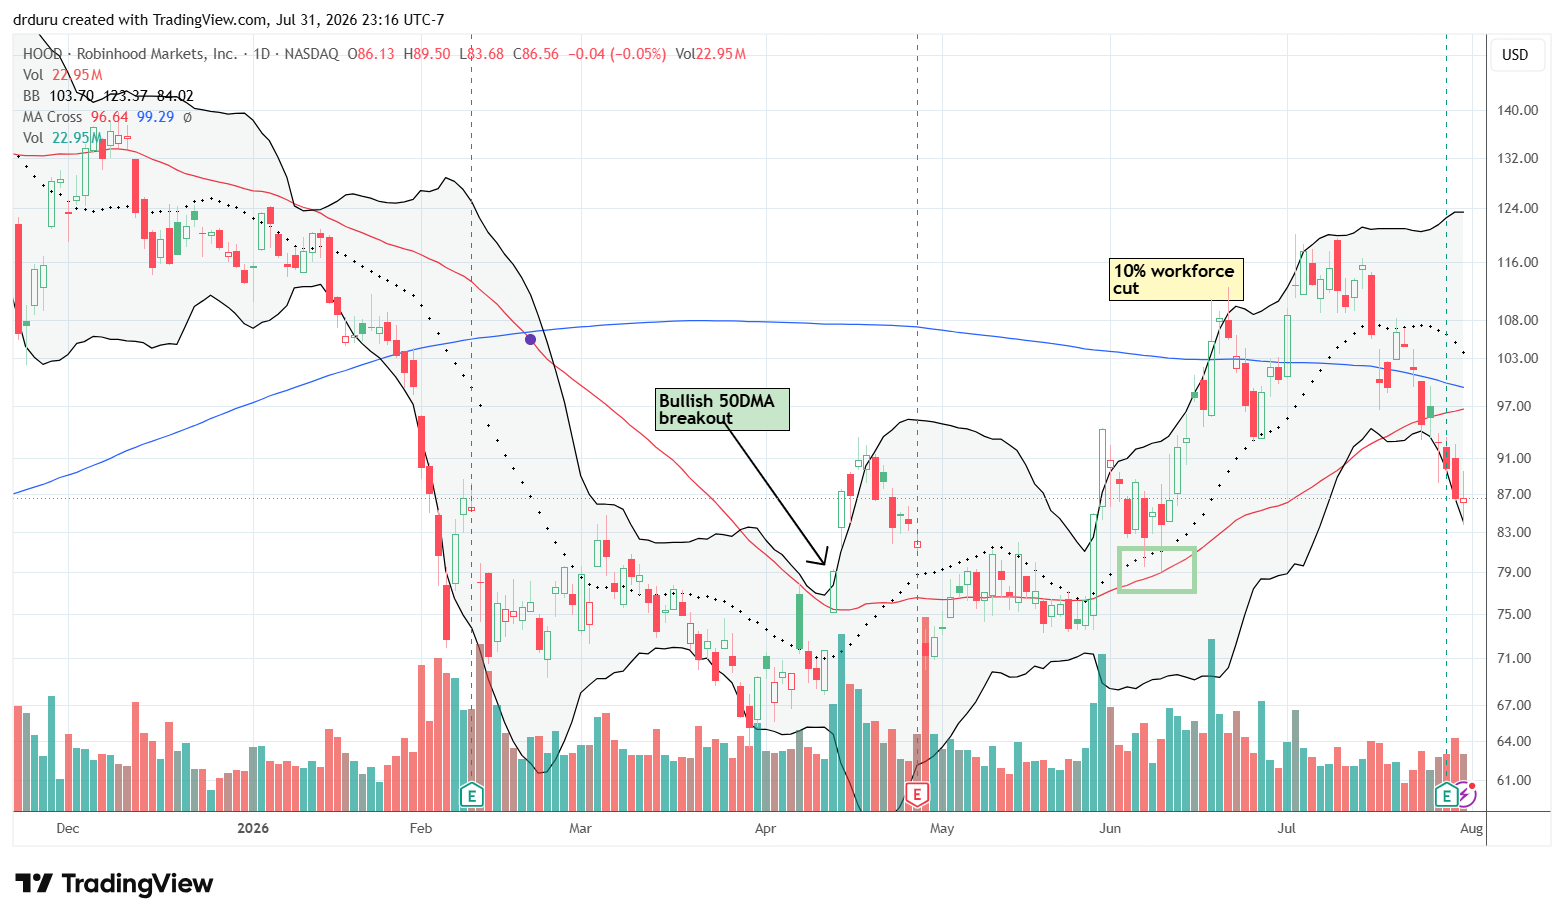
Technical status: Robinhood Markets, Inc. (HOOD) lost 3.6% post-earnings and further confirmed a 50DMA breakdown.
Trade commentary: HOOD had a surprisingly mild post-earnings reaction give the bearish technical setup below its 50DMA and the selling surrounding the Fed and the AI crash. According to Reuters, Robinhood beat quarterly profit expectations as equity, options, and prediction-market trading offset a 38% decline in cryptocurrency revenue. I see no reason to buy back into HOOD until it recovers support from all its major moving averages (now converging as overhead resistance) or as a bottoming play testing its low for the year.
C.H. Robinson Worldwide, Inc. (CHRW)
Description: C.H. Robinson is a freight broker and logistics provider connecting shippers with transportation capacity.
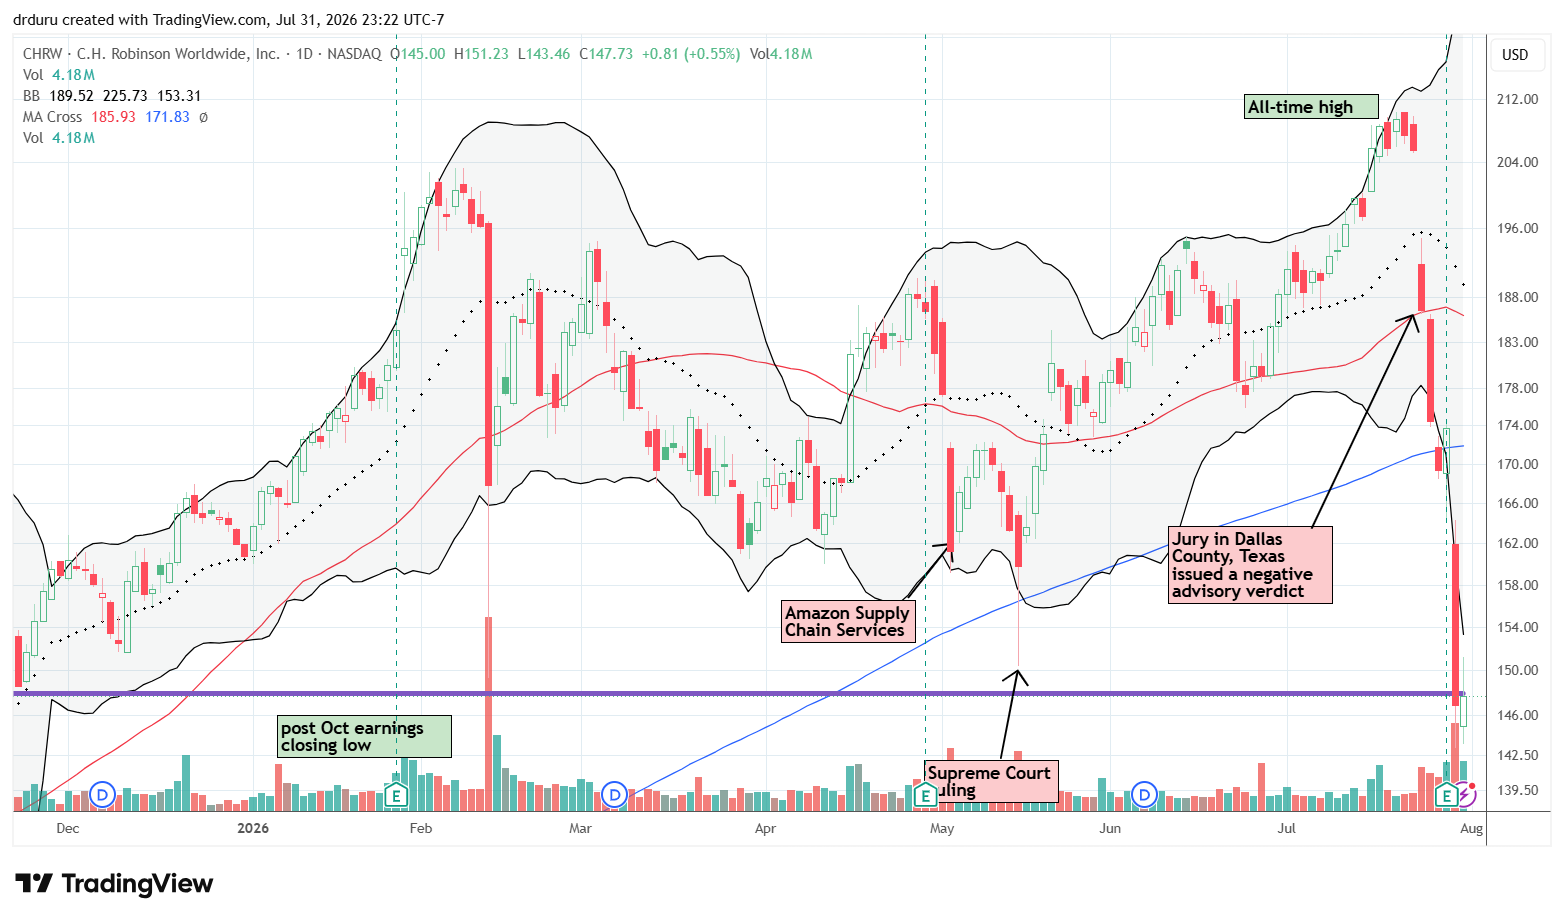
Technical status: C.H. Robinson Worldwide, Inc. (CHRW) cratered 15.4% post-earnings, lost 200DMA support, and retested its post-earnings low from last October.
Trade commentary: Just a few weeks ago, I held out CHRW as prime example of the dangers of selling into a panic. The stock’s all-time demonstrated the trading opportunity of selectively buying into panics. Fast-forward to last week and yet another panic descended upon CHRW. According to Seeking Alpha, The company held guidance but some underlying operating metrics declined and projections for overall industry growth took a tick down. Moreover, the company still appears beset with legal issues. The stock looks over-extended to the downside, so I am targeting a buy on a close above Friday’s intraday high. I will maintain a tight stop below the post-earnings low.
Cracker Barrel Old Country Store, Inc. (CBRL)
Description: Cracker Barrel operates full-service restaurants and attached retail stores centered on traditional American food and merchandise.
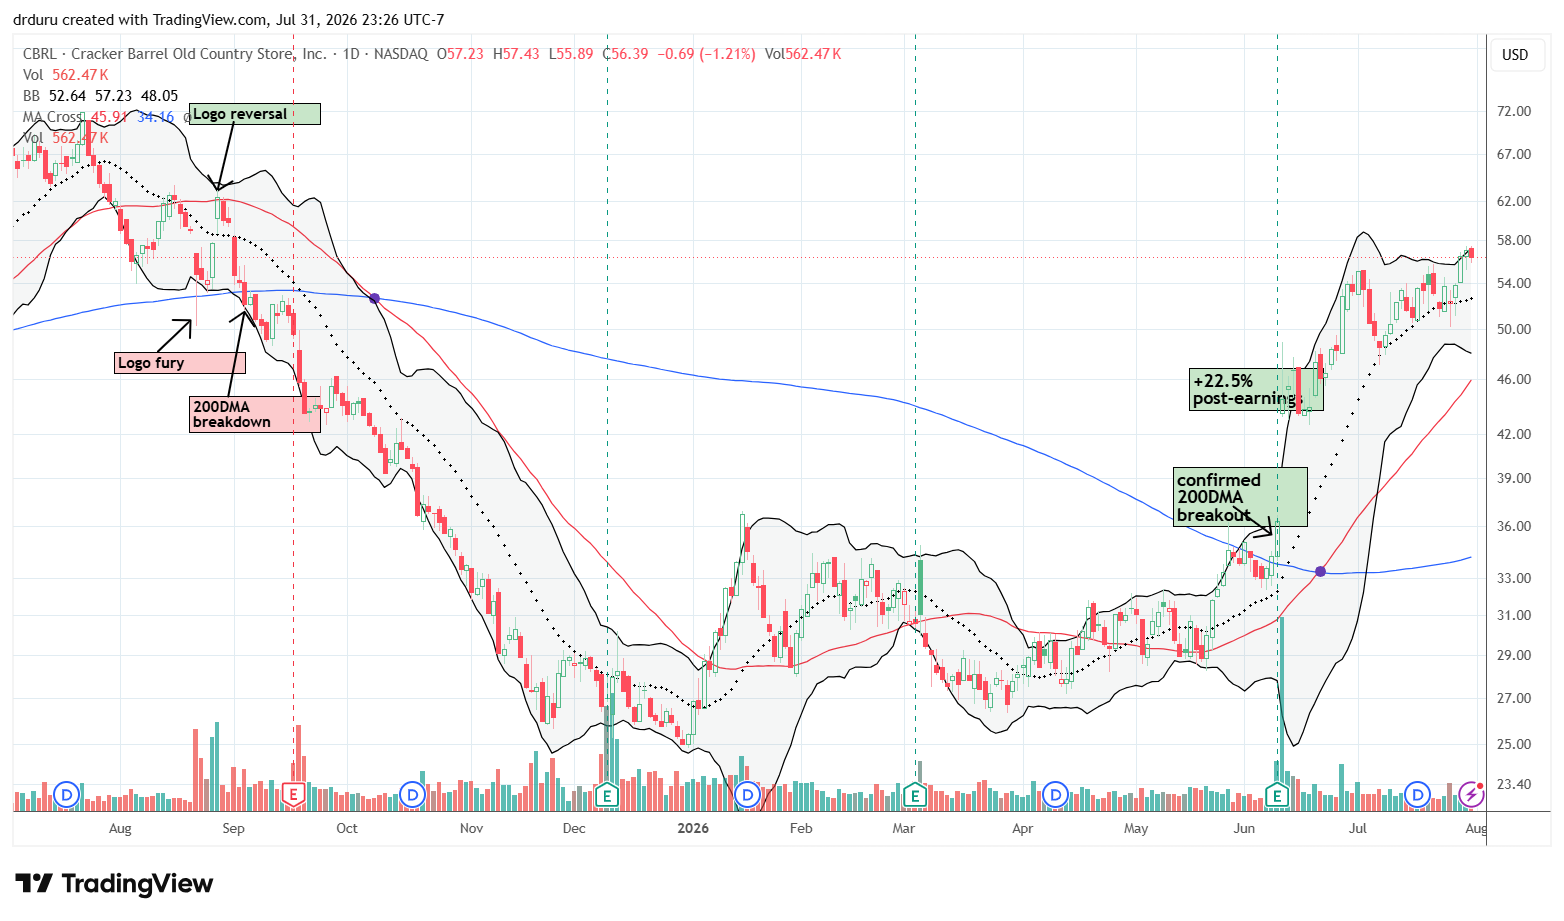
Technical status: The Cracker Barrel Old Country Store, Inc. (CBRL) continued its recovery with a return to its price level from the logo controversy.
Trade commentary: My CBRL trade came to an end as the stock traded below 20DMA support last week. I of course feel like my stop limit to preserve profits was targeted seeing how quickly the stock rebounded and rallied sharply. However, I am satisfied and have no interest in chasing the stock higher from here.
Lamb Weston Holdings, Inc. (LW)
Description: Lamb Weston produces frozen potato products for restaurants, food-service distributors, and retailers.
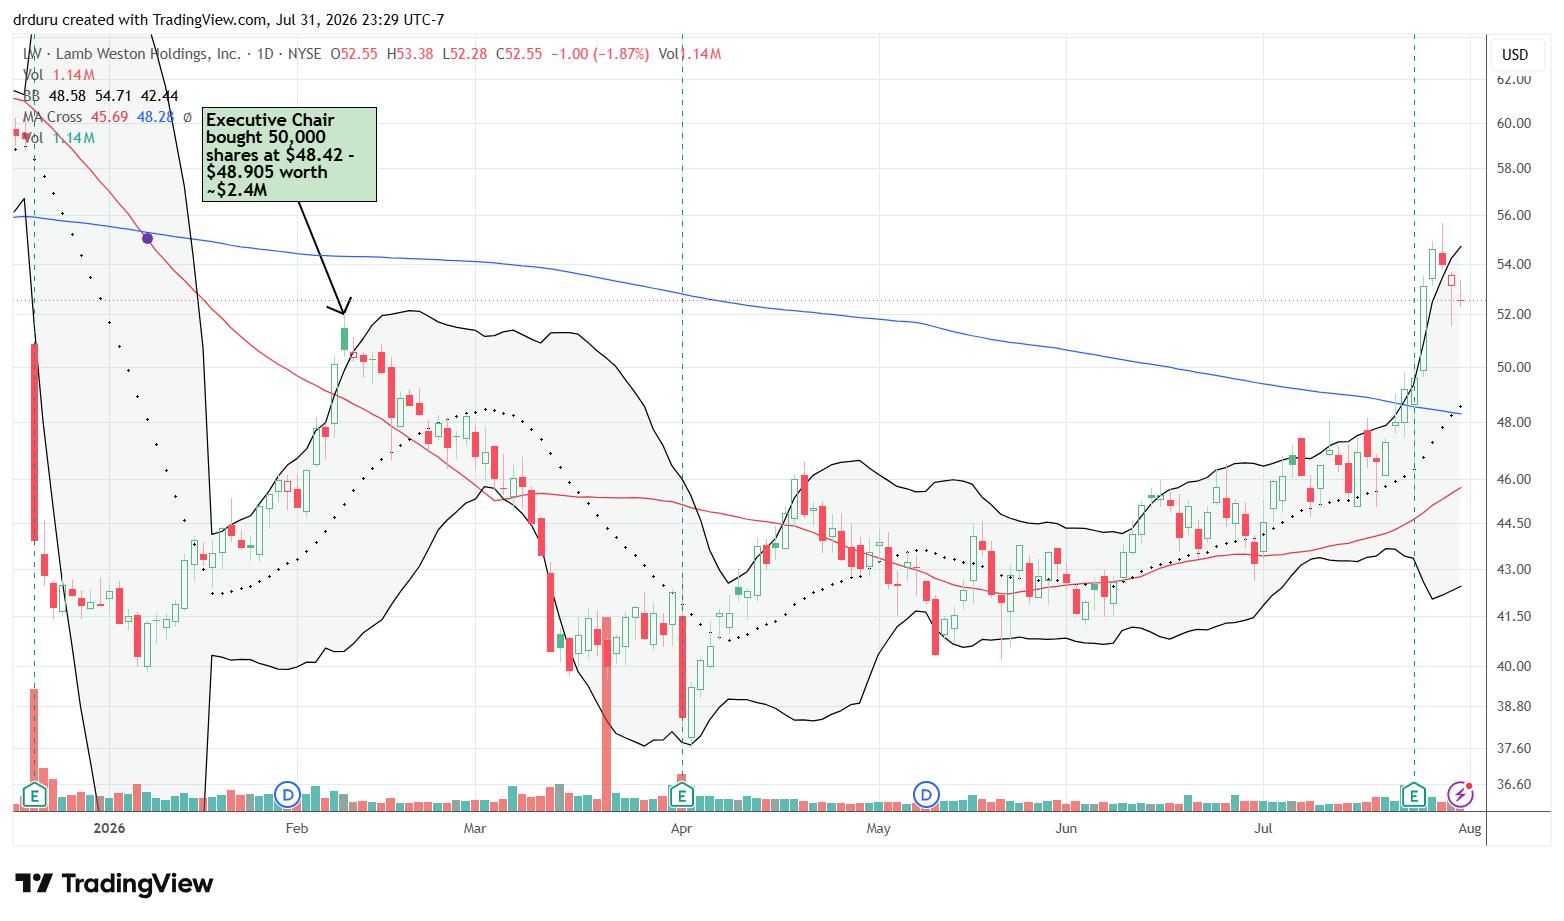
Technical status: Lamb Weston Holdings, Inc. (LW) jumped 7.1% earnings and finally hurdled the CEO’s purchase price.
Trade commentary: I breathed a major sigh of relief after LW survived its latest earnings report with a surge away from 200DMA support. According to Seeking Alpha, “Lamb Weston (LW) delivered a top- and bottom-line beat in the fiscal fourth quarter and exceeded the high end of their guidance by offsetting inflation pressures and disruptions in the Middle East through supply chain efficiencies and productivity gains.” I am continuing to hold LW as a long-term recovery play.
ServiceNow, Inc. (NOW)
Description: ServiceNow provides cloud software used to automate enterprise workflows, technology operations, customer service, and employee processes.
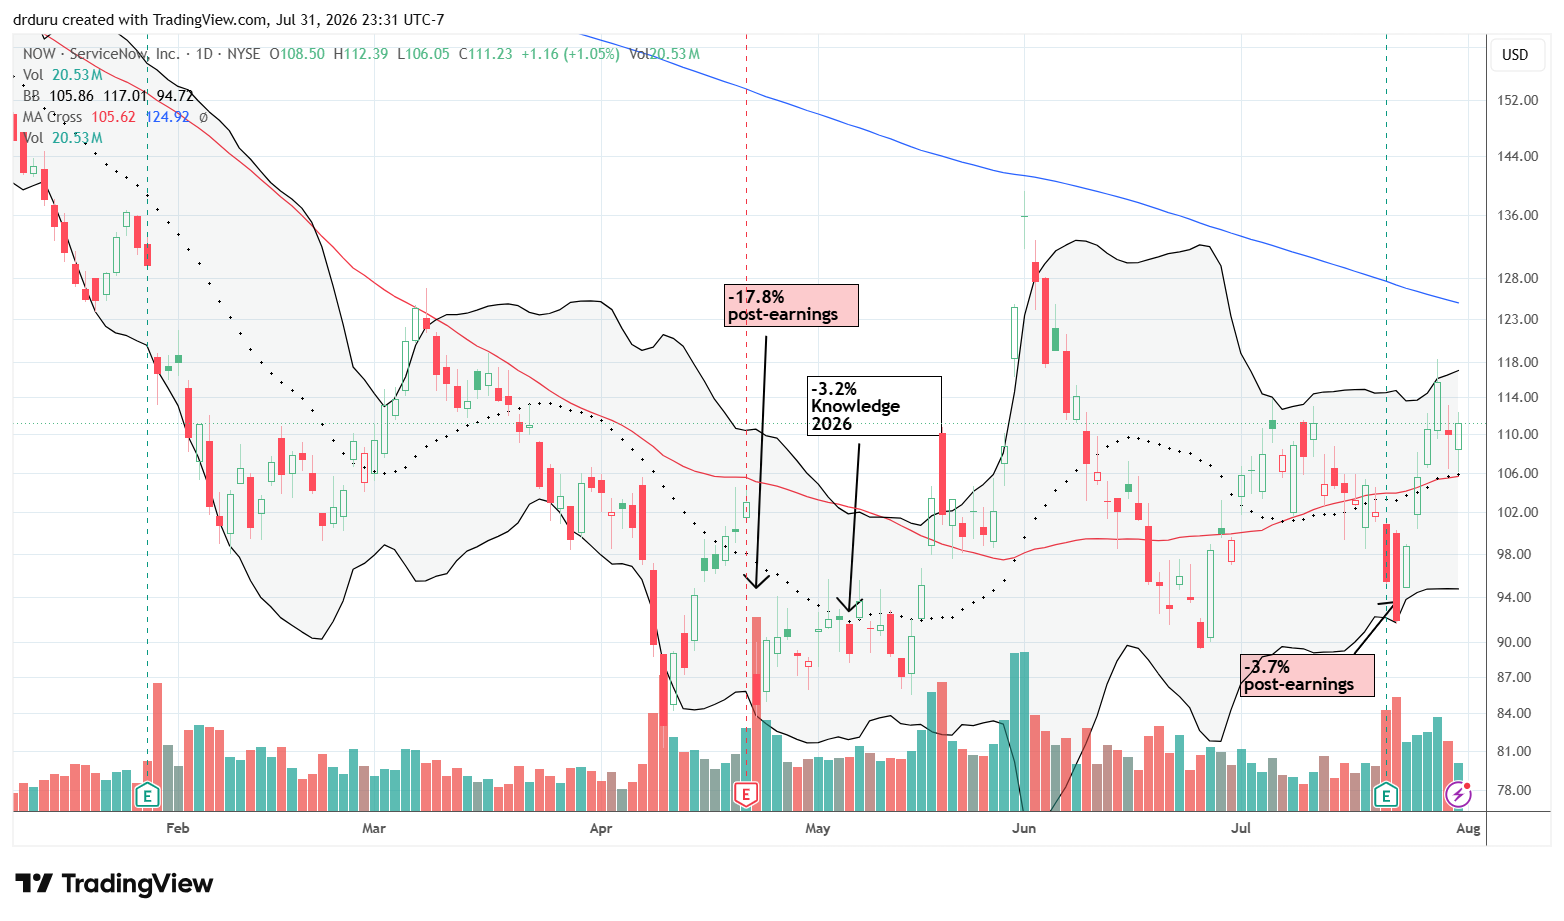
Technical status: ServiceNow, Inc. (NOW) recovered quickly from its post-earnings loss with a fresh 50DMA breakout.
Trade commentary: Given the collapse of Situational Awareness, I look at NOW through a different lens. Perhaps the surprising post-earnings fade was part of a large trade increasing shorts on the stock to fund longs in the AI trade. If so, then perhaps the sharp rebound from there was sparked by short-covering. Either way, NOW’s move higher and recovery of 50DMA support makes sense to me given another bullish earnings report that leans against the SaaSpocalypse narrative in the AI Panic over software.
Workday, Inc. (WDAY)
Description: Workday provides cloud applications for human resources, payroll, finance, planning, and enterprise management.
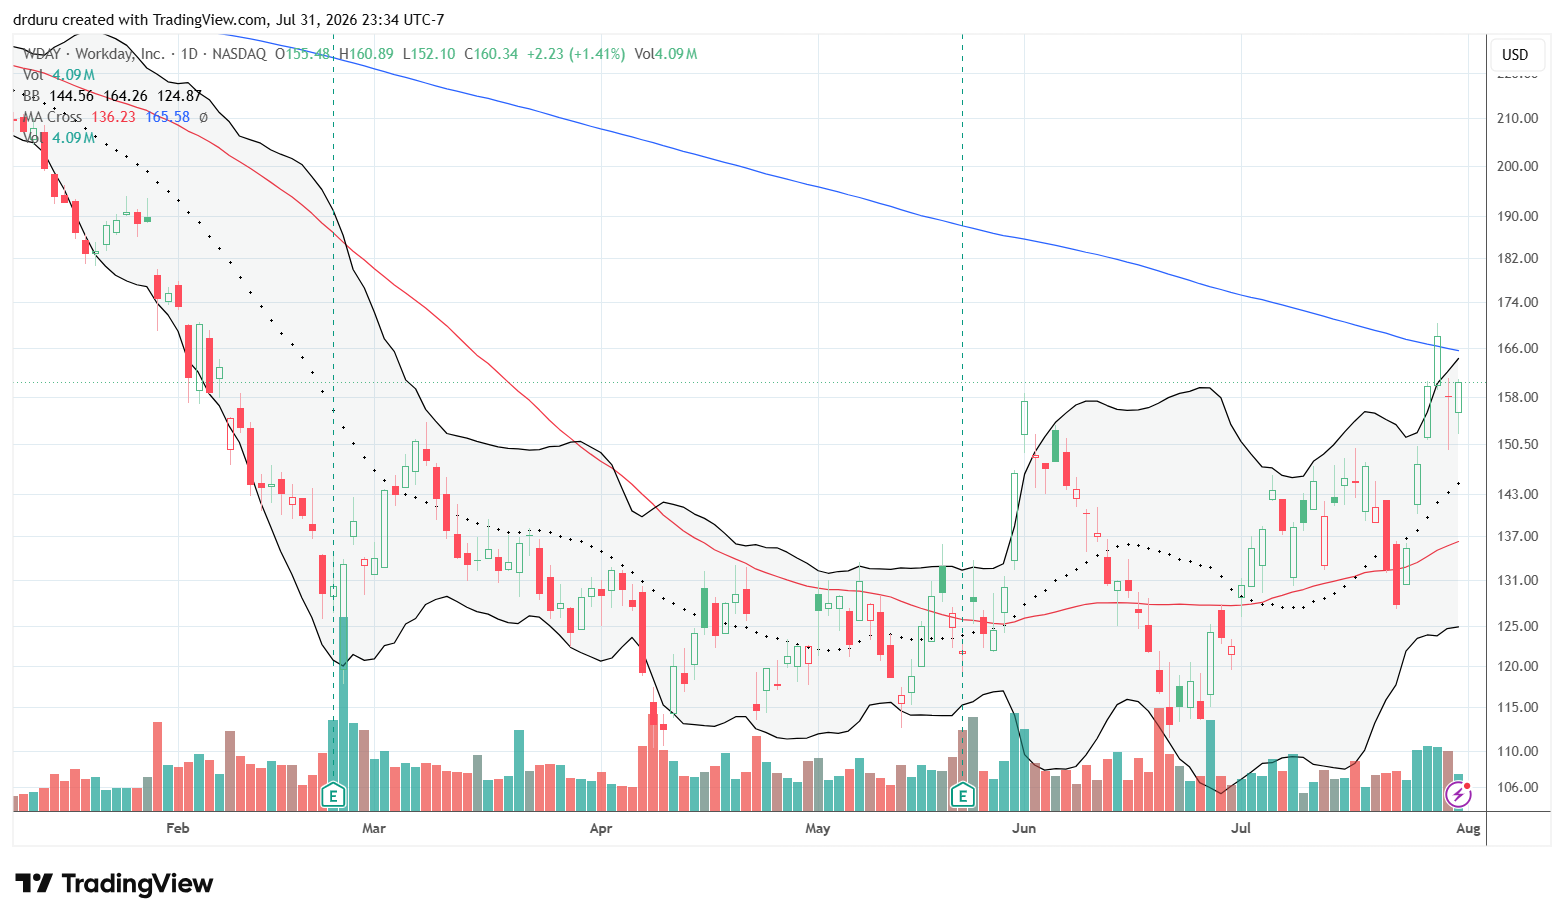
Technical status: Workday, Inc. (WDAY) bounced from 50DMA support but failed at 200DMA resistance after a seven-month low.
Trade commentary: I continue to trade in and out of WDAY as I hold other core software positions as a part of my PAIROS trading framework. While I took profits on my latest trade soon after WDAY’s 50DMA rebound, I am eyeing the test of 200DMA resistance with great interest. A confirmed breakout would qualify WDAY as an investment in PAIROS if the stock can survive the next earnings report.
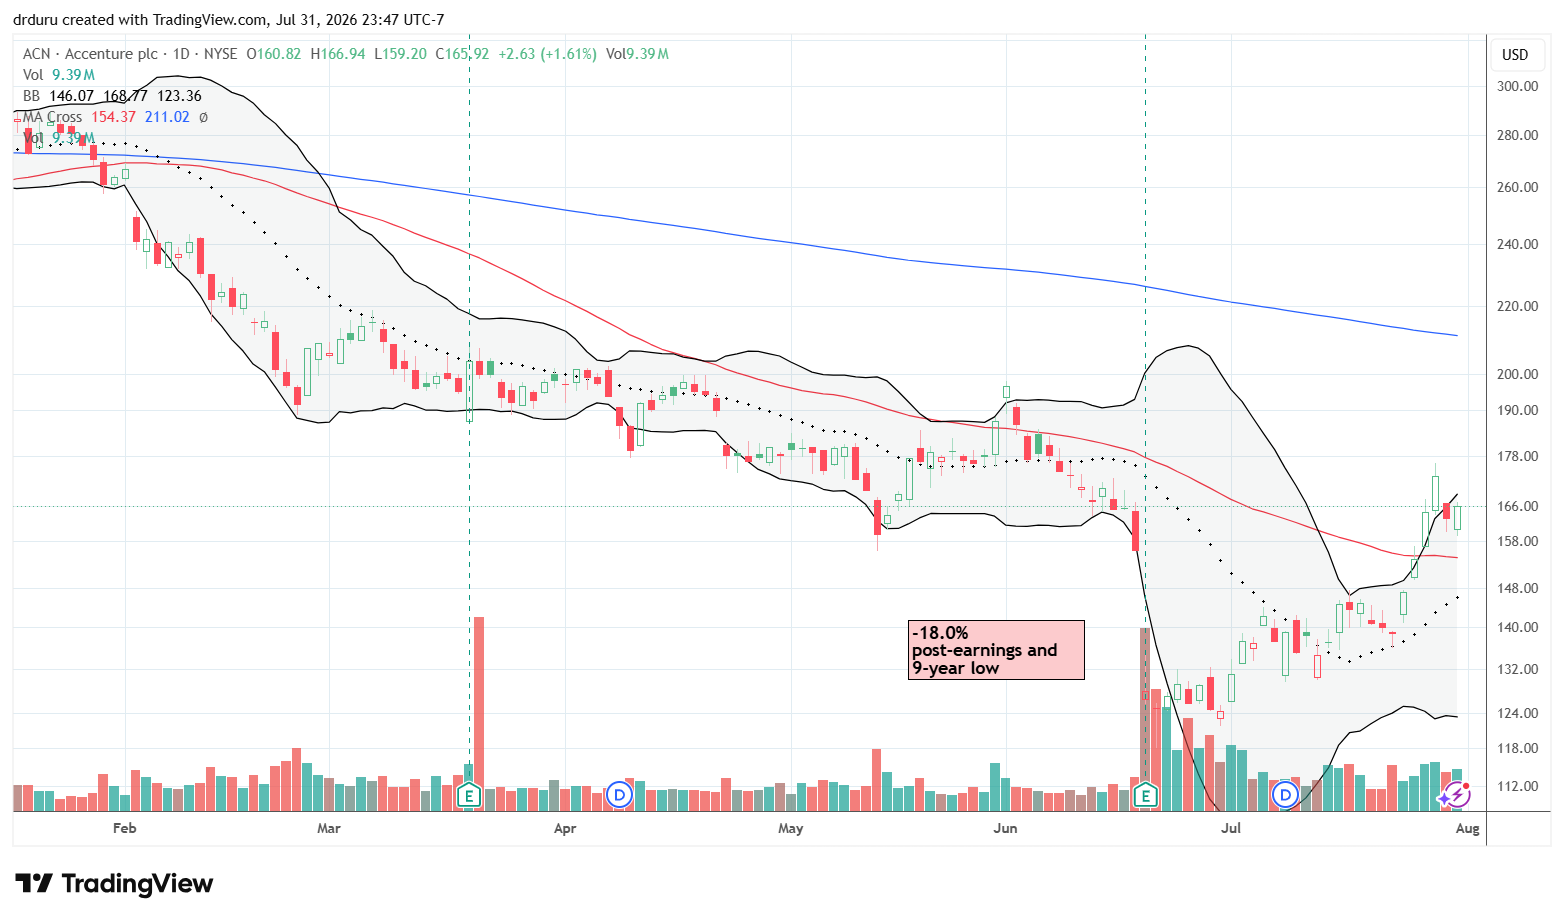
Accenture plc (ACN)
Description: Accenture provides consulting, systems integration, managed services, and technology-transformation support to large organizations.
Technical status: Accenture plc (ACN) finished recovering its last post-earnings loss with a 50DMA breakout.
Trade commentary: I thought I could forget about ACN for some time to come. Instead, the stock is right back on my radar with its latest 50DMA breakout that finished a full recovery from June’s disastrous post-earnings collapse. My ideal next trade will be a buy after a successful test of 50DMA support.
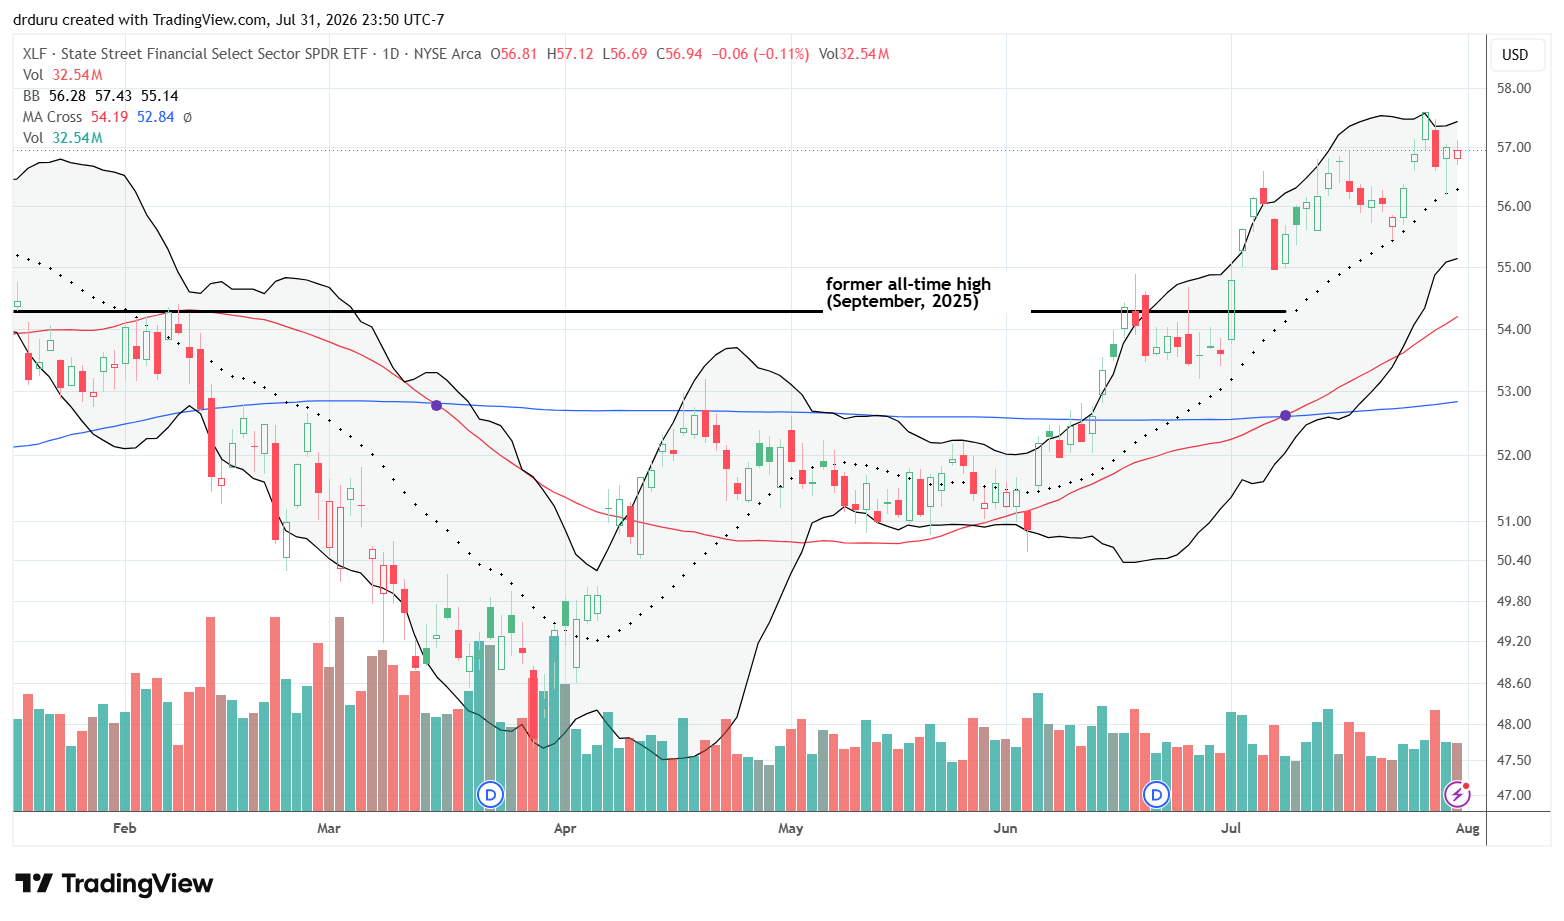
Financial Select Sector SPDR Fund (XLF)
Description: XLF tracks the financial-services companies contained in the S&P 500, including banks, insurers, payment companies, and capital-market firms.
Technical status: The Financial Select Sector SPDR Fund (XLF) set an all-time high last week as it continued to rally with its 20DMA uptrend.
Trade commentary: Financials stand out even more after last week’s AI crash and post-Fed disappointment created just a small nick on XLF. With the ETF trading comfortably above an uptrending 20DMA, I cannot harbor bearish thoughts about the overall stock market.
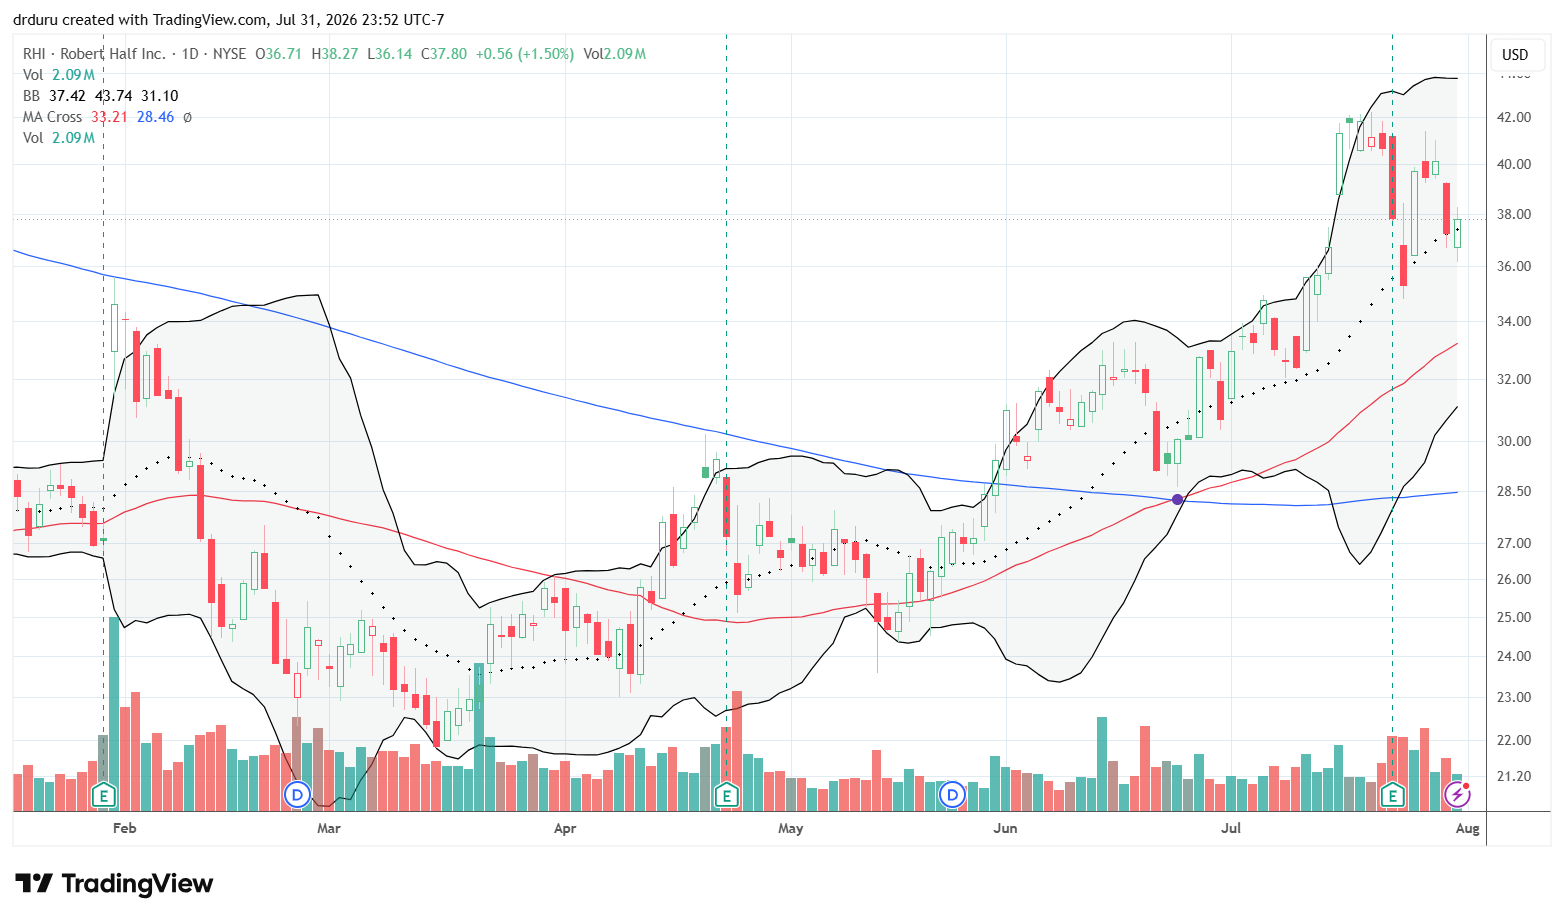
Robert Half Inc. (RHI)
Description: Robert Half provides professional staffing, recruitment, consulting, and talent-management services.
Technical status: Robert Half Inc. (RHI) fell from a 52-week high post-earnings but held 20DMA support.
Trade commentary: RHI soared over 12% on Monday after BMO Capital Markets upgraded the stock to Outperform with a $47 price target. The strong vote of confidence changed my wariness about the stock. While the stock suspiciously stopped short of finishing a reversal of its post-earnings loss, I like how the uptrending 20DMA is holding as support. I am a buyer on a higher close.
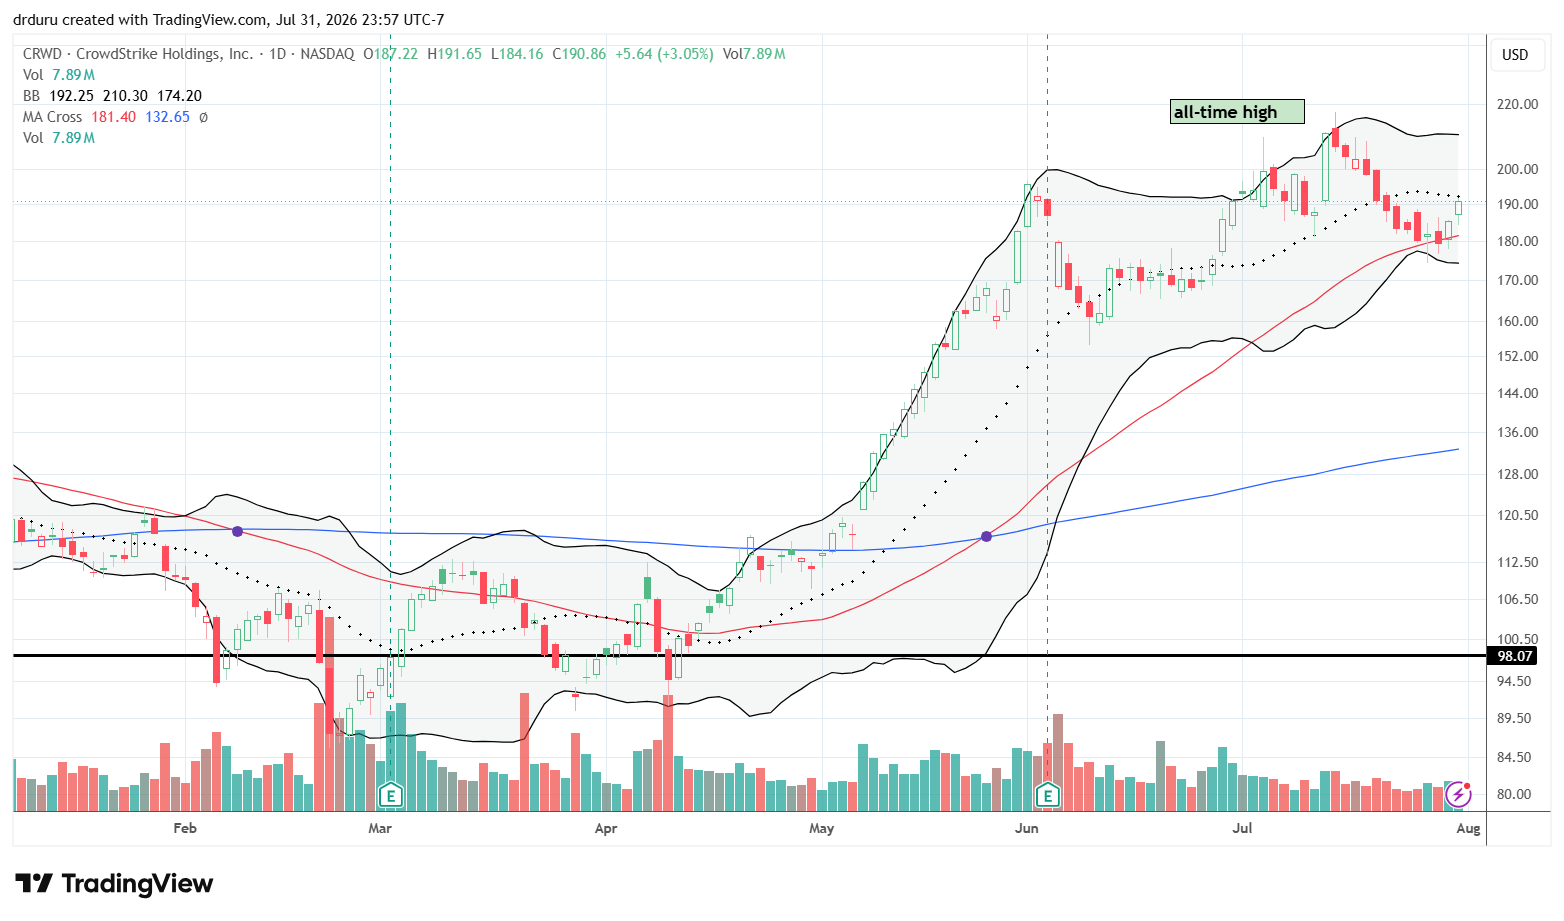
CrowdStrike Holdings, Inc. (CRWD)
Description: CrowdStrike provides cloud-based cybersecurity software for endpoint protection, threat intelligence, identity security, and security operations.
Technical status: CrowdStrike Holdings, Inc (CRWD) held 50DMA support after falling from its all-time high.
Trade commentary: I took profits on CRWD two months ago. The picture-perfect test of 50DMA support put the stock right back on my buy list. I am targeting a small position this time given the stock’s negative reaction to the last earnings report.
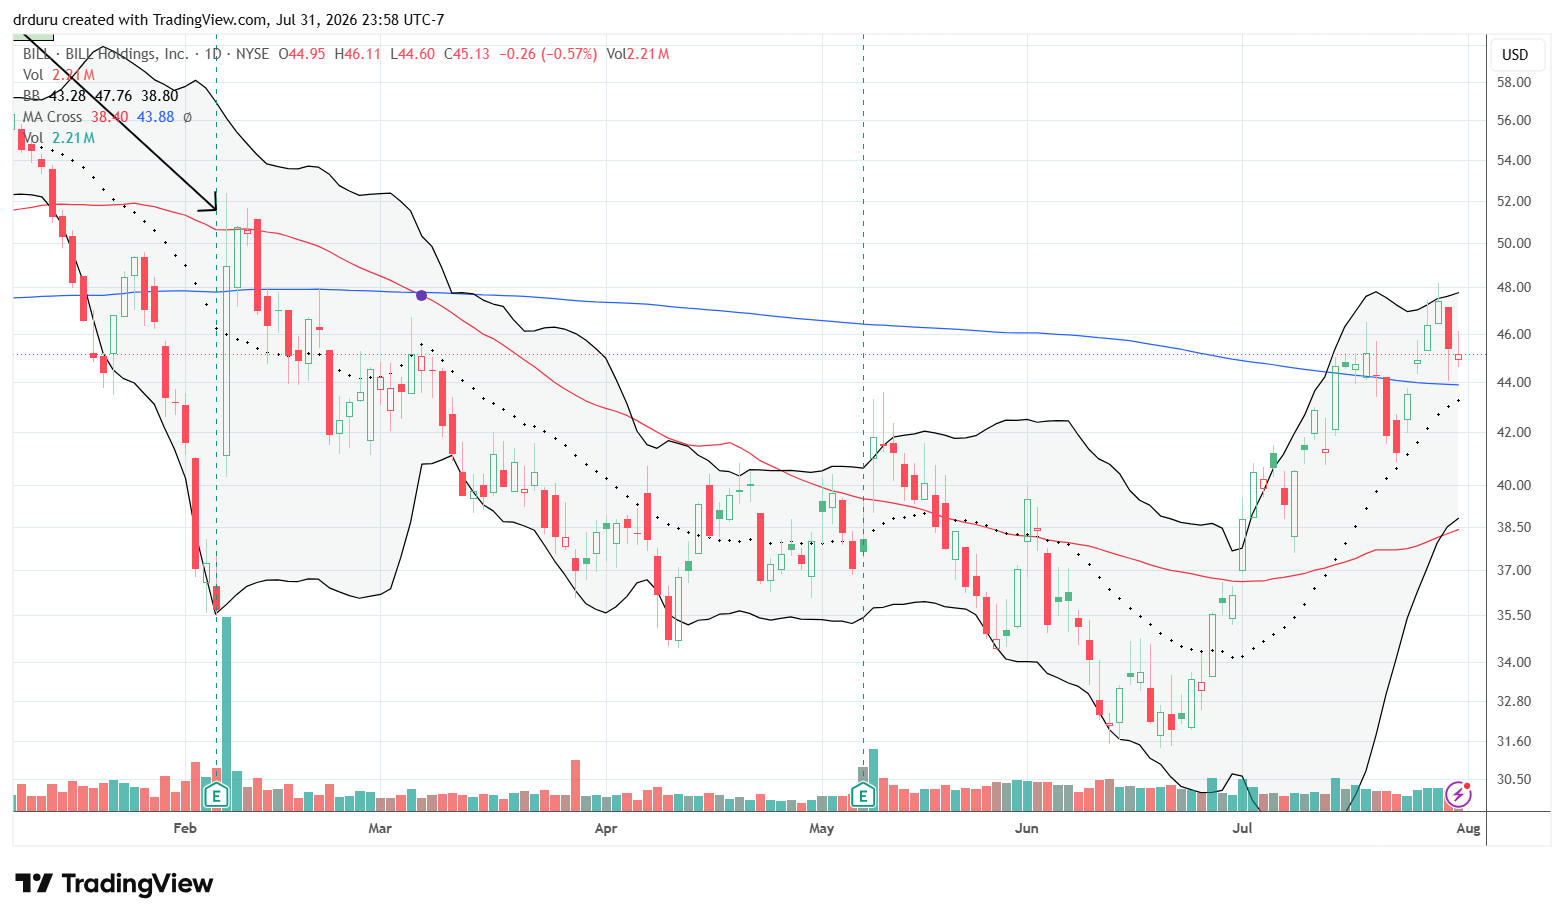
BILL Holdings, Inc. (BILL)
Description: BILL provides cloud software that automates accounts payable, accounts receivable, payments, and expense management for smaller businesses.
Technical status: BILL Holdings, Inc (BILL) held a 200DMA breakout.
Trade commentary: BILL returned to my buy list almost a year ago. I finally loaded up on shares in May after a positive post-earnings response. Although the stock continued to fade at the time, I considered the position to come at a discount given it traded well below the surge to around $51 on February’s news of potential interest in buying the company. The 200DMA breakout is an encouraging and reinforcing technical development.
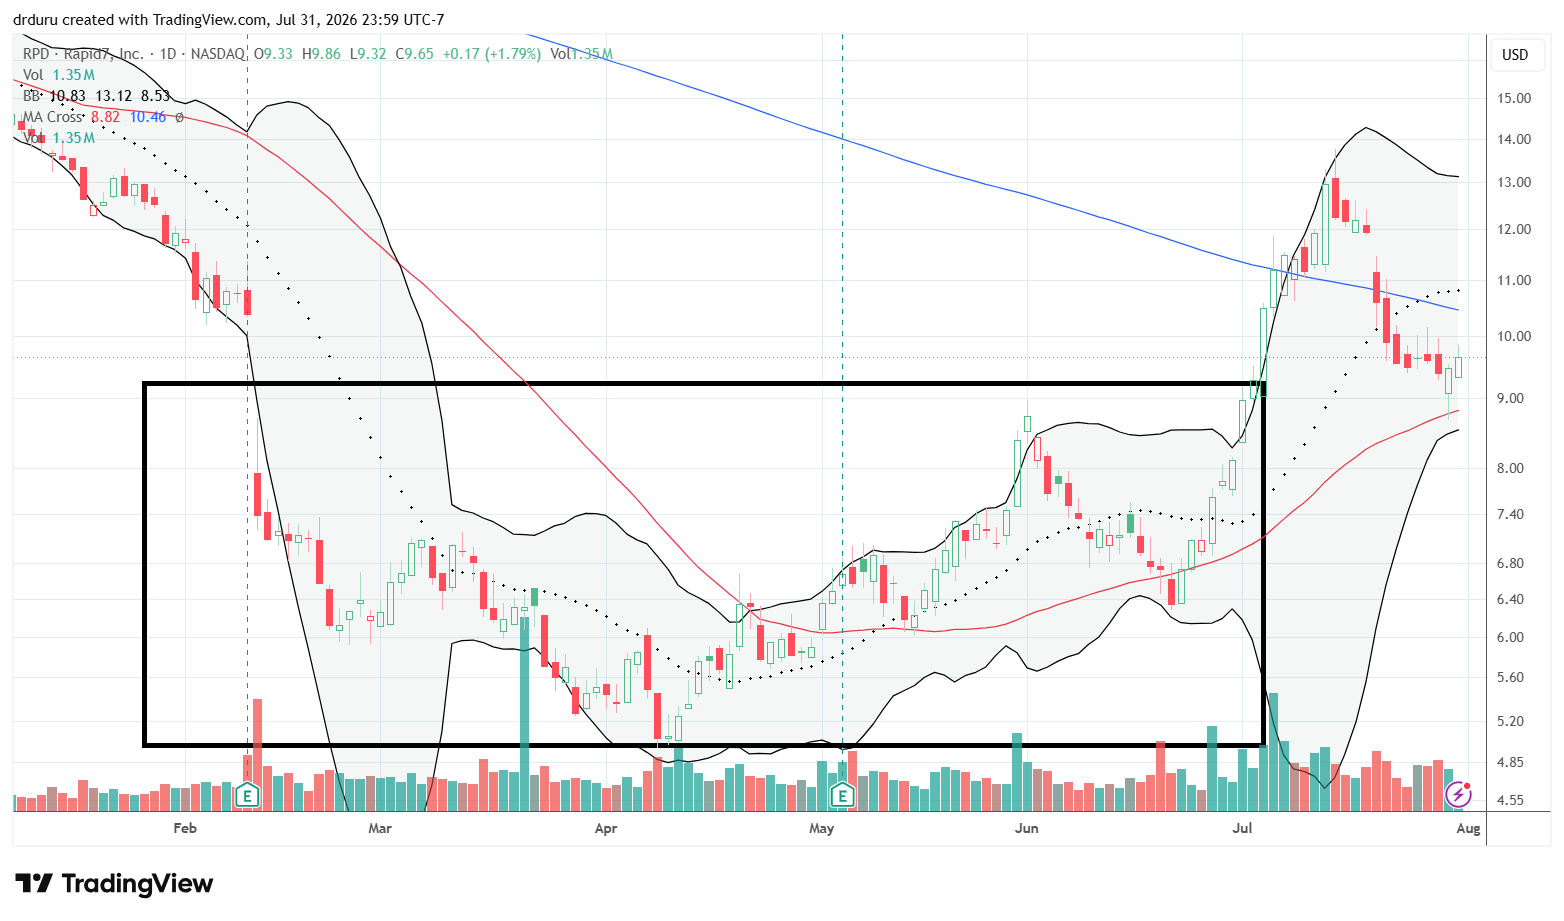
Rapid7, Inc. (RPD)
Description: Rapid7 develops cybersecurity software for vulnerability management, cloud security, threat detection, and security operations.
Technical status: Rapid7, Inc (RPD) lost its 200DMA breakout but confirmed 50DMA support right at the top of the previous trading box.
Trade commentary: RPD clung to a position on a buy list by surviving a test of 50DMA support that happened to roughly coincide with the “bottoming box” I drew just a week ago. I am a buyer on a fresh 200DMA breakout.
Everus Construction Group, Inc. (ECG)
Description: Everus provides electrical, mechanical, transmission, and construction services, including work supporting large data-center projects.
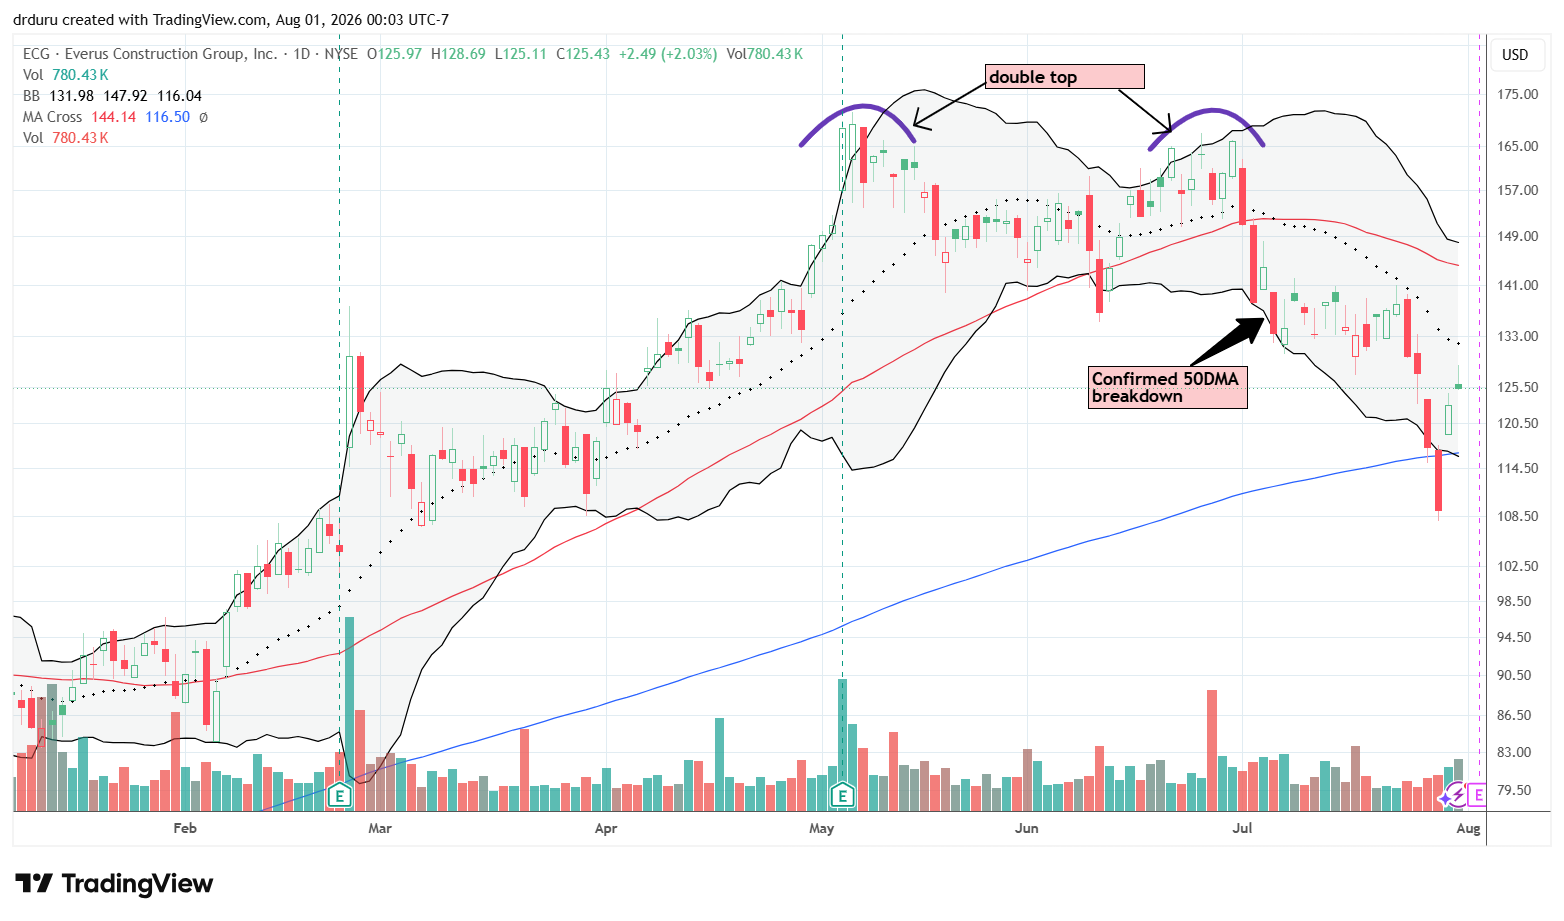
Technical status: Everus Construction Group, Inc. (ECG) further confirmed a double-top with a 200DMA breakdown as the AI sell-off accelerated.
Trade commentary: The AI crash validated my earlier decision to stop out of ECG and preserve remaining profits. That decision was tough because I wanted to build ECG into a core AI-related investment. The stock’s sharp rebound from its 200DMA breakdown is encouraging, but the double-top still looms ominously as earnings approach this week. The 6.9% loss on the day of the AI crash finished reversing all of ECG’s February breakout. I am in watch mode.
CECO Environmental Corp. (CECO)
Description: CECO Environmental supplies industrial air, water, emissions-control, filtration, and energy-transition equipment.
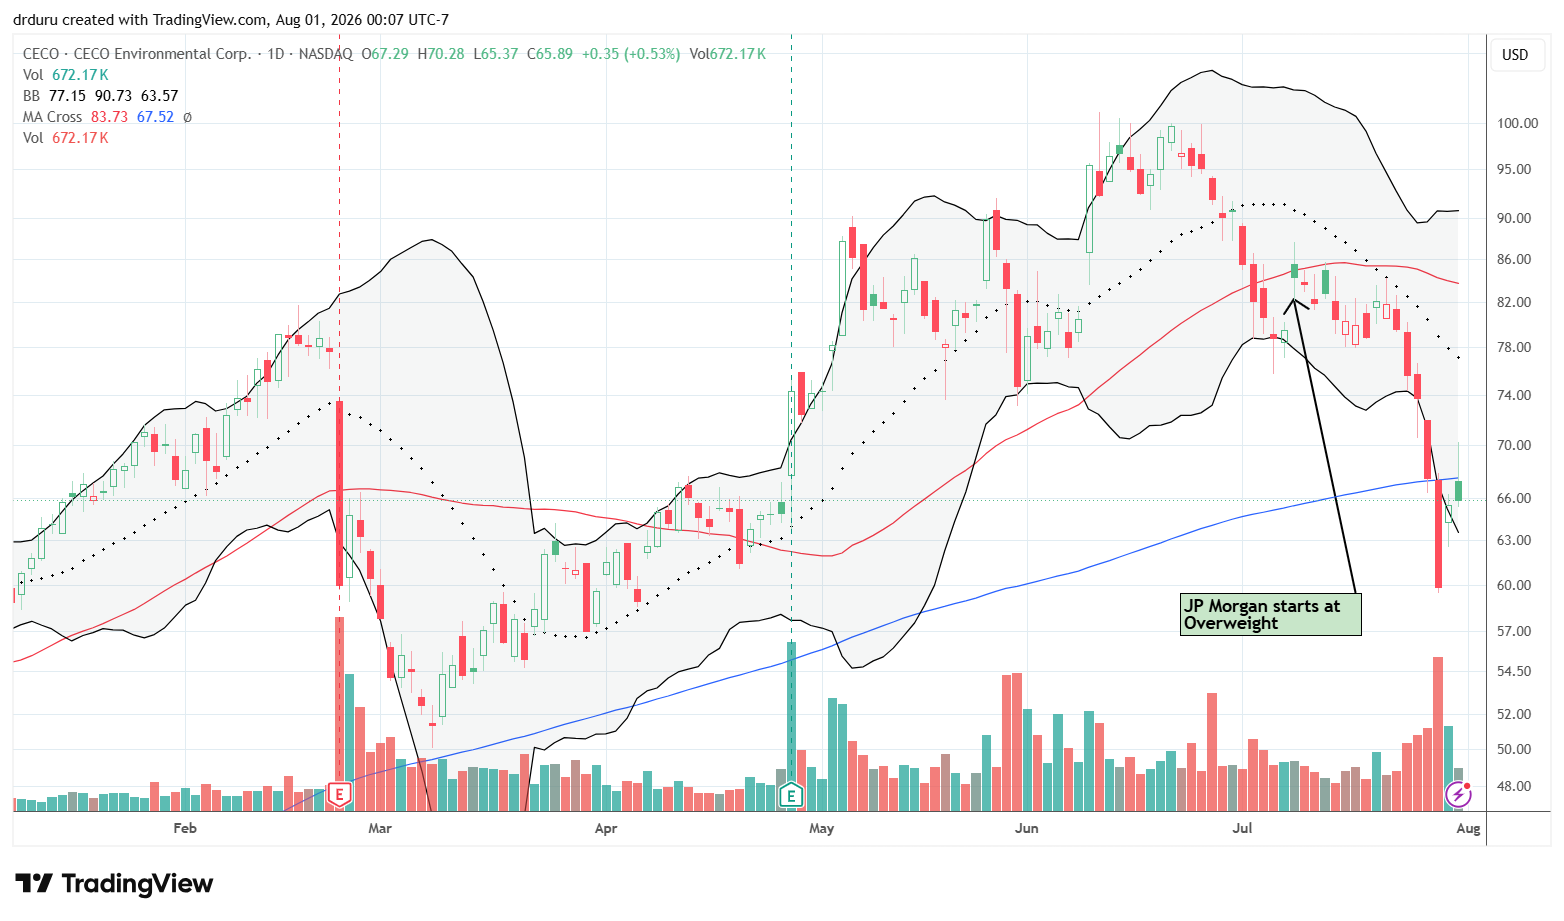
Technical status: A JP Morgan upgrade failed to save CECO Environmental Corp. (CECO) from the AI crash.
Trade commentary: In March, I targeted CECO as a buy on a test of 200DMA support. I somehow missed the picture-perfect bounce less than 2 weeks later (no price alerts). Thus, I was particularly eager to buy CECO on a bounce from 200DMA support. My buy stop was triggered on an intraday bounce, but the selling during the AI crash broke CECO down starting with an 11.4% loss. I was taken aback because I did not consider CECO to be a significant AI trade. I am holding given I consider current levels to be an attractive discount to JP Morgan’s overweight rating earlier in July.
Caterpillar Inc. (CAT)
Description: Caterpillar manufactures construction, mining, energy, transportation, and heavy industrial equipment.
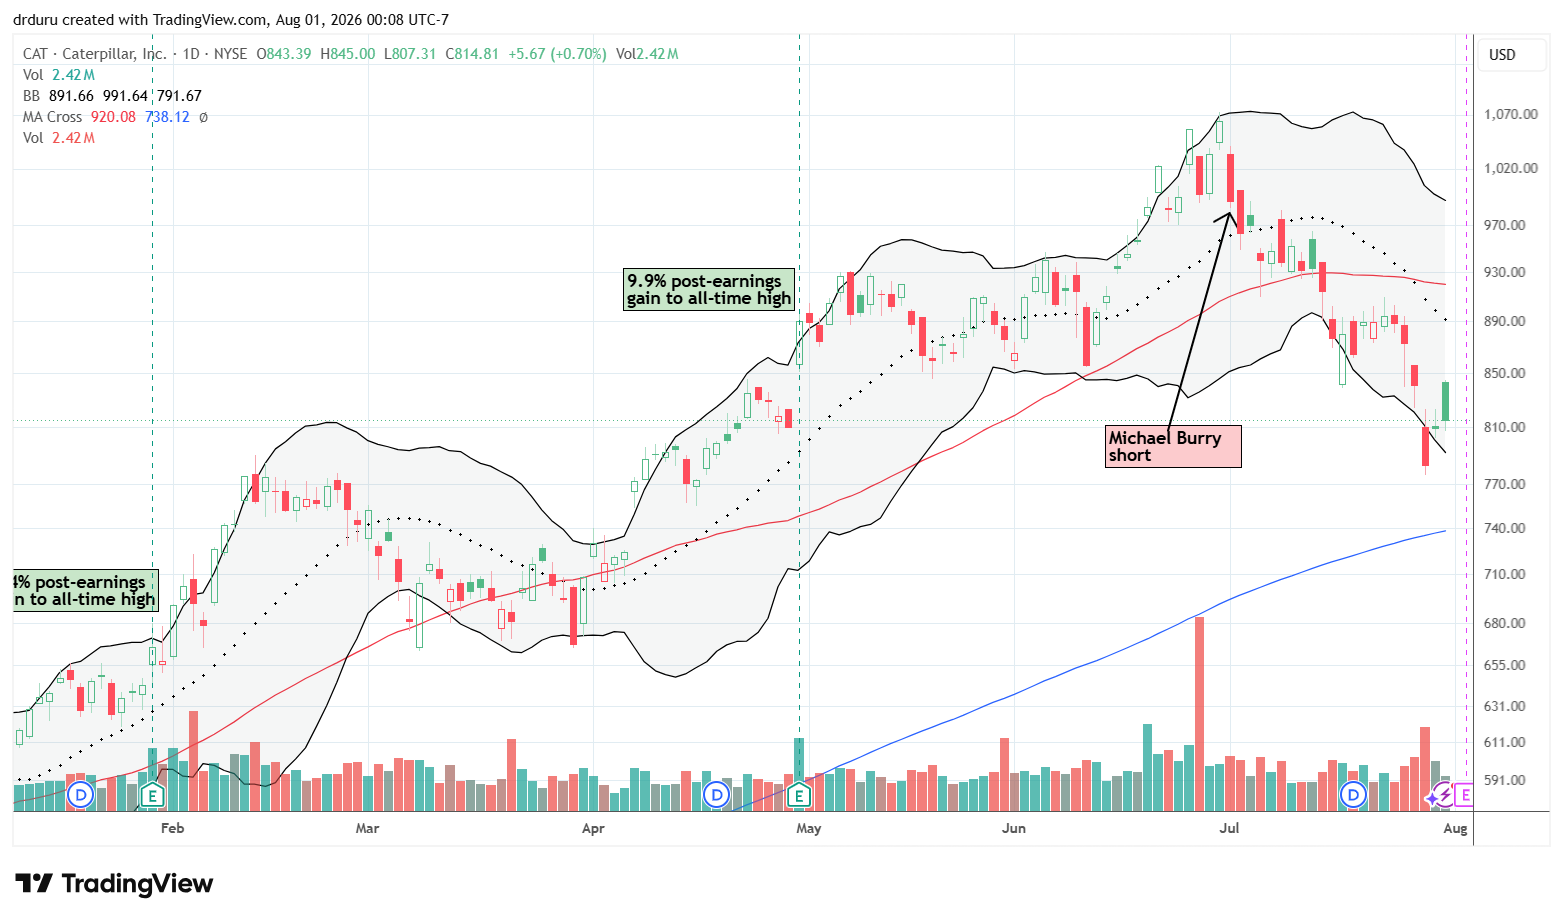
Technical status: Caterpillar Inc (CAT) broke down to a 3-month low with the AI crash before a tepid rebound.
Trade commentary: Caterpillar demonstrated its participation in the AI trade by dropping 6.9% during the AI crash. Friday’s fade preserved the ongoing downtrend. Now that the stock has completely reversed its last post-earnings gain, this coming week’s earnings report should resolve CAT’s prevailing trend, either a continued downtrend to a test of 200DMA support or the hard work ahead of breaking through multiple layers of resistance starting with the former support at the June low around $834.
DoorDash, Inc. (DASH)
Description: DoorDash operates a local-commerce platform connecting consumers with restaurants, grocery stores, retailers, and delivery providers.
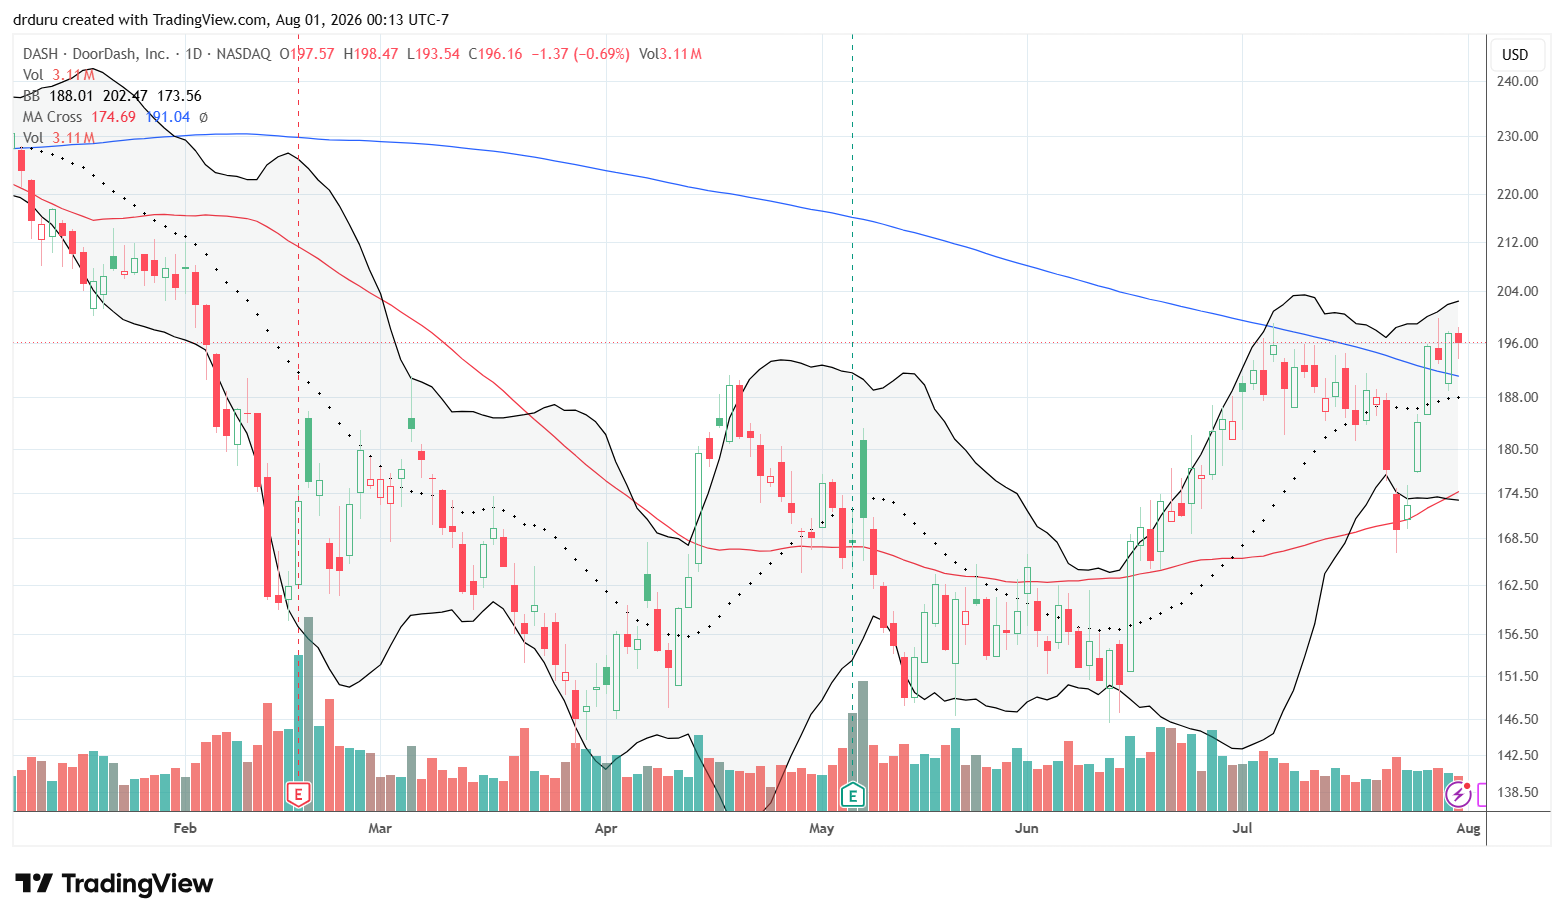
Technical status: DoorDash, Inc. (DASH) managed a 200DMA breakout and a marginal six-month high.
Trade commentary: DASH survived Wednesday’s selling nearly unscathed. Perhaps news of government clearance for drone deliveries helped the stock maintain its 200DMA breakout. This support should get a critical test in the upcoming earnings report.
Duolingo, Inc. (DUOL)
Description: Duolingo operates a mobile learning platform focused primarily on language education and increasingly supported by artificial intelligence.
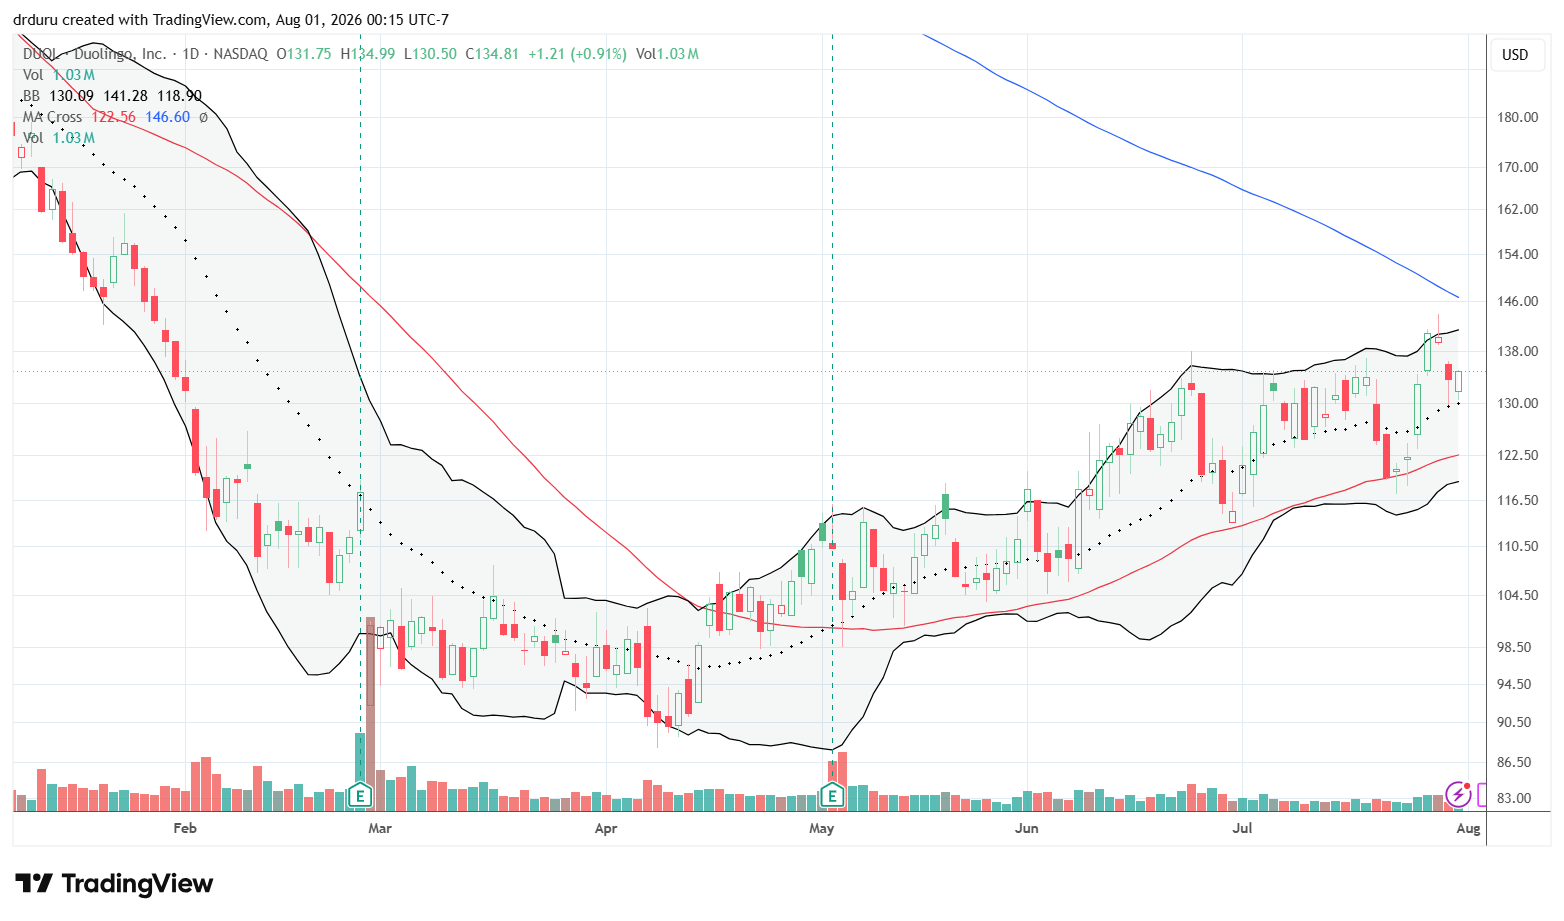
Technical status: Duolingo, Inc. (DUOL) continued a slow, grinding climb from a 3-year low, following its uptrending 50DMA.
Trade commentary: DUOL has been slowly grinding higher since a 3-year low in April. During this time, the stock’s 50DMA held as perfect support. I traded profitably over this uptrend, but I took profits well ahead of upcoming earnings. I will be watching to see whether DUOL can finally surprise investors and thus get a boost above 200DMA resistance.
CDW Corporation (CDW)
Description: CDW distributes computers, software, cloud services, cybersecurity products, and technology solutions to businesses and public-sector organizations.
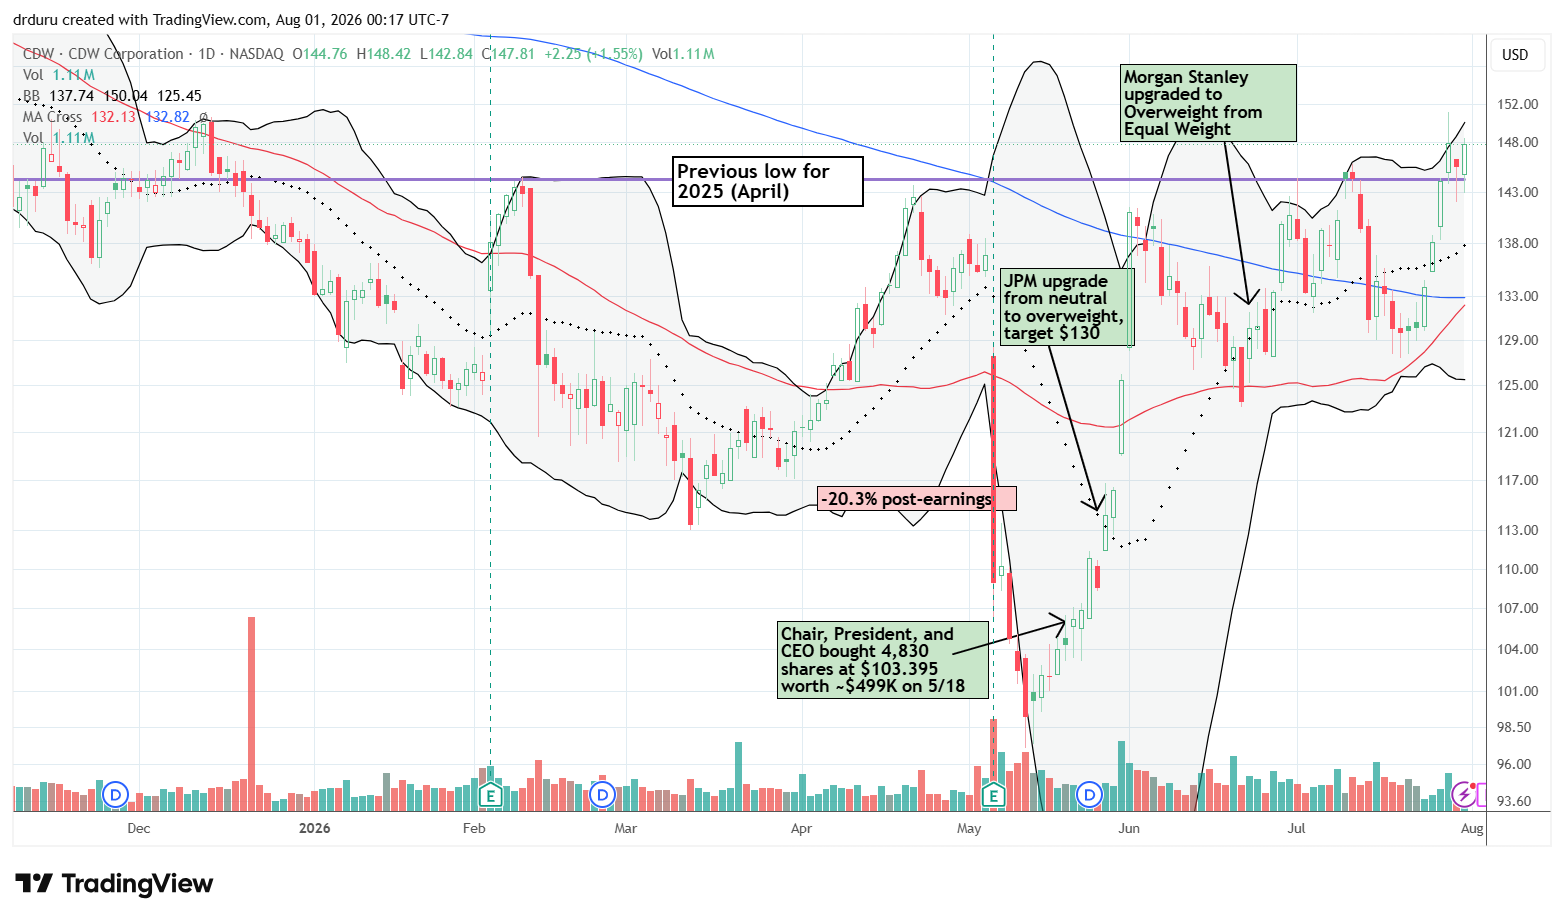
Technical status: CDW Corporation (CDW) reached a new high for the year and confirmed a sharp bottoming pattern.
Trade commentary: CDW snuck its way to a breakout last week. The stock even gained 2.7% during the AI crash. With analyst upgrades and insider buying as a tailwind, I like CDW’s prospects for holding its recent V-bottom. I will be watching for an “all-clear to buy” sign from this week’s earnings.
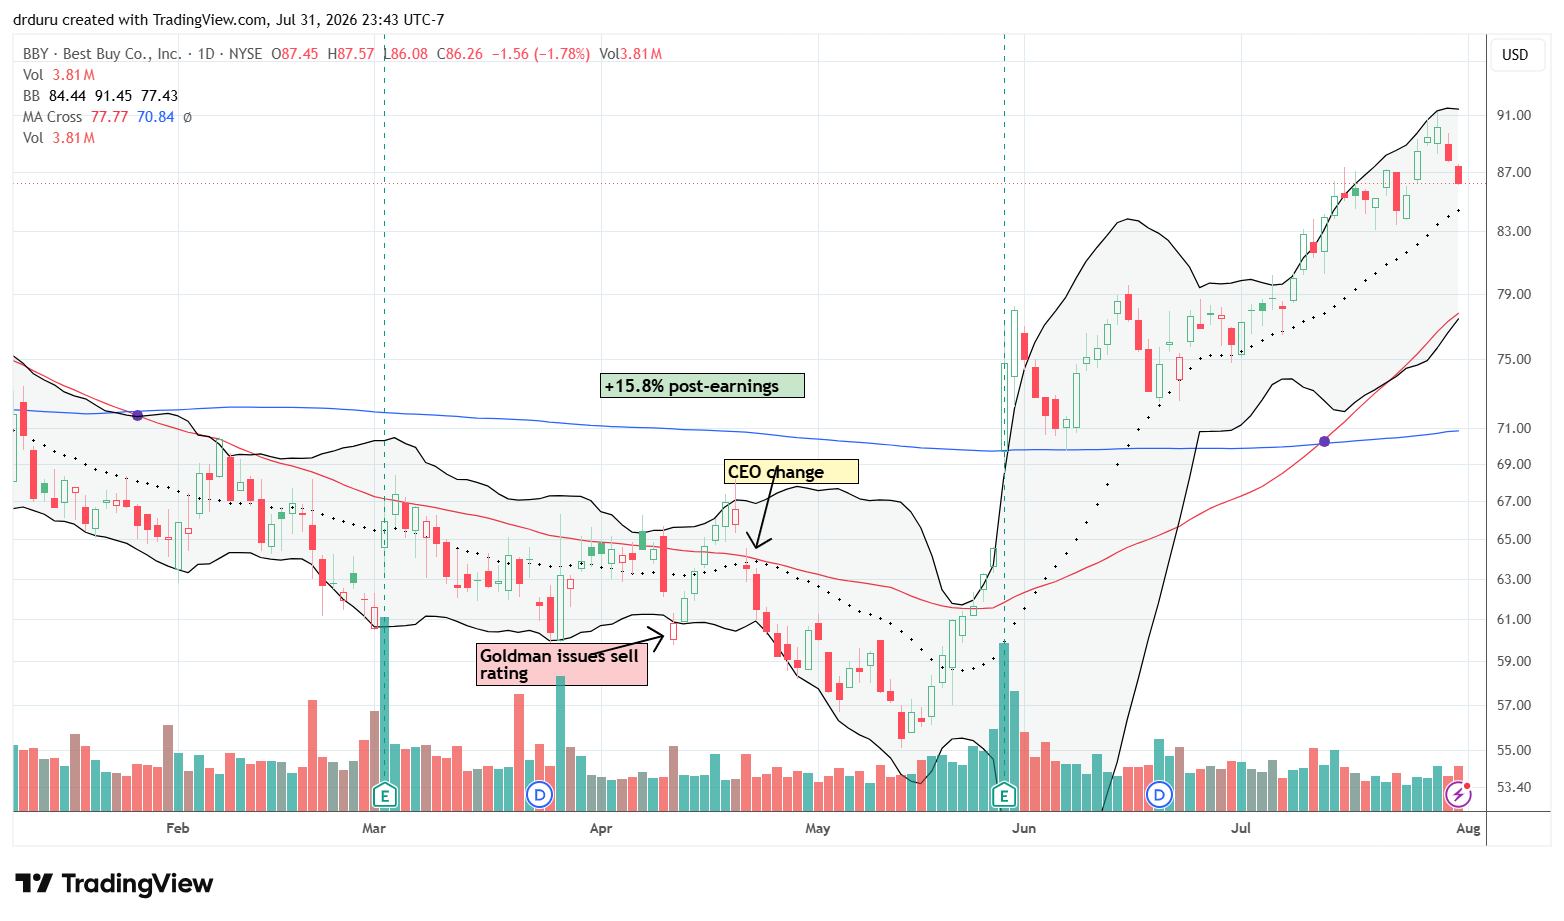
Best Buy Co., Inc. (BBY)
Description: Best Buy sells consumer electronics, appliances, computing products, and related installation and support services.
Technical status: Best Buy Co., Inc (BBY) has continued to rally from June’s post-earnings surge and now trades at a 17-month high.
Trade commentary: BBY snuck right by me! The stock made a new 17-month high during the AI crash, but faded from there. I am impressed the stock has maintained its post-earnings momentum. With earnings over three weeks away, I see a runway to trade the uptrend starting with a successful test of 20DMA support.
Footnotes
Subscribe for free to get email notifications of future posts!
“Above the 50” (AT50) uses the percentage of stocks trading above their respective 50-day moving averages (DMAs) to measure breadth in the stock market. Breadth defines the distribution of participation in a rally or sell-off. As a result, AT50 identifies extremes in market sentiment that are likely to reverse. Above the 50 is my alternative name for “MMFI” which is a symbol TradingView.com and other chart vendors use for this breadth indicator. Learn more about AT50 on my Market Breadth Resource Page. AT200, or MMTH, measures the percentage of stocks trading above their respective 200DMAs.
Active AT50 (MMFI) periods: Day #257 over 20%, Day #84 over 30%, Day #80 over 40%, Day #35 over 50% (overperiod), Day #57 under 60%, Day #230 under 70%
Source for charts unless otherwise noted: TradingView.com
Full disclosure: long IWM calls, long QQQ call spread, long SMH put spread, long TLT, long CECO, long NVDA calls, long AUD/JPY, long MSFT, long RDDT, long RBLX, long SOFI, long LW, long NOW, long BILL
FOLLOW Dr. Duru’s commentary on financial markets via StockTwits, BlueSky, and even Instagram!
*Charting notes: Stock prices are not adjusted for dividends. Candlestick charts use hollow bodies: open candles indicate a close higher than the open, filled candles indicate an open higher than the close.
* Blog notes: I use ChatGPT to help with editing and news discovery.