

Housing Market Intro and Summary
The 21st Century ROAD to Housing Act became a milestone in July for the housing market. Housing-related stocks pulled back from peak levels. The data released in July showed more stasis and tepid market dynamics. The bump in sentiment associated with House passage of ROAD proved to be temporary, suggesting builders quickly turned their attention back to the challenging market conditions currently confronting them.
Here is a summary for July’s housing market update:
- The ROAD housing market outlook remained largely unchanged as homebuilder stocks, construction activity, and housing data continued to reflect a prolonged period of stasis.
- The passage of the 21st Century ROAD to Housing Act coincided with another peak in housing stocks, but the broader three-year trading range remained intact.
- Homebuilder sentiment weakened in July as elevated mortgage rates, affordability pressures, labor shortages, and construction costs continued weighing on confidence.
- Single-family housing starts remained essentially flat while permits stayed near three-year lows, suggesting limited near-term expansion in new construction.
- New home sales improved modestly in June, but year-over-year sales remained weaker and affordability continued to constrain demand.
- Existing home sales stayed range-bound despite record median prices, illustrating the ongoing tension between affordability improvements and limited inventory.
- Rising mortgage rates once again pressured housing-related equities and reinforced a cautious outlook for the ROAD housing market.
Housing Stocks
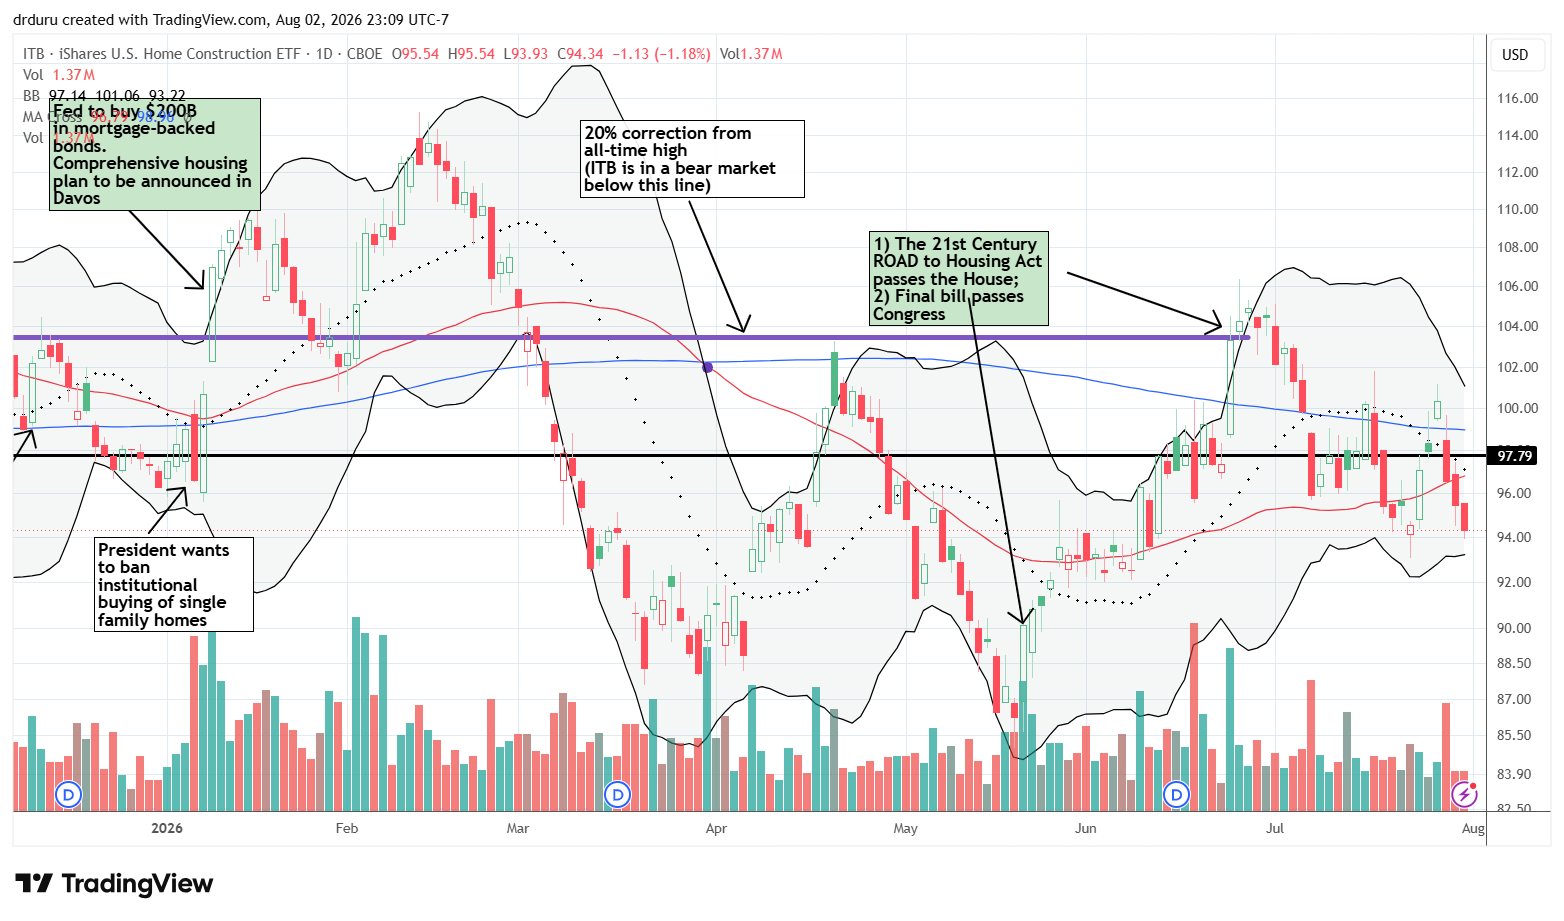
The final passage of the 21st Century ROAD to Housing Act marked the latest peak for the iShares US Home Construction ETF (ITB). Going forward I will use this juncture as an important pivot point for stock prices and housing data. The return to a bear market hardly warrants mention given the broader pattern remains a nearly three-year trading range that has tightened around the levels that formed a triple bottom in 2024. The stasis I described in my last review of the housing market remained in place. Rising mortgage rates pressured housing-related stocks as ITB lost 9.7% for the month compared to a mere 0.1% loss for the S&P 500.
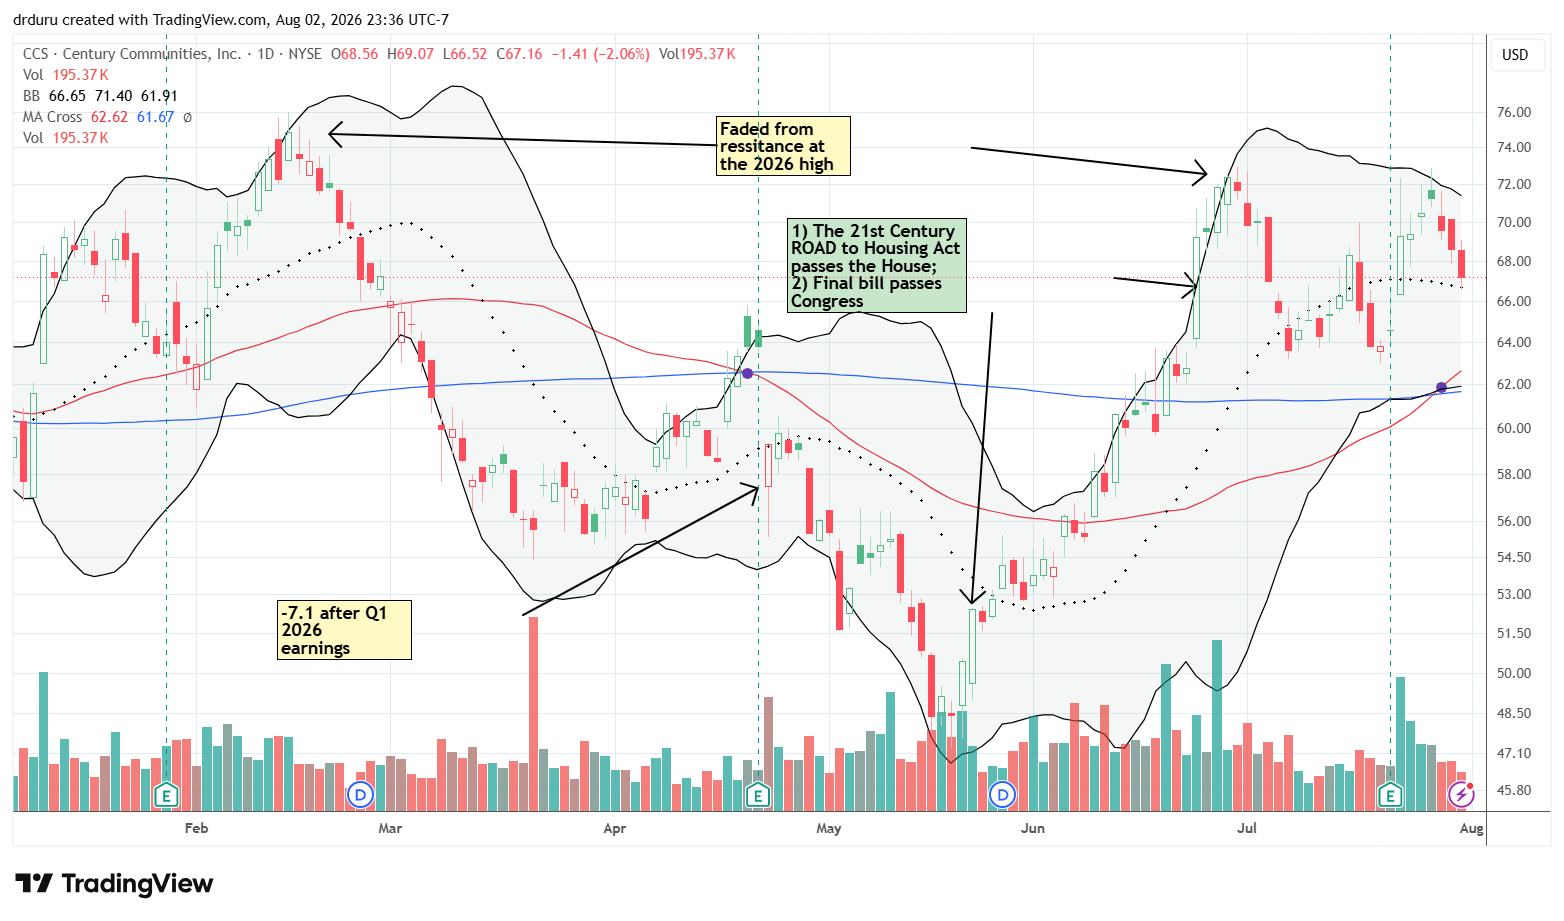
Last month, I made the case for buying and waiting on Century Communities. After earnings the stock jumped 7.8%. However, the stock did not maintain enough momentum to hurdle the high from June. The stock now looks like it will soon reverse all its post-earnings gains. The pattern of consolidation among publicly traded builders and CCS’s past performance both suggest the stock could become a big winner in an eventual housing recovery.
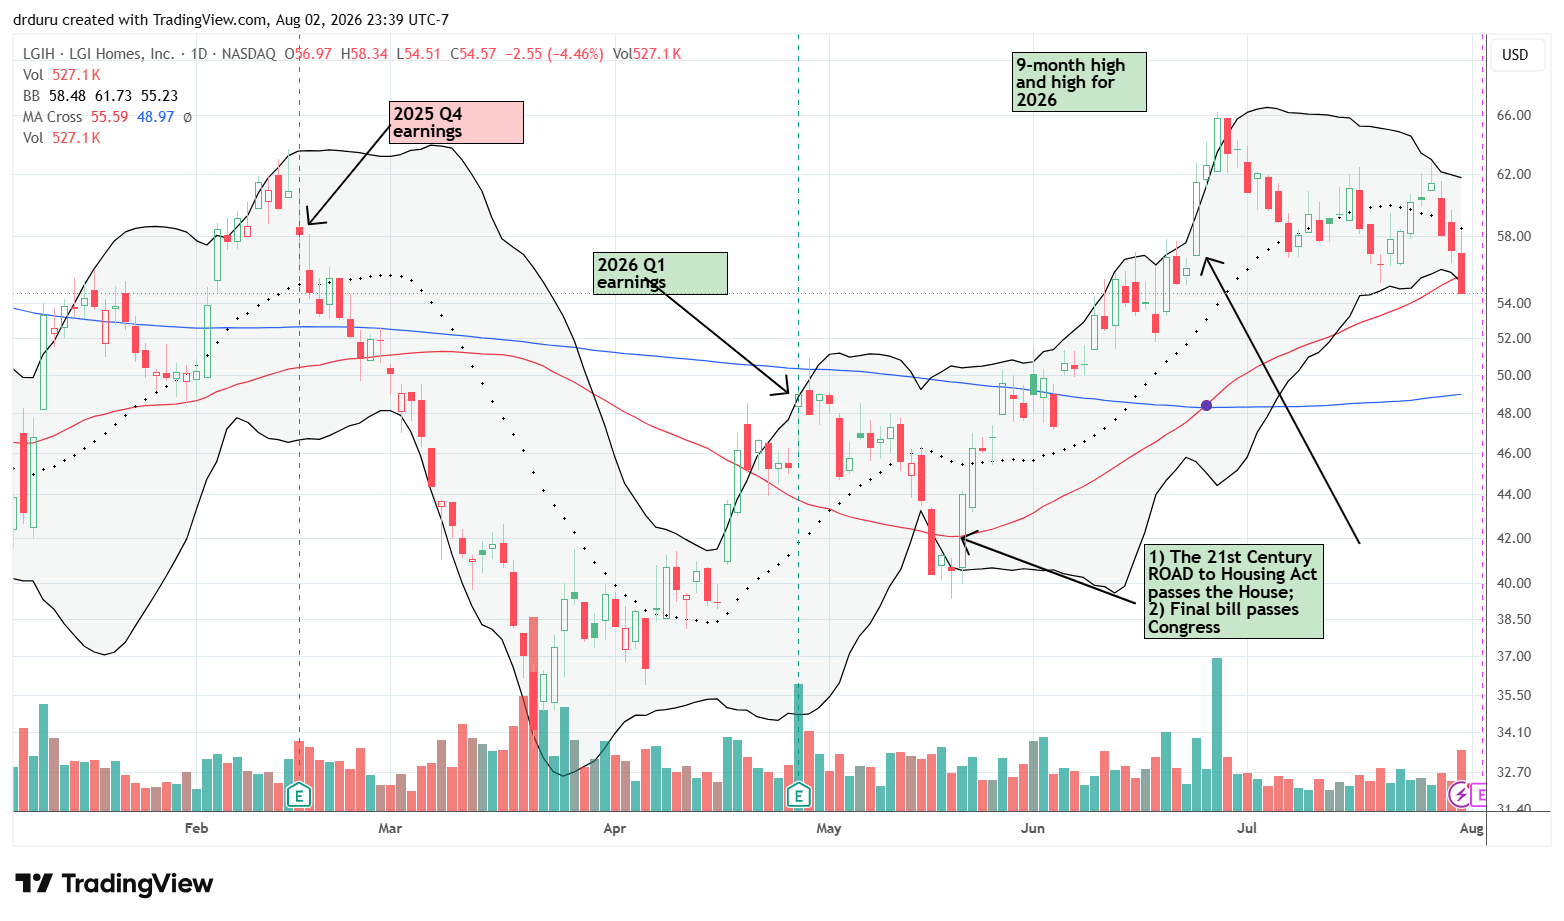
LGI Homes (LGIH) reports earnings in the coming week. In “What To Expect For Q2 Earnings For LGI Homes“, I presented a tepid case for the builder’s earnings and maintained a hold rating.
Housing Data
Home Builder Confidence: The Housing Market Index – July, 2026
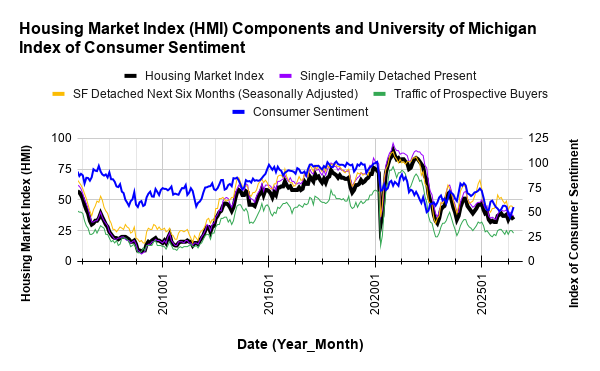
The National Association of Home Builders (NAHB)/Wells Fargo Housing Market Index (HMI) dropped 2 points from an upwardly revised 36 in June to 34 in July. At 34, the HMI is back to its low of the year. The NAHB noted that “Sentiment has remained below 40 for 15 consecutive months, the longest such stretch since 2012.” Thus, the main message in sentiment is a persistent lack of enthusiasm and ongoing wariness about the familiar cocktail of concerns: “elevated mortgage rates, costly land, rising material prices, and persistent skilled labor shortages” as stated by the NAHB. While the NAHB applauds the 21st Century ROAD to Housing Act, the organization still sees the need for more action in state and local governments.
Each of the HMI components fell between one and two points.
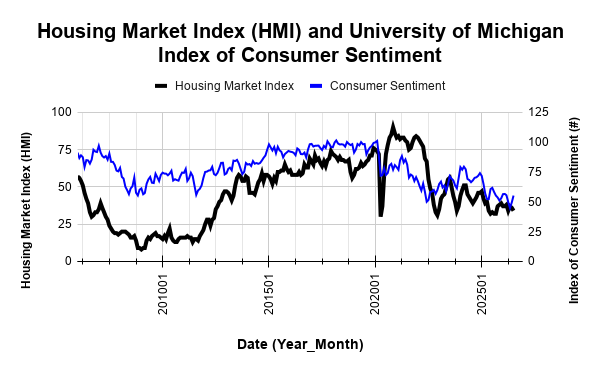
Source for data: NAHB and the University of Michigan
While consumer sentiment jumped and diverged once again from tepid builder sentiment, the trend from the past few years suggests consumer sentiment will reconverge with builder sentiment to the downside.
The dynamics of price incentives were decidedly negative for builders in July, reflecting the drop in sentiment. The share of builders cutting prices increased from 35% in June to 37% in July (the percentage was 32% in May). The average price reduction remained at 6%. The use of sales incentives was 63% in July, up from 62% in June, and extending the streak at or above 60% to 16 straight months.
While the overall HMI sank back to its low for the year, the regional breakdown was mixed. After hitting a high for the year in June at 50, the Northeast HMI plunged to 41, just 2 points above its low for the year. The Midwest HMI increased from 45 to 46, a new high for the year. The South HMI stayed flat at its low for the year of 31. The West slipped 2 points to 25 and a new low for the year.
New Residential Construction (Single-Family Housing Starts) – June, 2026
Single-family housing starts were essentially unchanged. June’s 895K in single-family starts represents a 0.2% month-over-month decrease and a 3.2% year-over-year decrease.
![US. Bureau of the Census, Privately Owned Housing Starts: 1-Unit Structures [HOUST1F], first retrieved from FRED, Federal Reserve Bank of St. Louis, July 27, 2026](https://drduru.com/onetwentytwo/wp-content/uploads/2026/07/20260727_Housing-Starts-June-2026.png "Housing starts")
While builders held the pace of starts essentially steady, permits remain around 3-year lows. Building permits (new privately-owned housing units authorized in permit-issuing places) have stalled out since June, 2025. Permits were 871K, a 2.4% month-over-month decrease from May and a 0.2% year-over-year decrease. The sluggish activity in permits suggests starts will continue to remain in a range for quite some time to come.
Starts were mixed across regions. Month-over-month the changes were -6.6%, -10.1%, -1.5%, and +13.1% for the Northeast, Midwest, South, and West respectively. Year-over-year the changes were less mixed at -5.0%, -24.7%, +1.9%, and +0.5% for the Northeast, Midwest, South, and West respectively.
New Residential Sales (Single-Family) – June, 2026
New home sales increased in June. Sales rose 1.6% from May’s sales of 618K to 628K in June. Year-over-year sales declined 5.6%. The modest sequential increase in the market for new homes still leaves sales near the pandemic low and precariously close to the lows from the 2022 trough.
The NAHB focused on the year-over-year decline when lamenting “affordability challenges continued to weigh on the new-home market.” These affordability issues have of course been an ongoing theme. The Midwest is the only region with a year-over-year gain in sales year-to-date.
![US. Bureau of the Census, New One Family Houses Sold: United States [HSN1F], first retrieved from FRED, Federal Reserve Bank of St. Louis, July 27, 2026](https://drduru.com/onetwentytwo/wp-content/uploads/2026/07/20260727_New-home-sales-June-2026.png "new home sales")
For June, the median price for new homes decreased 3.3% sequentially and decreased 2.7% year-over-year to $398,300. As is often the case, the decrease in prices coincided with a shift in the sales mix.
Sales of homes priced over $1M decreased from 7% to 5% of sales. The lowest price tier, under $300,000, experienced a surprising surge in share from 18% in May to 23% in June, a high for the last 13 months, matching September’s 23% share. A year ago, the share was only 16%, its lowest level over the last 12 months. The $400,000 to $499,999 tier dropped from 22% to 19% of sales. Still, on a year-over-year basis, the $300,000 to $599,999 range in aggregate is unchanged at a 61% share.
May’s inventory was 9.4 months of sales. June’s inventory decreased to 9.3 months of sales compared to 9.0 months a year ago. Absolute inventory decreased from 486K to 485K. Note well that inventory decreased as sales increased modestly month-over-month.
The Northeast, Midwest, South, and the West changed +16.0%, -1.2%, -1.4%, -24.6% respectively year-over-year. Sequentially, the Northeast, Midwest, South, and the West changed +3.6%, +2.5%, +9.9%, -22.4% respectively. The wide swings and variety in regional changes continue to align with the high degree of uncertainty in the aggregate estimate.
Existing Home Sales – June, 2026
Affordability might as well be the post-pandemic mascot for the housing market. The challenges in buying a home permeate the data and almost all commentary. According to National Association of Realtors (NAR) Chief Economist Lawrence Yun, “The back-and-forth in monthly home sales activity, driven by mild fluctuations in mortgage rates, shows how sensitive home buyers are to affordability conditions.”
Existing home sales declined in June. NAR reported a 2.4% month-over-month decrease to 4.09M sales and a 2.8% increase year-over-year.
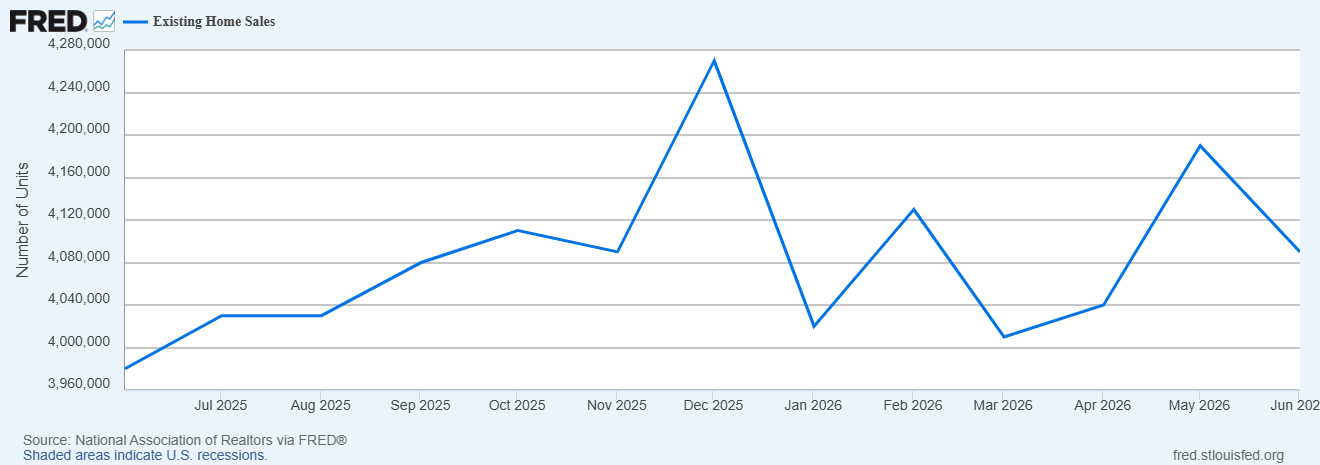
(For historical data from 1999 to 2014, click here. For historical data from 2014 to 2018, click here) Source for chart: National Association of Realtors, Existing Home Sales© [EXHOSLUSM495S], retrieved from FRED, Federal Reserve Bank of St. Louis, July 10, 2026

{Condo and co-op sales declined 2.7% month-over-month and 2.7% year-over-year, while the median price increased 1.6% year-over-year to $380,000.}
The organization linked the decline to mild fluctuations in mortgage rates and homebuyer sensitivity to affordability conditions. At an aggregate level, the NAR’s Housing Affordability Index improved from 95.5 to 102.3. Each region also experienced healthy gains in year-over-year affordability: Northeast +4.5%, Midwest +6.2%, South +8.3%, West +8.9%. With mortgage rates higher and home prices as a new record, only strong wage growth drove affordability gains. The NAR warned that ongoing inventory constraints threaten further progress in affordability.
Total housing inventory in June was 1.56M units, down 0.6% from May and up 1.3% from June 2025. The NAR reported a 4.6-month supply of unsold inventory, up from 4.5 months last month and unchanged from 4.6 months one year ago.
The median sales price of an existing home was $440,600 in June, up 1.8% from one year ago ($432,700) to a new record. June marked the 36th consecutive month of year-over-year price increases.
The REALTORS® Confidence Index showed a median time on market of 28 days in June, down from 29 days in May and up from 27 days in June 2025.
The NAR also reported that first-time homebuyers represented 33% of sales (down from 35% in May and up from 30% one year ago).
There were no regional negative changes in year-over-year sales. The regional year-over-year changes were: Northeast unchanged, Midwest +2.1%, South +3.8%, West +2.8%.
Single-family existing home sales decreased 2.4% month-over-month in June to a seasonally adjusted annual rate of 3.73M and increased 3.3% year-over-year. The median price of a single-family home was $446,400, an increase of 1.8% from a year ago
California Existing Single-Family Home Sales – June, 2026
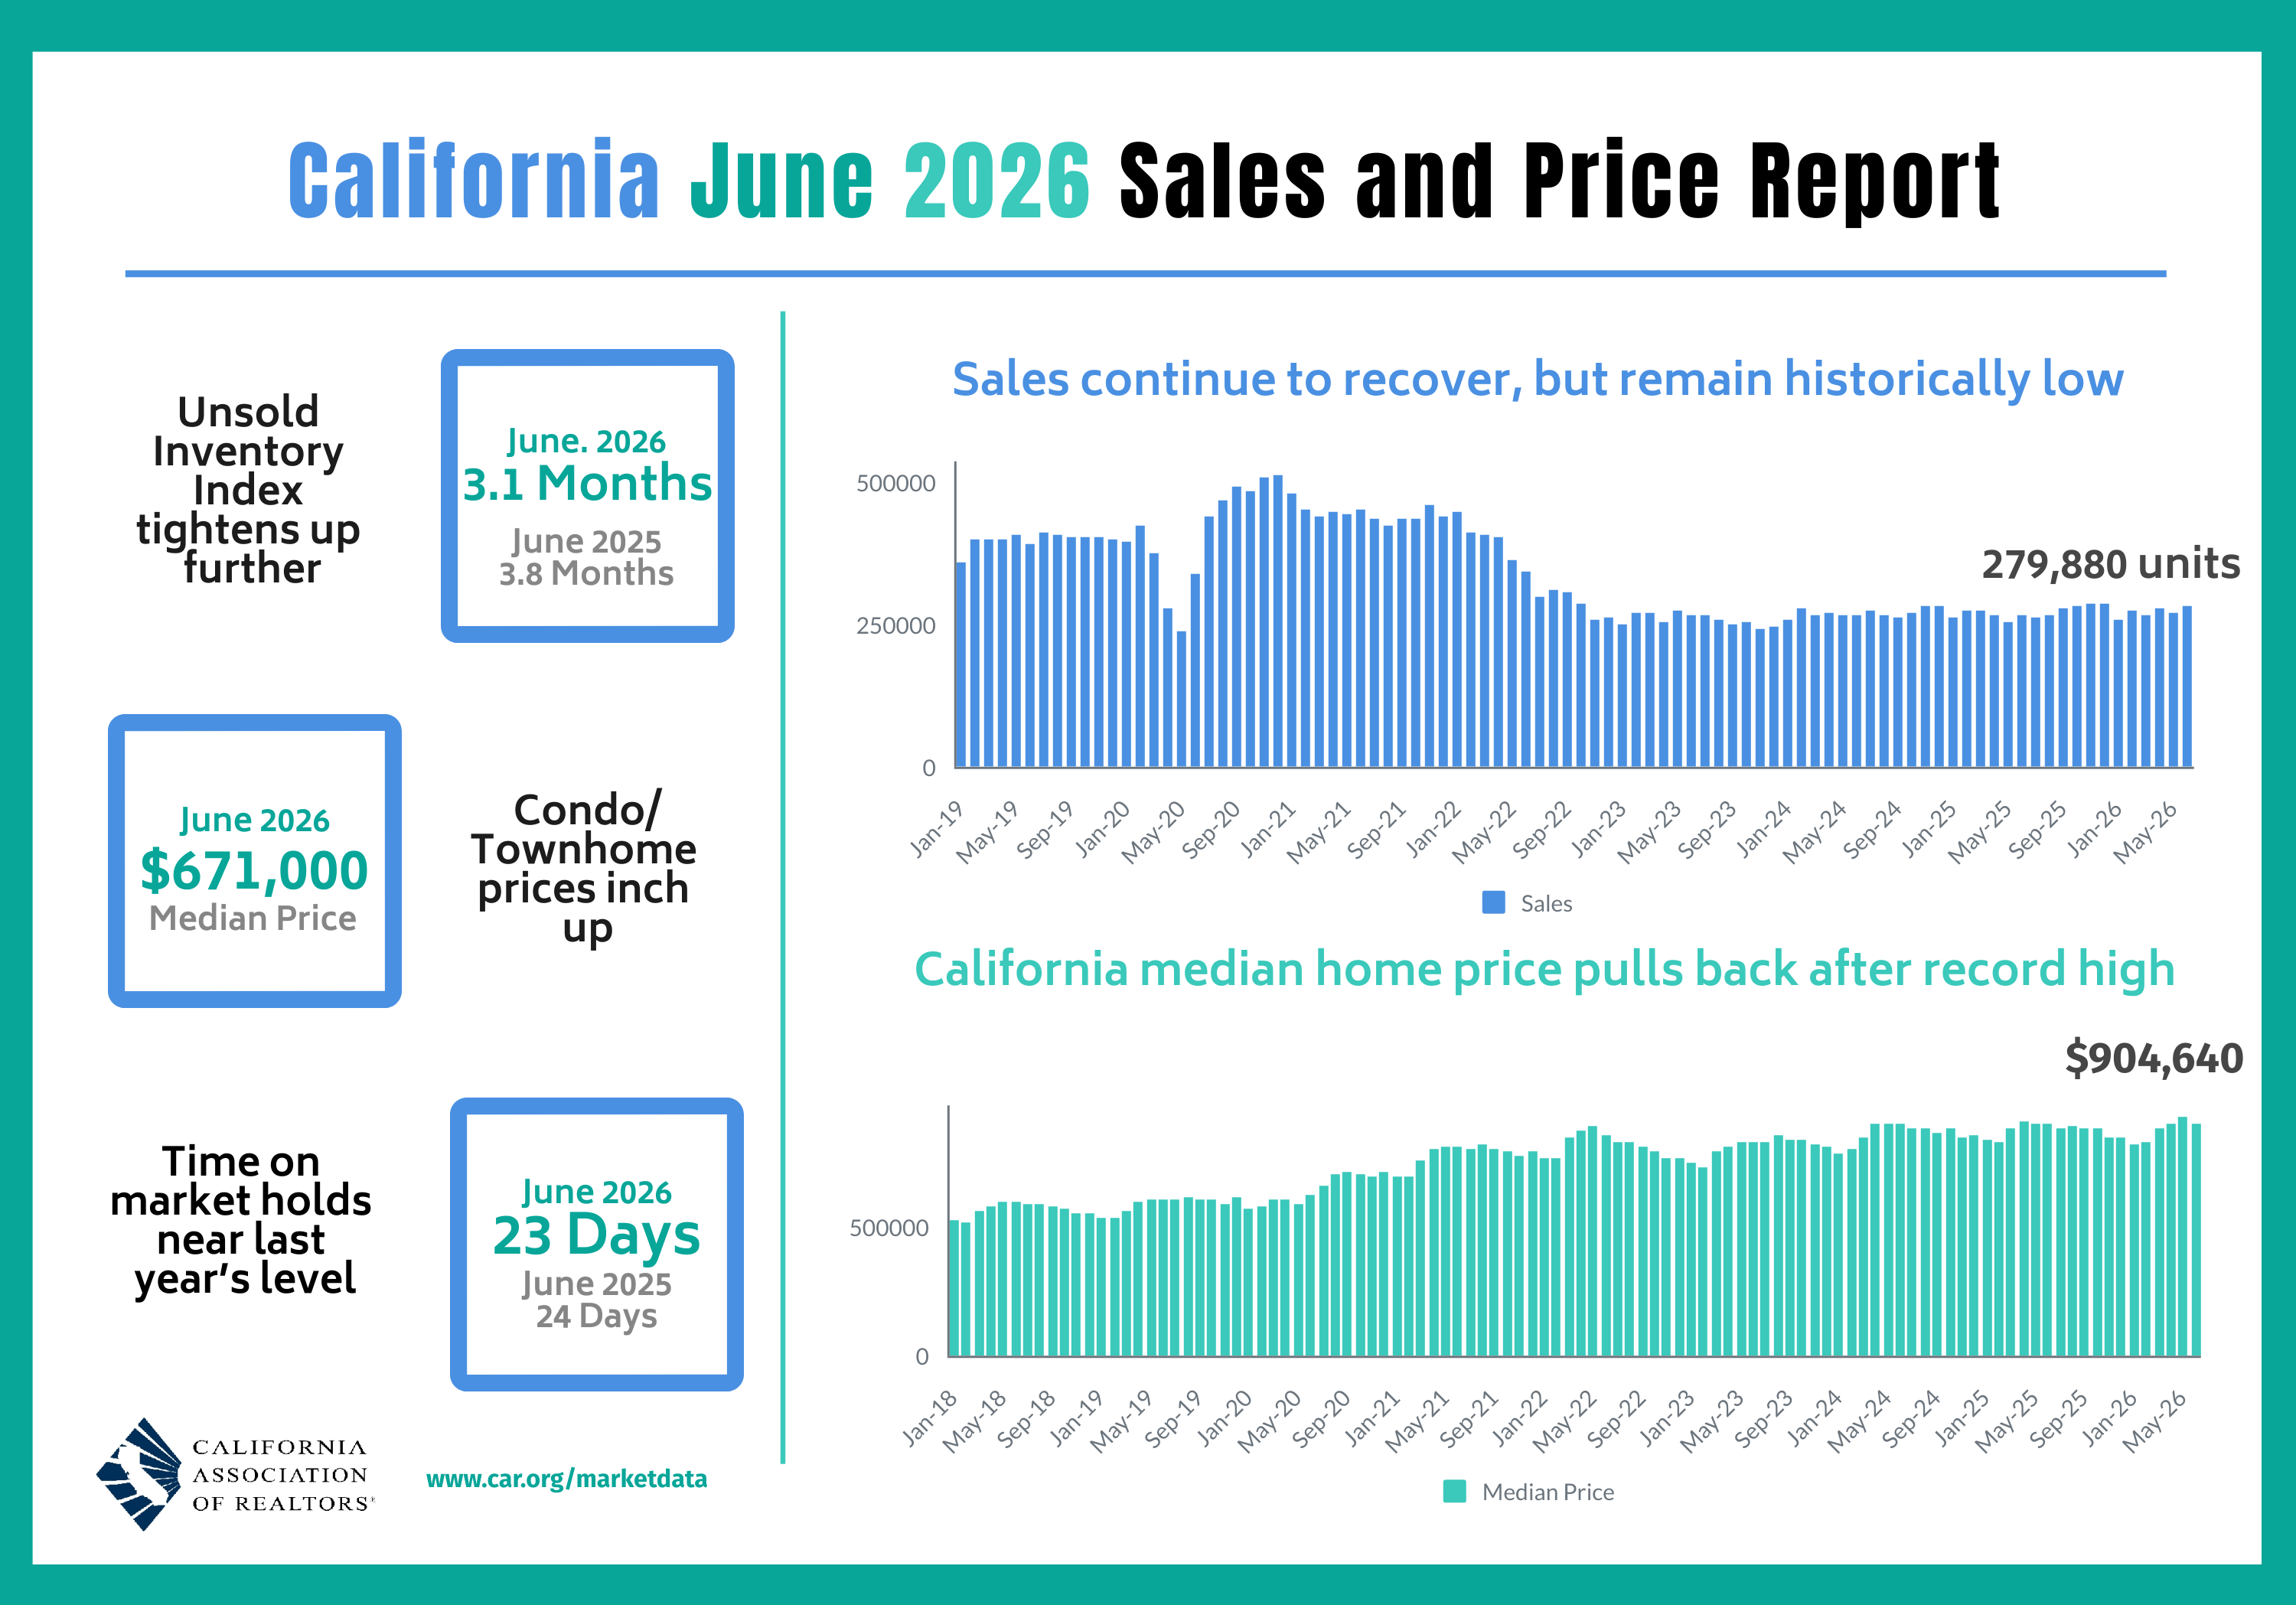
California existing home sales rebounded in June. The California Association of Realtors (C.A.R.) reported that existing single-family home sales increased sequentially 4.1% in June to 279,880, up 6.0% year-over-year. The C.A.R. noted that the largest sales increases happened for entry-level and mid-tier homes — similar to the national shift — while higher-priced home sales declined for a second straight month. Sales of homes valued above $1M declined from a record 38.5% share in May to 36.9% in June. The organization attributed support for the broader sales gains to buyers adapting to current interest rate conditions.
The median price decreased 2.8% month-over-month and increased 0.4% year-over-year to $904,640. This price decrease followed May’s all-time high with the shift in mix to the lower-end of the market driving the monthly decrease. On a year-over-year basis, prices are still trending higher. The median price per square foot was $439, up from $438 a year ago. Moreover, the sales-price-to-list-price ratio was 100.0% in June, up from 99.3% a year ago.
June’s unsold inventory index (UII), which measures the number of months needed to sell the supply of homes on the market at the current sales rate, declined from May and from 3.8 months in June 2025 to 3.1 months in June 2026. Total active listings rose from May 2026 but fell 10.4% year-over-year for a fifth straight month. In the June report, the C.A.R. linked constrained inventory to existing homeowners with low mortgage rates remaining reluctant to sell. However, this lock-in has been a salient feature of the housing market for around four years, and June’s mix of inventory effects shows that lock-in is not a consistent driver of inventory dynamics. The C.A.R. warned that renewed conflict in the Middle East could put upward pressure on mortgage rates and weigh on housing demand.
The median time on market declined from 24 days a year ago to 23 days.
Georgia’s Housing Market – June, 2026
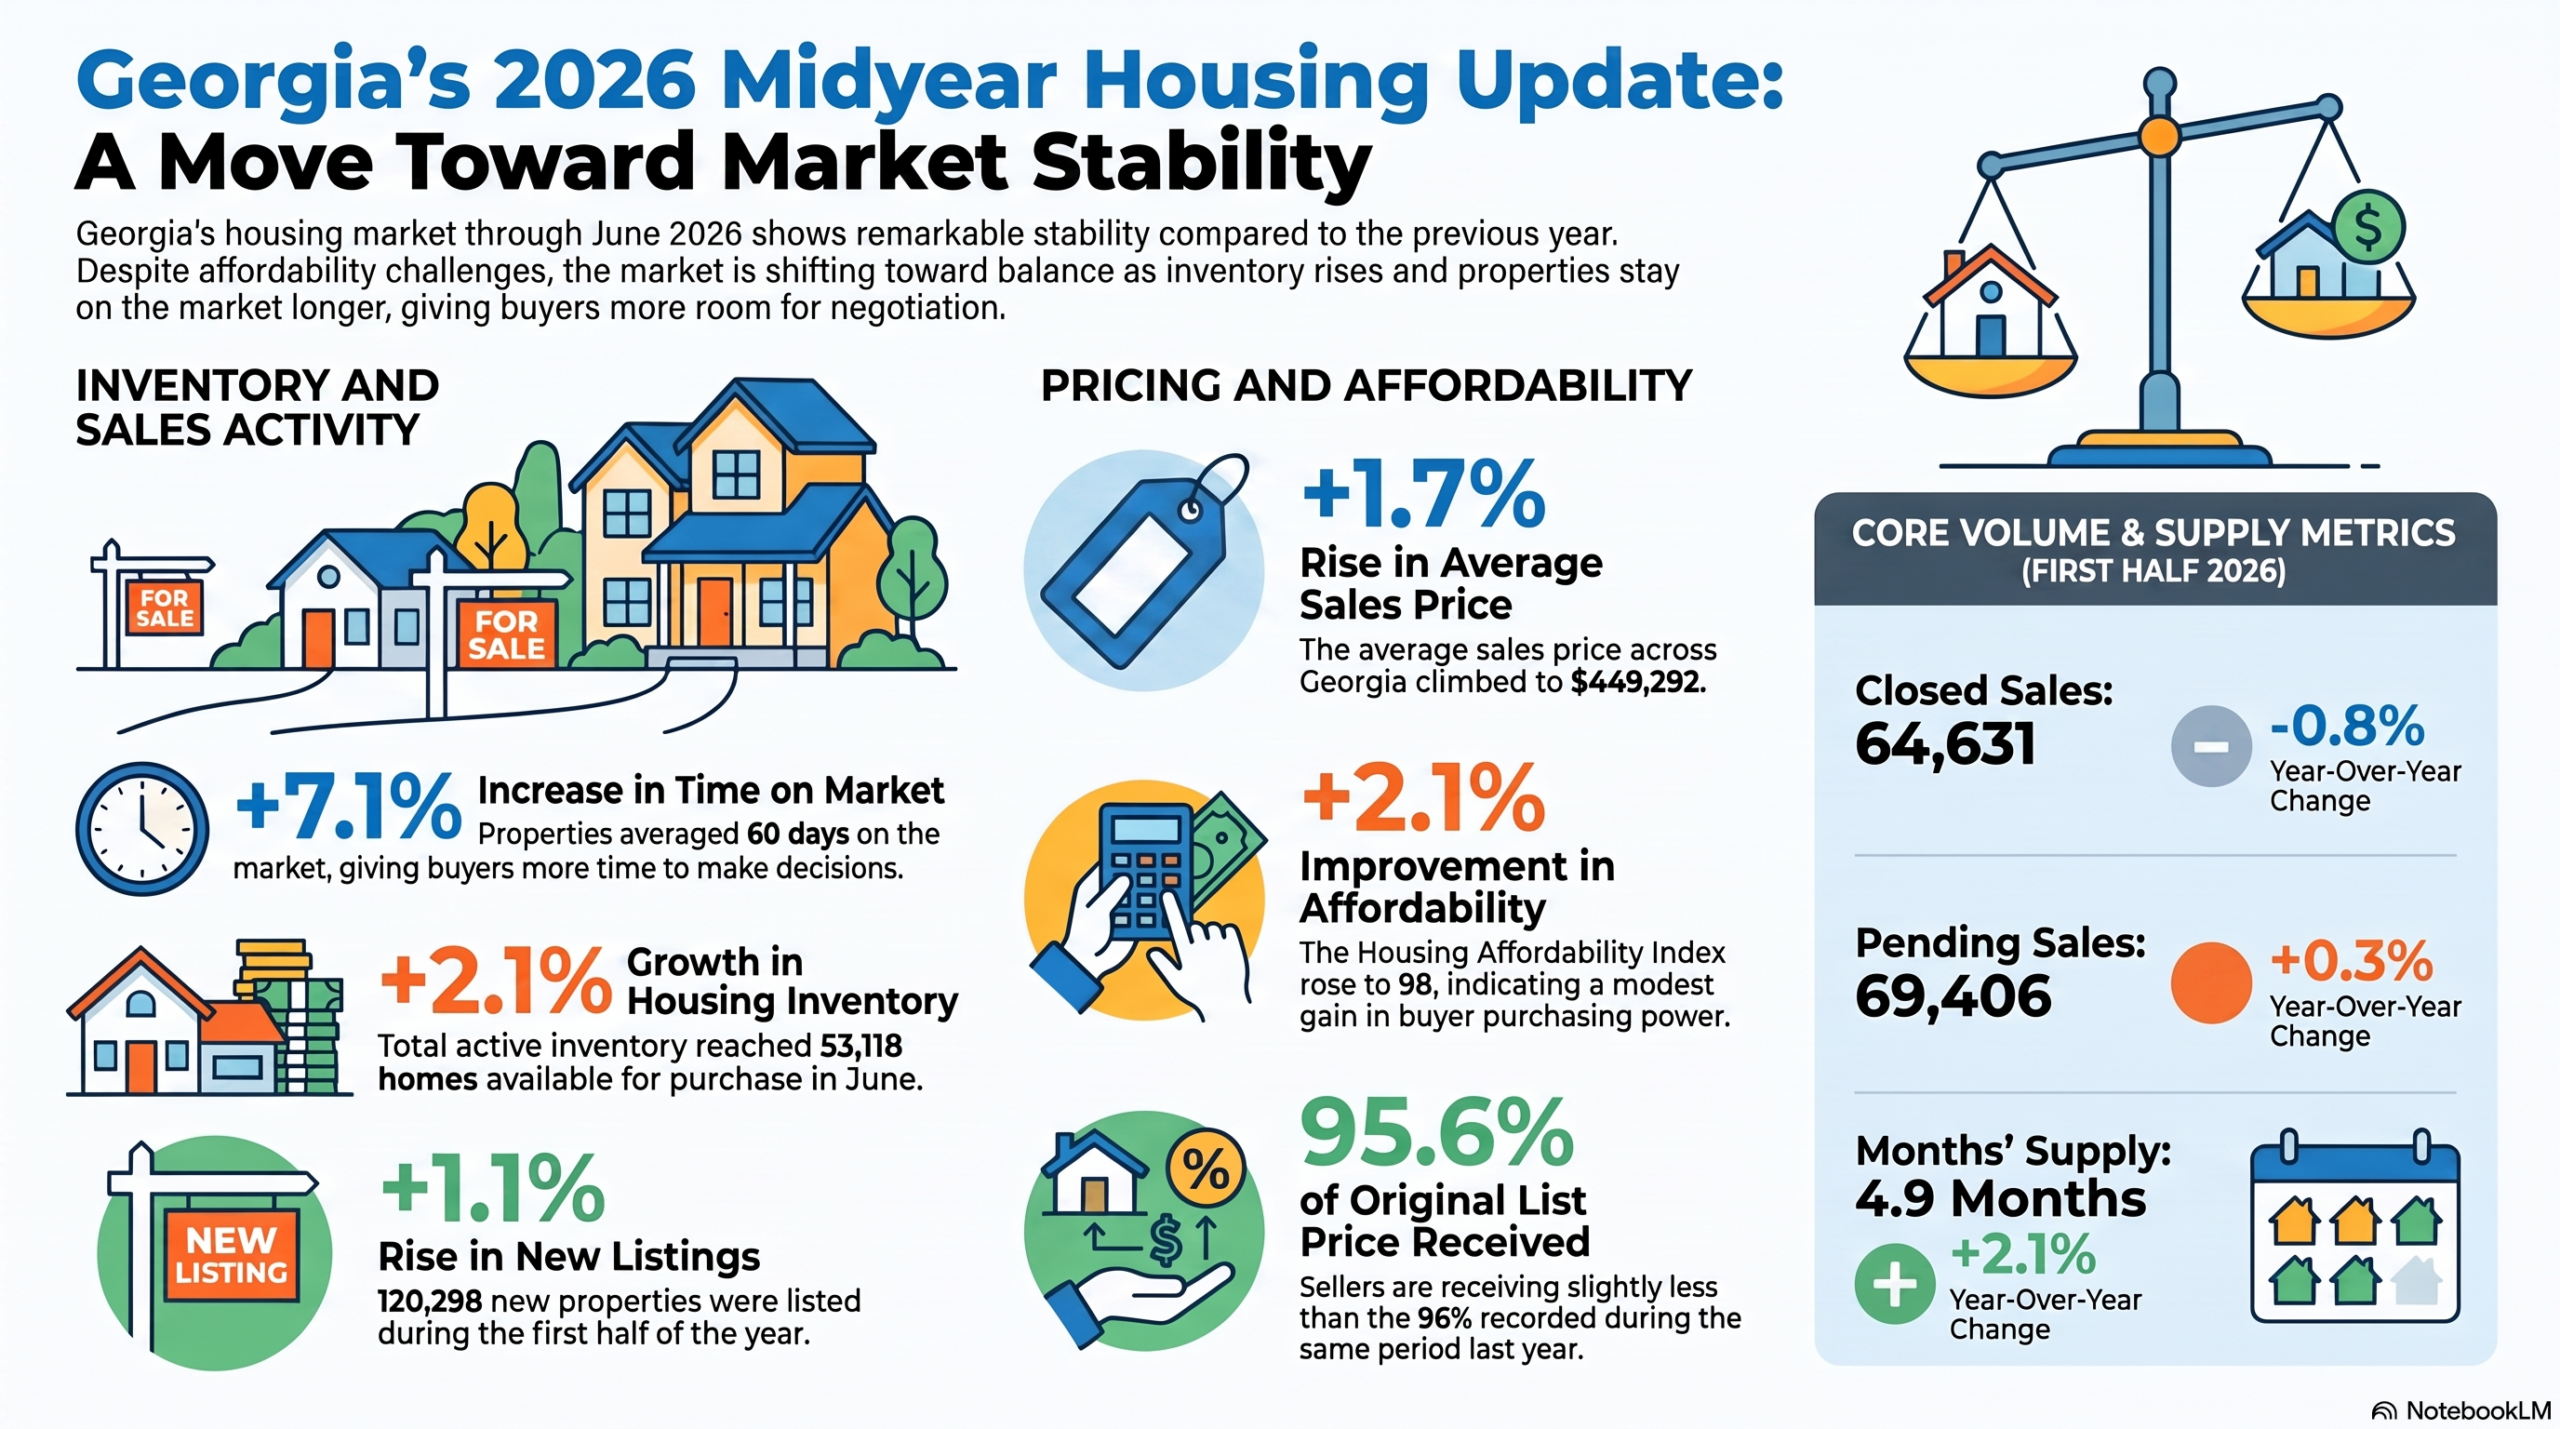
The Georgia Association of Realtors noted that despite the rise in housing inventories, overall inventory remains tight. That tightness likely helps explain the ongoing upward pressure in prices even with slowing sales. Georgia’s market, like so many others in the U.S., has very different performance profiles in particular segments.
Home closing thoughts
Beyond the monthly data, several housing-related developments continue to shape affordability, supply, and market structure. Below are some of the more notable stories that caught my interest over the last month or so.
California Passes Housing Affordability Bill
California’s Governor Gavin Newsom signed Assembly Bill 179 which is described by the Governor as a “housing budget trailer bill, modernizing California’s affordable housing finance system to help expand homeownership, reduce costs, support more affordable housing, and strengthen the impact of state housing investments.” A key provision forces cities to lower or eliminate local impact fees on new residential housing projects in order to qualify for state funding. Of course, since these fees paid for city services, the money will have to come from somewhere, aka a new set of taxes in various communities. In the meantime, affordable housing will become more financially feasible. The next question will be whether living and maintaining the housing will be feasible without the impact fees.
Seattle’s Weakening Housing Market
Yahoo Finance recently reported on a slowing housing market in Seattle. Regional layoffs in tech combined with robust home building have increased inventory. Yahoo called Seattle one of the weakest markets in the country, but the median price of a home is down only 1.8% year-over-year as of May. Inventory is up “double-digits percentages” and sales have declined 6.4%.
Spotlight on Mortgage Rates
The Mortgage Bankers Association (MBA) reported three weeks with a decrease in mortgage applications and two weekly decreases for the month of July. For all of June, new home purchase mortgage applications increased 2.4% year-over-year but dropped 6% sequentially (not seasonally adjusted).
After taking a pause in June, mortgage rates slowly increased for most of July as inflationary pressure helped to drive up bond yields. The process accelerated after last week’s decision on monetary policy from the Federal Reserve. The resulting rise in mortgage rates is pressuring the stock price of home builders yet again.
![Freddie Mac, 30-Year Fixed Rate Mortgage Average in the United States [MORTGAGE30US], retrieved from FRED, Federal Reserve Bank of St. Louis; August 2, 2026.](https://drduru.com/onetwentytwo/wp-content/uploads/2026/08/20260802_30-Year-Fixed-Rate-Mortgage-Average.png)
Be careful out there!
Full disclosure: long ITB, long CCS, long LGIH