
Stock Market Statistics
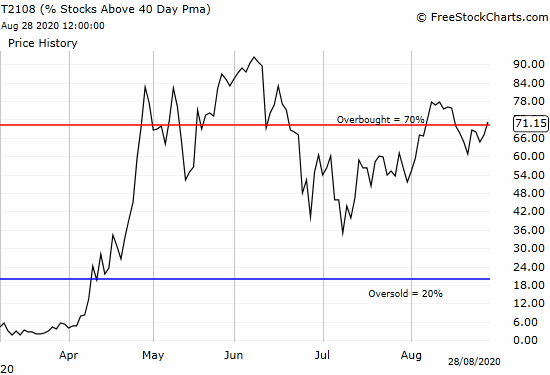
AT40 = 71.2% of stocks are trading above their respective 40-day moving averages (DMAs) (ended 7 overbought trading days)
AT200 = 46.5% of stocks are trading above their respective 200DMAs
VIX = 23.0
Short-term Trading Call: cautiously bearish
Stock Market Commentary
Last week was not a good time to be sitting on the sidelines of the stock market cloaked in bearishness.
When I saw the convincing signs of a bearish divergence in the stock market the previous week, I decided against an “easy” downgrade from cautiously bullish to neutral. While bullish trades still abound in the market, the remaining runway looks shorter and shorter for this moment of sky high valuations, soaring prices, and relentless momentum and speculation. Therefore, I prefer to get mentally and positionally ready for a pullback rather than attempt to time an exact top.
The week ended with AT40 (T2108), the percentage of stocks trading above their respective 40-day moving averages (DMAs), closing above the 70% threshold for overbought conditions. Along the way to overbought conditions, another bearish divergence flashed on Wednesday, the day before the start of the Jackson Hole confab with the globe’s major central bankers. The trading conditions were very similar to the previous Friday’s bearish divergence: the S&P 500 and the NASDAQ printed healthy gains, 0.6% and 0.6% respectively, yet small caps and financials closed in the red, AT40 closed down on the day (and fell short of the overbought threshold), and decliners well outpaced advancers. As a result, this latest ride into overbought conditions appears to have weak foundations.
Yet, the Federal Reserve looms large as ever over the trading action. I had a good chuckle at the latest claims from the Fed that it is not creating an asset bubble with its extremely accommodative monetary policies. The Fed has consistently shown itself reluctant to call out asset bubbles. Indeed, the Fed by rule is paralyzed against acting against bubbles, so by extension it cannot label a bubble in real time. For example, Federal Governor Frederic S. Mishkin gave an important speech on this topic on May 15, 2008…ironically enough, just ahead of the near collapse of global financial markets after a massive housing bubble:
“Central banks or government officials are unlikely to have an informational advantage over market participants. If a central bank were able to identify bubbles in the stock market, wouldn’t market participants be able to do so as well? If so, then a bubble would be unlikely to develop, because market participants would know that prices were getting out of line with fundamentals.”
This reminds me of the classic joke about the economist’s view of market efficiency. Two economists stroll down the street and one of them sees a $20 bill sitting on the sidewalk. The other economist insists that the $20 bill cannot be real because someone would have picked up the money already.
Mishkin goes on to caution the Federal Reserve away from trying to directly address bubbles (emphasis mine):
“To be clear, I think that in most cases, monetary policy should not respond to asset prices per se, but rather to changes in the outlook for inflation and aggregate demand resulting from asset price movements. This point of view implies that actions, such as attempting to ‘prick’ an asset price bubble, should be avoided.”
Since soaring stock prices can easily disconnect from the real economy and produce little, a stock market bubble can and will bypass the mechanisms that generate the inflation the Fed watches. The Fed can remain blithely on the sidelines as stocks go to whatever price market participants choose.
Here is how Mishkin explains his caution:
“I take this view for (at least) three important reasons.10 First, asset price bubbles can be hard to identify. As a result, tightening monetary policy to restrain a bubble that has been misidentified can lead to weaker economic growth than is warranted. In addition, central bank actions to influence asset prices when the central bank is uncertain about the presence or extent of a bubble can interfere with the role of asset prices in allocating resources.11
Second, even if asset price bubbles could be identified, the effect of interest rates on asset price bubbles is highly uncertain. Although some theoretical models suggest that raising interest rates can diminish the acceleration of asset prices, raising interest rates may be very ineffective in restraining the bubble, because market participants expect such high rates of return from buying bubble-driven assets.12 Other research and historical examples (which I will discuss later) have suggested that raising interest rates may cause a bubble to burst more severely, thereby increasing the damage to the economy.13 Another way of saying this is that bubbles are departures from normal behavior, and it is unrealistic to expect that the usual tools of monetary policy will be effective in abnormal conditions. The bottom line is that we do not know the effects of monetary policy actions on asset price bubbles.
Third, there are many asset prices, and at any one time a bubble may be present in only a fraction of assets. Monetary policy actions are a very blunt instrument in such a case, as such actions would be likely to affect asset prices in general, rather than solely those in a bubble.”
Ironically, the Fed sure appears quick to respond to a plunge in asset prices. Thus, the Fed gets the nickname the “Plunge Protection Team” (PPT).
The Stock Market Indices
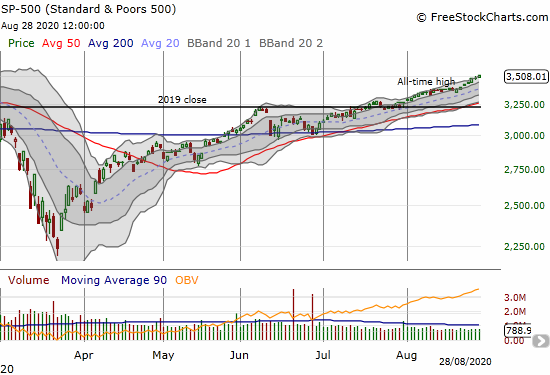
The S&P 500 (SPY) is on a steady run-up. The index is on a 7-day winning streak and even managed to close the week above its upper Bollinger Band (BB).
The NASDAQ (COMPQX) is also streaking albeit with a few minor interruptions.

The major indices, and particularly the small range of stocks powering them higher, are reaching and reaching for higher prices. The higher they go, I encounter more and more creative rationalizations for the price action. The stock market is in a mode where the question is not why or how but why not trade higher? Just pick a price, any price, and wait on it. This price action is both awesome and eerie to behold.
Volatility
The volatility index (VIX) woke up again last week. However, faders made a convincing statement on Friday by fading the VIX into a 6.2% loss on the day. The VIX is still holding onto a bottoming pattern this month.

The Short-Term Trading Call: Overbought
The latest overbought milestone for AT40 provided the first actionable signal for bearish trades. Per the AT40 trading strategy, a drop below the threshold for overbought conditions is a bearish event (the last drop below the threshold was a rare exception where I went into neutral instead of bearish mode). In deference to the current price action, I will wait until AT40 closes twice below the threshold before acting. A close below 60% would provide even more solid confirmation. Such a move could signal a larger pullback is unfolding.
Like the stock market, the currency markets quickly righted themselves last week. In particular, the Australian dollar versus the Japanese yen (AUD/JPY) turned around from a 20DMA breakdown. At the time of writing, AUD/JPY is toying with a new 16-month high. This indicator of risk attitudes is suggesting buyers still have plenty of enthusiasm for the price action.
Stock Chart Reviews: Video Summary
Stock Chart Reviews – Below the 50DMA
iShares Barclays 20+ Year Treasury Bond Fund (TLT)
Last week was a big moment for U.S. monetary policy. The Federal Reserve switched from targeting 2% inflation to targeting an average of 2%:
“We have also made important changes with regard to the price-stability side of our mandate. Our longer-run goal continues to be an inflation rate of 2 percent. Our statement emphasizes that our actions to achieve both sides of our dual mandate will be most effective if longer-term inflation expectations remain well anchored at 2 percent.
However, if inflation runs below 2 percent following economic downturns but never moves above 2 percent even when the economy is strong, then, over time, inflation will average less than 2 percent. Households and businesses will come to expect this result, meaning that inflation expectations would tend to move below our inflation goal and pull realized inflation down. To prevent this outcome and the adverse dynamics that could ensue, our new statement indicates that we will seek to achieve inflation that averages 2 percent over time. Therefore, following periods when inflation has been running below 2 percent, appropriate monetary policy will likely aim to achieve inflation moderately above 2 percent for some time.”
The bond market seemed to conclude quickly that the Fed will eventually succeed in driving inflation higher. Bond yields jumped a bit and iShares Barclays 20+ Year Treasury Bond Fund (TLT) dropped 1.7%. Surprisingly, gold and silver faded after opening gaps (see below). I added one more call option on TLT in anticipation of at least one more swoon higher. However, TLT’s chart looks like it is slowly but surely topping out after the violent churn of March’s parabolic action.

Stock Chart Reviews – Above the 50DMA
AMC Entertainment Holdings (AMC)
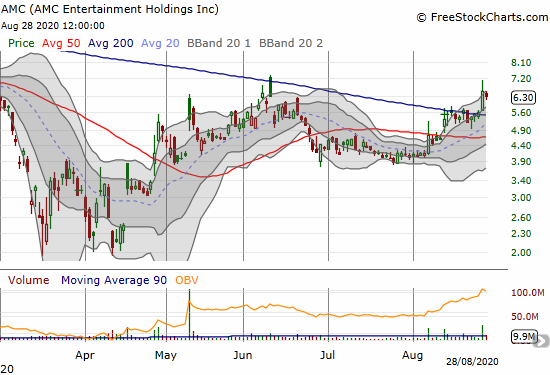
AMC Entertainment Holdings (AMC) announced an expansion of its theater re-openings. As a result, the stock market responded by sending shares higher by 16.4% after a fade from intraday highs. AMC finally closed over its June closing high and entered bullish territory. For perspective, AMC suffered a double-top between 2015 and 2016 around $36. Two years ago, AMC traded around $19.
Alibaba Group Holding (BABA)
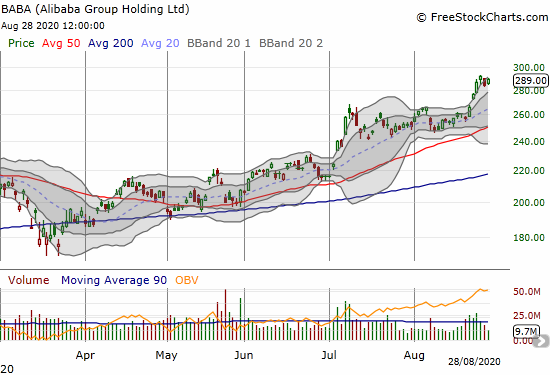
Alibaba Group Holding (BABA) gained 12% after reporting earnings on August 20th. The new all-time highs are still not enticing me to get back into Chinese stocks. Still, this run IS quite impressive!
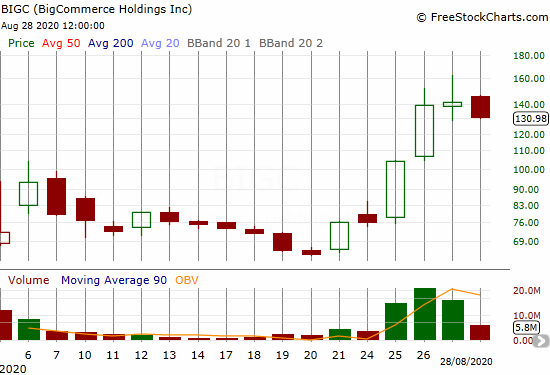
BigCommerce Holdings (BIGC)
BigCommerce Holdings (BIGC) was one of last week’s IPO flavors of the moment. The stock doubled in 5 trading days including a 37% gain that erupted on news that BIGC made its e-commerce checkout platform available on Instagram. On Friday, BIGC finally took a breather.
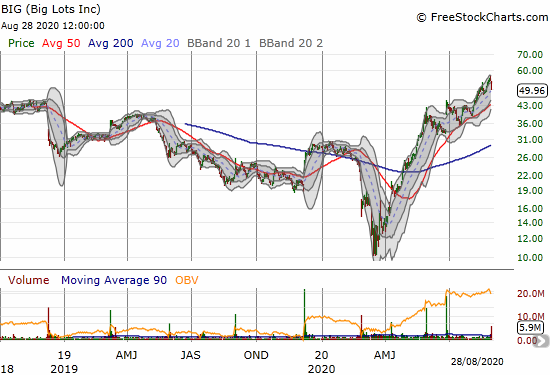
Big Lots (BIG)
Big Lots (BIG) lost 10.3% after reporting earnings. The increased five times above its March lows. A casual observer may look at this weekly chart and conclude that the pandemic was just what this company needed to revive its business. Thus, I am characterizing such a chart as a “Super-V.” BIG’s current run-up stopped short of recovering big losses that really got going March, 2018.
Booking Holdings, Inc. (BKNG)
Booking Holdings (BKNG) was a breakout special just a week ago. The bullish trading of last week delivered the follow-through as BKNG rose each day of the week. The stock filled its gap down on February 24th and closed at a 6-month high. If I decide to make a major exception to my bearish bias, BKNG will be at the top of the list!

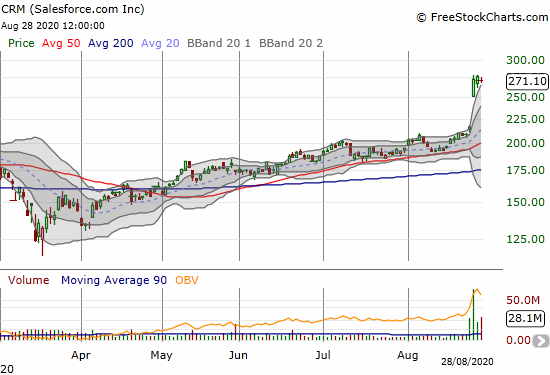
Salesforce.com (CRM)
Salesforce.com (CRM) delivered for the Dow Jones Industrial Average (DJIA). CRM soared 26% post-earnings and looks ready to keep giving. The Dow announced CRM would join its price-weighted index the day before Salesforce.com’s earnings. I still think the Dow is a useless index.
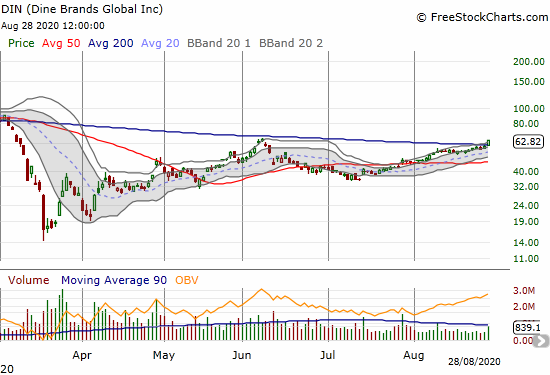
Dine Brands Global (DIN)
Like AMC, Dine Brands Global (DIN) punched through its 200DMA and matched its June high. I am fine letting this bullish breakout run as I have already traded in and out of DIN twice. DIN bottomed almost a week ahead of the S&P 500 (SPY), and I was inspired to jump into the stock after visiting iHOP around that time.
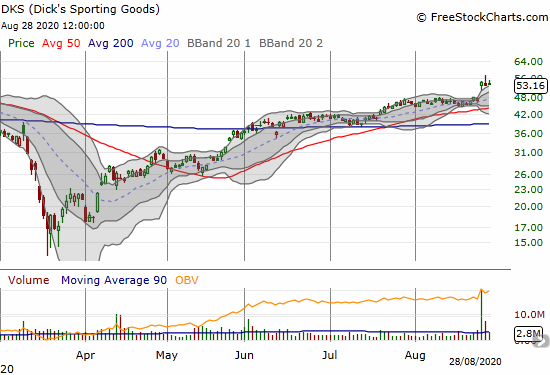
Dick’s Sporting Goods (DKS)
When Camping World (CWH) imploded post-earnings, I put myself on alert for weakness in outdoor recreation stocks. The outdoor recreation trade is apparently NOT yet over.
Dick’s Sporting Goods (DKS) printed a 3 1/2 year high after the market responded favorably to earnings. I was called away from my position the previous week. At these price levels, I am not quite as interested in my typical between earnings covered call trade.
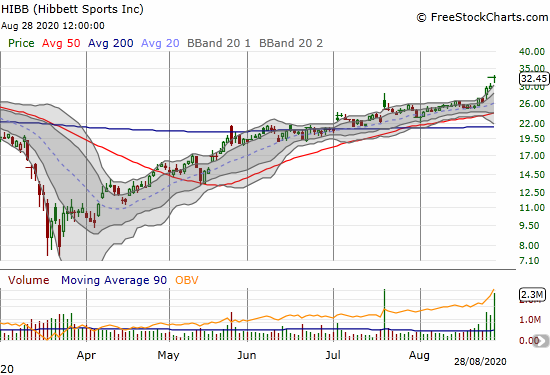
Hibbet Sports Inc. (HIBB)
Hibbet Sports Inc. (HIBB) launched higher in sympathy with DKS. HIBB was a breakout special in early July. The deal sealed on the bullish case with strong sales results on July 21st. Yet, after an opening gap, the stock faded and churned for another month. Follow-through selling in CWH prompted me to take profits in HIBB. I guess CWH’s issues are company-specific…
First Solar (FSLR)
First Solar (FSLR) has been a surprising winner during this pandemic. Energy consumption plunged alongside economic activity, so solar energy should look like an expensive luxury right now. Instead, FSLR is up 167% since the March lows. The stock closed the week at a 9-year high. The current buying momentum is riding a strong earnings report earlier in August. This bullish move warrants long-term thinking. I will finally return to the solar space this week with a covered call position selling the December $85 call. The short call will partially brace the position for a near-term pullback. Of course, FSLR will be at the top of my buy list during a return to oversold trading conditions….whenever that happens again!

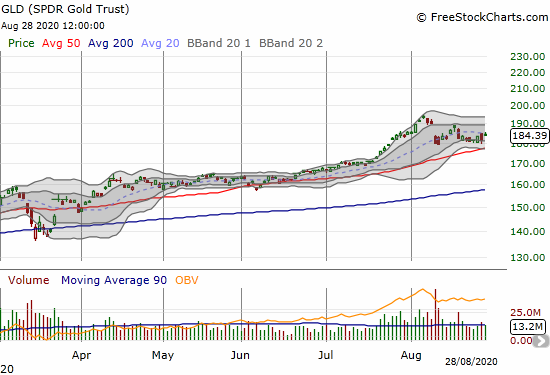
SPDR Gold Trust (GLD)
With the Fed confirming a higher tolerance for higher inflation, I am focused on commodities and related anti-dollar trades like never before. The U.S. appears set to try to inflate away its stratospheric debts. I failed to add to my GLD call position on Thursday’s intraday pullback. Still, going forward I will be more aggressive on trading around my core GLD position.
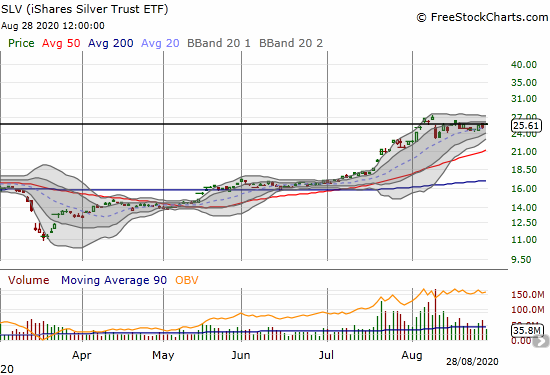
iShares Silver Trust ETF (SLV)
The iShares Silver Trust ETF (SLV) is another attractive anti-dollar bet. Like GLD, I am now following an aggressive buy-the-dip strategy on SLV call options.
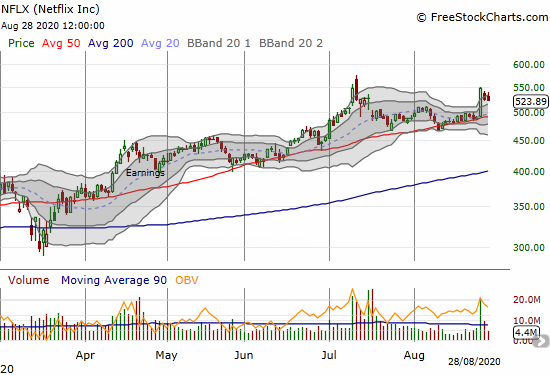
Netflix (NFLX)
Netflix (NFLX) was a major beneficiary of a rush into big cap tech stocks that created the bearish divergence a day ahead of Jackson Hole. Out of nowhere, the stock bolted 11.6% higher and almost set a new all-time high.
I got caught betting on a 50DMA breakdown with a September $450/$400 put spread.
Nutanix (NTNX)
I made the case for buying Nutanix (NTNX) a month ago. A take-over has yet to happen, but NTNX benefited from an early earnings release and news that Bain Capital Private Equity made a major investment in the company. The stock soared 29.2% on the day. Surprisingly, the stock gapped open well below its after and pre-market highs and then proceeded to surge higher all day.
While I took profits on my latest call options, I do think NTNX is a stock to buy on the dips with a clear stop below the 200DMA.

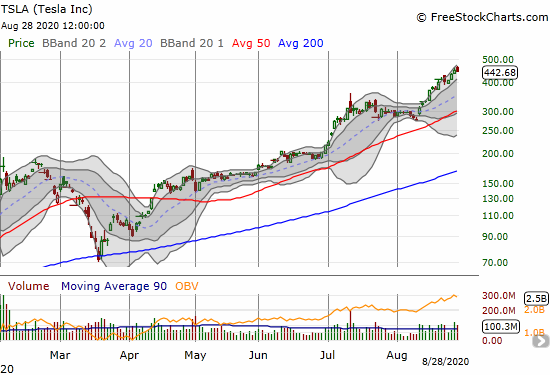
Tesla (TSLA)
Tesla (TSLA) is printing money almost as well as the Federal Reserve. The company announced a 5-to-1 stock split just as the stock seemed ready to test 50DMA support. Over the next two weeks, TSLA only experienced two days of minimal losses; the second day was just the close of trading ahead of the split. That split news delivered a 61% gain for TSLA….and counting.
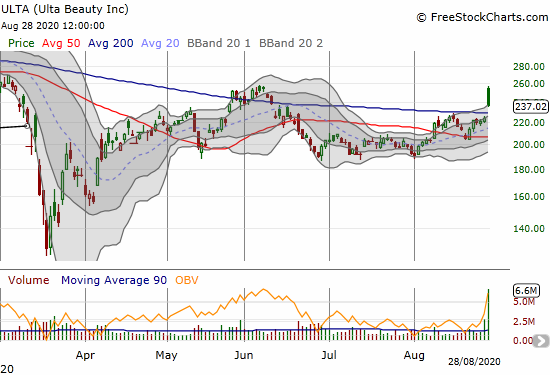
Ulta Beauty (ULTA)
Ulta Beauty (ULTA) broke out post-earnings but sellers faded the stock for the rest of the day. During bullish times, ULTA is a buy here with a stop below the 200DMA.
Stock Chart Spotlight – Bearish Breakdown
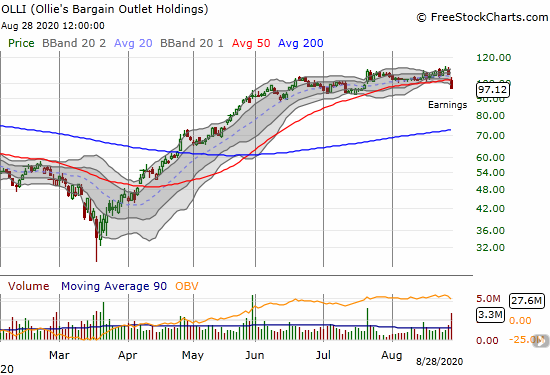
Ollie’s Bargain Outlet Holdings (OLLI)
Investors and traders slammed Ollie’s Bargain Outlet Holdings (OLLI) after the company reported earnings. I jumped into the fray with an October $85/80 put spread. I gave the trade a lot of time because I expect “bargain hunters” to toy with the stock before it follows through on downward momentum.
Stock Chart Spotlight – Bullish Breakout
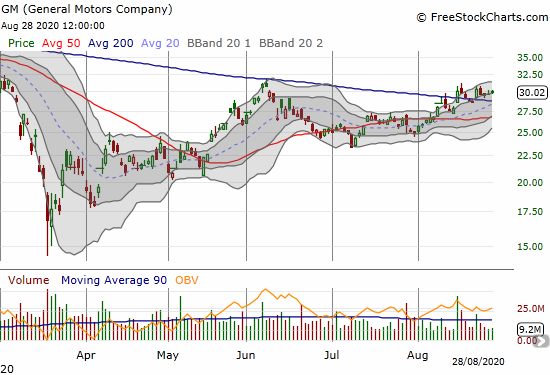
General Motors (GM)
General Motors (GM) is a highlight just because so few opportunities exist to say anything good about the stocks of traditional automakers. GM first printed a 200DMA breakout on August 17th, reversed the breakout, and then popped again. Sellers stepped in yet again, but this time they were not able to reverse the entire breakout. As a result, GM’s support at its 200DMA looks more solid. Still, it needs to close above the June high to truly get into the “clear.”
Post Dedication
REST IN PEACE, Chadwick Boseman! You left us too soon! This post is dedicated to the inspiration, education, and entertainment you delivered to millions.
— – —
FOLLOW Dr. Duru’s commentary on financial markets via email, StockTwits, Twitter, and even Instagram!
“Above the 40” uses the percentage of stocks trading above their respective 40-day moving averages (DMAs) to assess the technical health of the stock market and to identify extremes in market sentiment that are likely to reverse. Abbreviated as AT40, Above the 40 is an alternative label for “T2108” which was created by Worden. Learn more about T2108 on my T2108 Resource Page. AT200, or T2107, measures the percentage of stocks trading above their respective 200DMAs.
Active AT40 (T2108) periods: Day #97 over 20%, Day #91 over 30%, Day #36 over 40%, Day #32 over 50%, Day #18 over 60%, Day #1 over 70% (overbought conditions ending 8 days under 70%)
Daily AT40 (T2108)
")
Black line: AT40 (T2108) (% measured on the right)
Red line: Overbought threshold (70%); Blue line: Oversold threshold (20%)
Weekly AT40 (T2108)

*All charts created using FreeStockCharts unless otherwise stated
The T2108 charts above are my LATEST updates independent of the date of this given AT40 post. For my latest AT40 post click here.
Be careful out there!
Full disclosure: long UVXY shares, short AUD/JPY, long OLLI put spread, long TSLA call and put spreads, long GLD shares and calls, long SLV shares and calls, long NFLX put spread
*Charting notes: FreeStockCharts stock prices are not adjusted for dividends. TradingView.com charts for currencies use Tokyo time as the start of the forex trading day. FreeStockCharts currency charts are based on Eastern U.S. time to define the trading day.
1 thought on “An Overbought Stock Market Celebrates New Fed Inflation Policy – Above the 40 (August 28, 2020)”