
The Australian dollar (FXA) tends to be correlated with the S&P 500 (SPY). The Japanese yen (FXY) tends to be inversely correlated with the S&P 500 (SPY). The exceptions to these relationships are notable because the inevitable return to these relationships usually present unique trading opportunities. The drivers of these relationships are related to trader behaviors when flipping from “risk on” to “risk off” with long the Australian dollar representing risk-seeking dynamics and long the Japanese yen representing risk-avoiding dynamics (aka “safety” trades). Together, these currencies form AUD/JPY which serves as a good confirmation or rejection of the stock market’s bullishness or bearishness, especially at extremes.
The relationships can come with lags, backward or forward, that are sometimes hard for the casual observer to appreciate until after the fact. For example, a week after the S&P 500 (SPY) made its climactic low on December 24, 2018, AUD/JPY experienced a flash crash. The S&P 500 also sold off that day, but the more important dynamic was that as AUD/JPY bounced back sharply it helped to confirm the bottom for the S&P 500. This combination demonstrated once again why the Australian dollar and the Japanese yen matter for stock traders.
Breakout for AUD/JPY
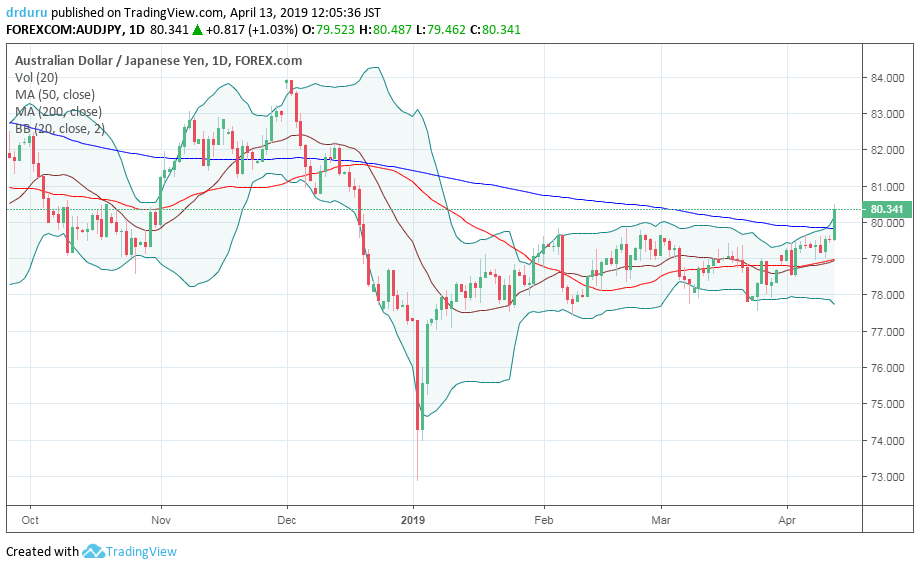
Source: TradingView
Last week ended with AUD/JPY making a very important 200DMA breakout. Pending confirmation, this move helps to support the S&P 500’s steady rise. Before this breakout, AUD/JPY “reluctantly” confirmed the rebound of the S&P 500 by maintaining a firm trading range. Still, these months demonstrated once again why the Australian dollar and the Japanese yen matter for stock traders. This breakout also pushed me a little closer to ending my now month-long short-term bearish trading call. I will provide more details in my next “Above the 40” post.
Important Test for SPY vs AUD/JPY
The ratio of SPY divided by AUD/JPY provides another way to assess these trading dynamics. This ratio is back to its last peak in September when the S&P 500 made its last all-time high. I will assume bullish implications for a breakout to new highs. Currently, SPY / AUD/JPY is “shying away” from that high.
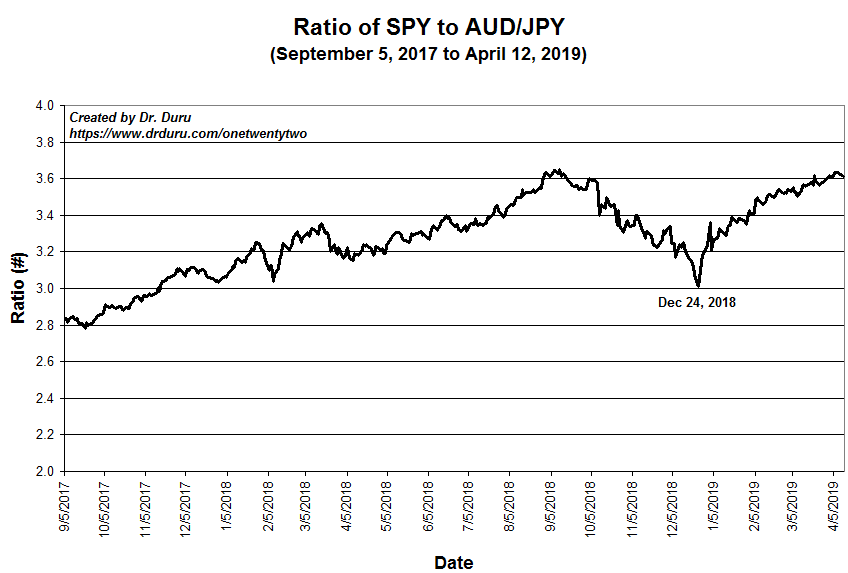
Source for prices: Yahoo Finance and FreeStockCharts
I used Friday’s surge to finally close out my long AUD/JPY position. I held this small position for different reasons through the churn of the last 4-5 months, and I am happy to take this profit along with the carry I collected over this time. On a short-term basis, AUD/JPY is a buy on the dips until/unless it closes under its 200DMA.
Be careful out there!
Full disclosure: no positions
2 thoughts on “Why the Australian Dollar and Japanese Yen Matter for Stock Traders”