
Stock Market Statistics
AT40 = 67.4% of stocks are trading above their respective 40-day moving averages (DMAs)
AT200 = 49.7% of stocks are trading above their respective 200DMAs
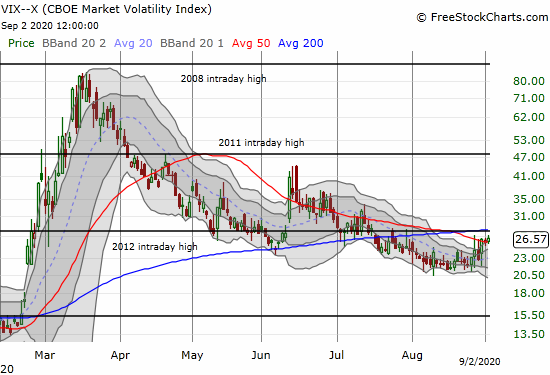
VIX = 26.6
Short-term Trading Call: cautiously bearish
Stock Market Commentary
Perhaps I will be sitting on the sidelines of the last 10%+ higher in the stock market.
The convincing signs of a bearish divergence transitioned into an overbought stock market last Friday. This week brought a quick end to overbought conditions that just missed triggering a fresh confirmation of bearish underlying conditions in the stock market. Now the stock market is making a bid to transform a persistent and stubborn rally into a parabolic run-up.
The Stock Market Indices
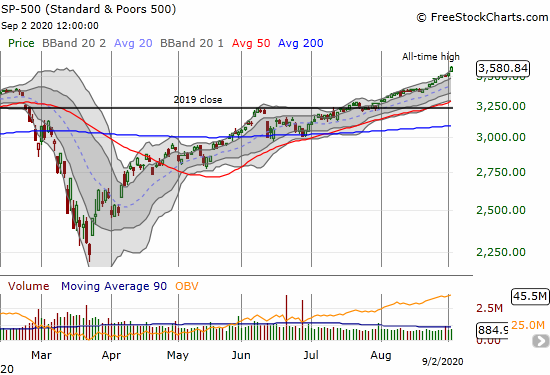
The S&P 500 (SPY) looks ready to go parabolic. The index stretched well above its upper Bollinger Band (BB) for a 1.5% gain and all-time high. While tech wavered for much of the day, the S&P 500 remained relatively strong most of the day. The index last performed this well on June 30th when it jumped away from 200DMA support on a 1.5% gain. While big cap tech has visibly led the way here, suddenly the rally looks ready to broaden into an all-out parabolic surge.
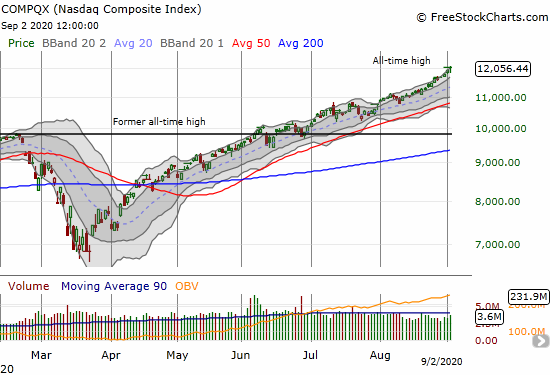
The NASDAQ (COMPQX) closed at or above its upper-BB for the sixth straight day. The tech laden index is on quite a streak of all-time highs. The NASDAQ is on a month-long rally that has managed o avoid getting parabolic and instead just keeps notching linear gains.
Volatility
The volatility index (VIX) is on the move upward despite the stubborn gains on the major indices. The VIX is signaling likely trouble around the corner. The VIX is one of the lingering bearish signals left from the cocktail that formed the last bearish divergence.
The Short-Term Trading Call
AT40 (T2108), the percentage of stocks trading above their respective 40-day moving averages (DMAs), jumped and closed at 67.4%. The week started with AT40 truncating the last overbought period at just one day. The next day, AT40 gapped down on a move that looked ready to flag the start of aggressive bearish trading. Instead, buyers managed to push AT40 to a gain. As a result, I stood down.
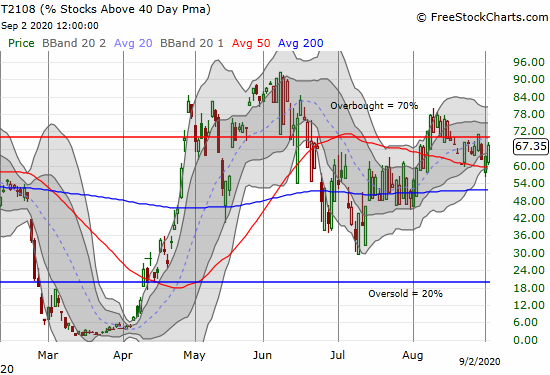
That close call demonstrated the value of having a conservative trigger for acting on my short-term bearish trading call. Increasingly, the downgrade to a bearish short-term trading call looks premature. Regardless, at this phase in the rally, I dislike the stock market the higher it gets. The inability of AT40 to make more progress even as the major indices keep pushing higher is yet one more demonstration of the narrowing of this ever more precarious rally. I continue to increase my cash levels given what I see as unsustainable (granted impressive!) price action.
Stock Chart Reviews – Below the 50DMA
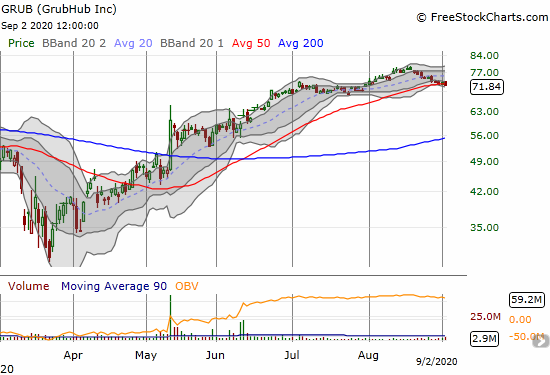
GrubHub (GRUB)
GrubHub (GRUB) slipped under its 50DMA with a fractional loss. This 50DMA breakdown is mainly notable given the relative bullishness of the rest of the market around GRUB. I will buy puts on the next lower close.
Stock Chart Reviews – Above the 50DMA
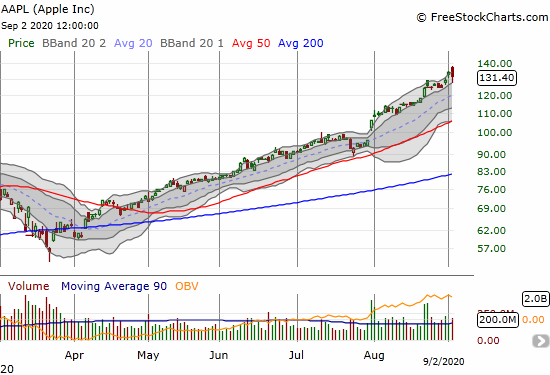
Apple (AAPL)
Apple (AAPL) actually lagged the market in a big way with a 2.1% loss. At its low of the day, AAPL was down over 4%. The stock market felt very bearish at that moment. Buyers stepped in to lift AAPL off the lower boundary of its upper Bollinger Band (BB) channel. AAPL has comfortably floated through this channel for a little over a month.
AAPL still ended the day looking toppy with a bearish engulfing pattern. The stock market’s closing strength surprised me given AAPL’s trials and tribulations. AAPL’s bearish engulfing is a fresh warning sign. A new all-time high on AAPL would open the floodgates for a fresh (parabolic) push higher for the major indices.
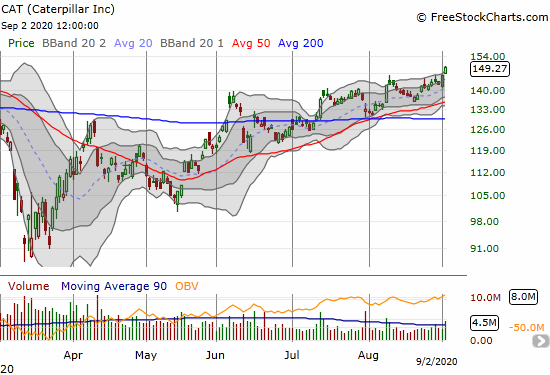
Caterpillar (CAT)
Caterpillar (CAT) is sawtoothing its way higher. At an 8-month high, CAT is making the case for investors to remain constructive on the stock market. CAT closed at its high of the day and never wavered.
Stock Chart Spotlight – Bullish Breakout
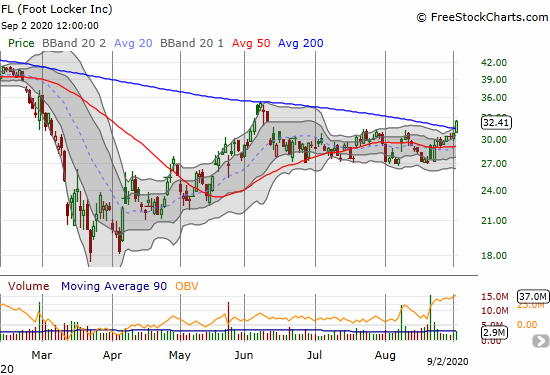
Foot Locker (FL)
Foot Locker (FL) closed above its 200DMA for the first time in 16 months. While I am bearish on the market, FL looks like a good hedge. In other words, a continued bullish run in the market should benefit FL. A new 200DMA breakout gives the stock a lot of room to run to the upside. Moreover, AT200 (T2107), the percentage of stocks trading above their respective 200DMAs, keeps creeping higher. AT200 closed at a fresh post-pandemic high.
— – —
FOLLOW Dr. Duru’s commentary on financial markets via email, StockTwits, Twitter, and even Instagram!
“Above the 40” uses the percentage of stocks trading above their respective 40-day moving averages (DMAs) to assess the technical health of the stock market and to identify extremes in market sentiment that are likely to reverse. Abbreviated as AT40, Above the 40 is an alternative label for “T2108” which was created by Worden. Learn more about T2108 on my T2108 Resource Page. AT200, or T2107, measures the percentage of stocks trading above their respective 200DMAs.
Active AT40 (T2108) periods: Day #100 over 20%, Day #94 over 30%, Day #39 over 40%, Day #35 over 50%, Day #21 over 60% (overperiod), Day #3 under 70% (underperiod)
Daily AT40 (T2108)
")
Black line: AT40 (T2108) (% measured on the right)
Red line: Overbought threshold (70%); Blue line: Oversold threshold (20%)
Weekly AT40 (T2108)

*All charts created using FreeStockCharts unless otherwise stated
The T2108 charts above are my LATEST updates independent of the date of this given AT40 post. For my latest AT40 post click here.
Be careful out there!
Full disclosure: long UVXY shares and puts
*Charting notes: FreeStockCharts stock prices are not adjusted for dividends. TradingView.com charts for currencies use Tokyo time as the start of the forex trading day. FreeStockCharts currency charts are based on Eastern U.S. time to define the trading day.