
Stock Market Statistics
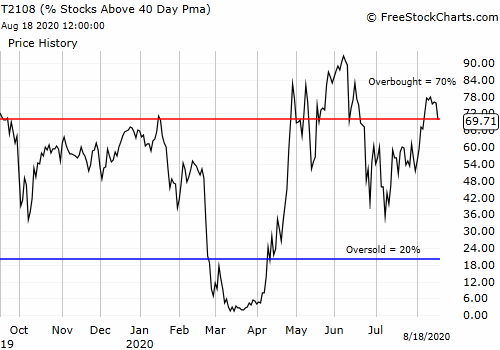
AT40 = 69.7% of stocks are trading above their respective 40-day moving averages (DMAs) (ended 7 overbought trading days)
AT200 = 44.7% of stocks are trading above their respective 200DMAs
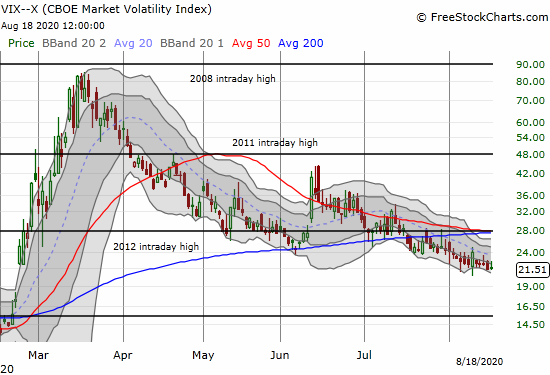
VIX = 21.5
Short-term Trading Call: cautiously bullish
Stock Market Commentary
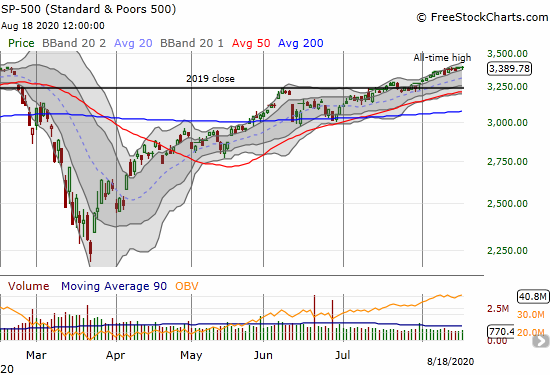
A stock market that keeps its focus on positive catalysts finally gained enough strength to nudge the S&P 500 (SPY) to its first all-time high since February 19, 2020. The move comes with a major caveat as the stock market’s advance stopped broadening. AT40 (T2108), the percentage of stocks trading above their respective 40-day moving averages (DMAs), fell enough to end the last overbought trading period at 7 days. Closing at 69.7%, AT40 is off about 7 percentage points from last week’s peak and is below the overbought threshold of 70%. The move was small enough to avoid a bearish divergence, but I am now on alert.
The Stock Market Indices
The slow-motion rally of the S&P 500 (SPY) finally sent the index to an all-time high. The 0.2% gain was just enough.
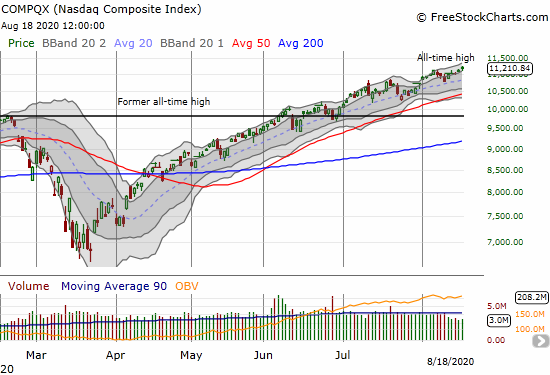
The NASDAQ (COMPQX) did what the NASDAQ does. A 0.7% gain sent the tech-laden index to yet another all-time high.
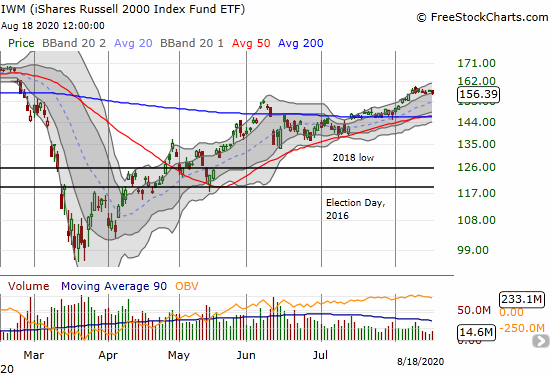
Small caps must have participated in ending overbought conditions. The iShares Russell 2000 Index Fund ETF (IWM) lost 0.9%. IWM failed to follow-through on its last breakout; the ETF has gone nowhere for 7 straight trading days.
Volatility
The volatility index (VIX) responded a bit to the negative tint in the trading action. The VIX gained 0.8%.
The Short-Term Trading Call

The cautiously bullish short-term trading call was comfy as the stock market. With overbought conditions coming to an end, the short-term trading call is now only comfy as the NASDAQ. The conditions for staying cautiously bullish adjust to an AT40 remaining above 60% and at least the S&P 500 or the NASDAQ trading above their respective uptrending 20DMAs.
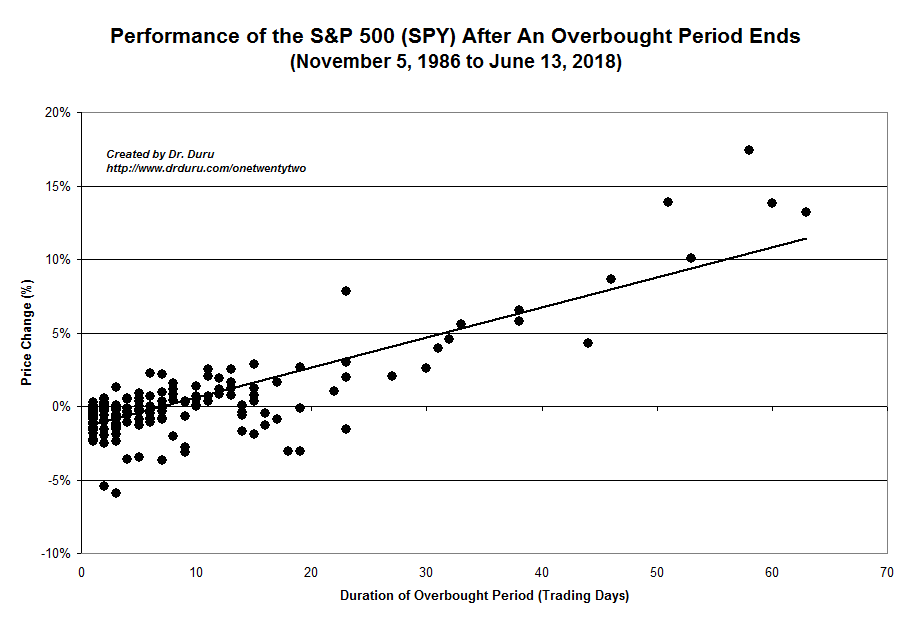
The S&P 500 gained 1.1% in the last overbought period. This performance is in-line with historic performance.
Stock Chart Reviews – Below the 50DMA
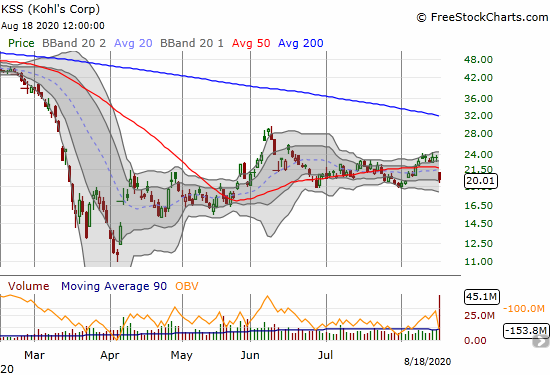
Kohl’s (KSS)
Department store Kohl’s (KSS) reminded markets of the reality facing consumers and retailers reliant on the spending power of these consumers. KSS lost 14.7% and suffered a 50DMA breakdown after posting disappointing earnings. Kohl’s tried to put a brave face on the situation in the conference call:
“While we are planning for the crisis to continue to present headwinds in the near-term, we are very confident that we will not only weather the storm, but also take full advantage of the opportunities that emerge from it. We are a well-disciplined operator. We have a strong foundation and we are evolving our strategies, which together uniquely positions us to capitalize on the changing consumer behaviors, and the significant disruption of the retail industry.”
Stock Chart Reviews – Above the 50DMA
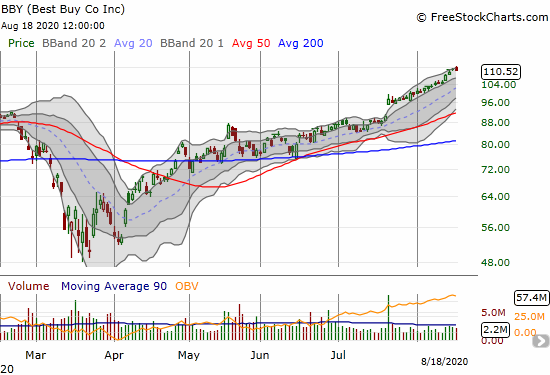
Best Buy Co Inc (BBY)
And then there’s electronics retailer Best Buy (BBY). Best Buy is riding the tide of equipping homes for the work-from-home, distance learning, remote lifestyle. BBY cracked its former all-time high on July 22nd with a gap up and 7.8% gain. The stock has not looked back since the company provided upbeat preliminary sales guidance and announced pay raises for its employees:
“The company’s Q2 FY21 quarter-to-date sales through July 18 increased approximately 2.5% compared to the prior year…Quarter-to-date through July 18, online sales growth was approximately 255% compared to the prior year. Quarter-to-date through July 18, the largest sales growth drivers were the computing, appliance and tablet categories. In the period starting June 15, when the company began opening stores for shopping, through July 18, the company’s sales growth was approximately 15% compared to the prior year.”
Best Buy next reports earnings this week on August 25th. The price run-up to this point should have priced in the good news…
Stock Chart Spotlight – Bullish Breakout
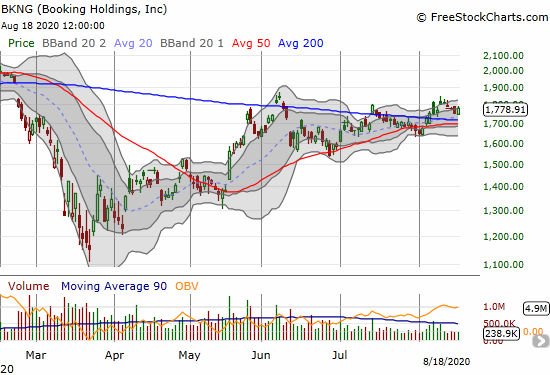
Booking Holdings, Inc (BKNG)
Travel services company Booking Holdings (BKNG) is on its third 200DMA breakout since June. This breakout came on the heels of a well-received earnings report. While this breakout is the longest-lasting of the three, momentum is waning. BKNG is barely holding positive post-earnings gains. A new post breakout high confirms the bullishness of the move; I am a buyer after that move. If this breakout fails, I will watch closing for a potential confirmed 50DMA breakdown and flip to bearish territory.
— – —
FOLLOW Dr. Duru’s commentary on financial markets via email, StockTwits, Twitter, and even Instagram!
“Above the 40” uses the percentage of stocks trading above their respective 40-day moving averages (DMAs) to assess the technical health of the stock market and to identify extremes in market sentiment that are likely to reverse. Abbreviated as AT40, Above the 40 is an alternative label for “T2108” which was created by Worden. Learn more about T2108 on my T2108 Resource Page. AT200, or T2107, measures the percentage of stocks trading above their respective 200DMAs.
Active AT40 (T2108) periods: Day #89 over 20%, Day #83 over 30%, Day #28 over 40%, Day #24 over 50%, Day #10 over 60% (overperiod), Day #1 under 70% (underperiod ending 6 days over 70%)
Daily AT40 (T2108)
")
Black line: AT40 (T2108) (% measured on the right)
Red line: Overbought threshold (70%); Blue line: Oversold threshold (20%)
Weekly AT40 (T2108)

*All charts created using FreeStockCharts unless otherwise stated
The T2108 charts above are my LATEST updates independent of the date of this given AT40 post. For my latest AT40 post click here.
Be careful out there!
Full disclosure: long UVXY shares and puts
*Charting notes: FreeStockCharts stock prices are not adjusted for dividends. TradingView.com charts for currencies use Tokyo time as the start of the forex trading day. FreeStockCharts currency charts are based on Eastern U.S. time to define the trading day.